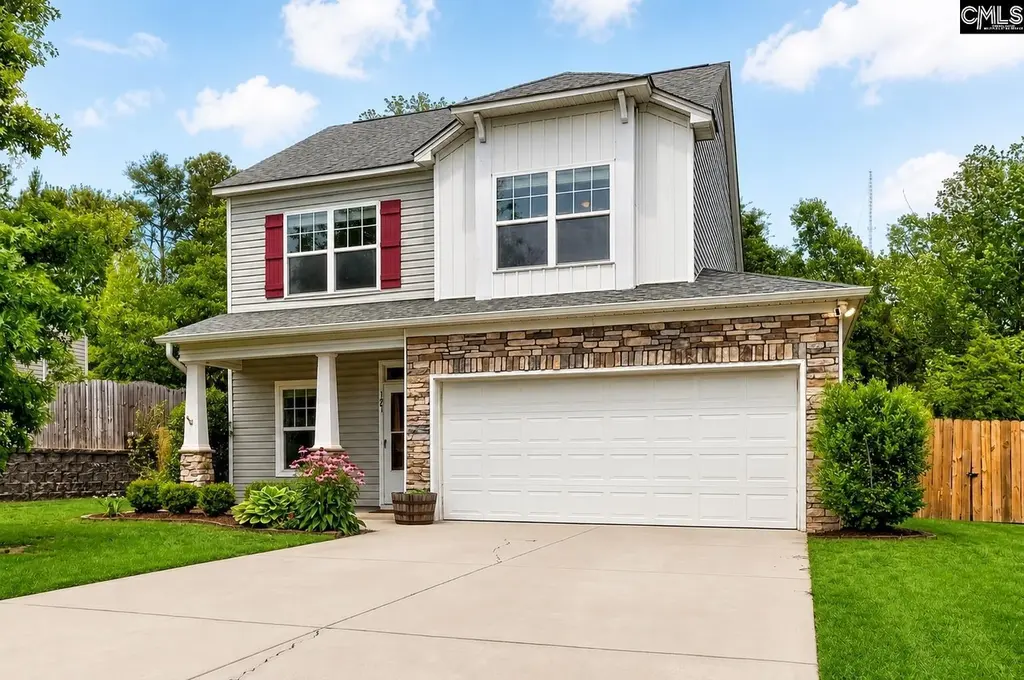
121 Mews Way · Lexington, SC
Flood risk 1/10 · Minimal
- FEMA flood zone
- X (unshaded)
- Chance of flooding over 30 yrs
- 0.0%
- Est. flood insurance / yr
- $507 – $1,088
Fire risk 3/10 · Minor
- Est. fire insurance / yr
- $783 – $1,453
Heat risk 7/10 · Major
- Hot days now (above 108°F)
- 7 days/yr
- Hot days in 30 yrs
- 16 days/yr
Wind risk 6/10 · Moderate
- Chance of severe wind over 30 yrs
- 67.0%
Air-quality risk 3/10 · Minor
- Unhealthy air days now
- 2 days/yr
- Unhealthy air days in 30 yrs
- 2 days/yr
Risk factors via First Street. Map © Google.
Why this score? — see what drove the D- grade
The composite is a weighted blend of 9 inputs, each scored 0–100. Each bar is that input's sub-score; the figure is the points it added to the 100-point composite (weight × sub-score).
- Cash flow +12.5/30.0
- ARV discount +5.9/15.0
- Schools +4.2/10.0
- Livability +4.0/5.0
- DSCR +3.7/10.0
- Rent growth +3.3/5.0
- 1% rule +2.5/10.0
- Condition / age +2.5/5.0
- Appreciation +0.0/10.0
$269,900
🖨 Deal sheet (PDF) 📄 Offer letter ✓ Due diligence
Listing remarks
Welcome to this inviting home tucked away on a quiet cul-de-sac in Richmond Farms! With 3 bedrooms, 2.5 baths, and a flexible, functional layout, this home offers the space, comfort, and updates today’s buyers are looking for. The main-level primary suite is a true retreat, featuring a giant bedroom, walk-in closet, and private bath with double vanity and garden tub. The kitchen opens to the main living and dining areas, creating an easy flow for everyday living and entertaining, and includes great cabinet space, pantry storage, an updated dishwasher, and a refrigerator that stays. Upstairs, you’ll find two additional bedrooms, both with walk-in closets, plus a versatile flex sp
Key facts
- Updated dishwasher
- Walk-in closet
- Private bath
Tags
Property features AI
Finance
- Other: Community pool; Sidewalks in the community
- HOA & community: Has homeowners association; Association maintains common areas, playground, pool, and street lights
Exterior
- Parking: Attached garage with 2 spaces (main level)
- Utilities: Public water; Public sewer
- Home design: Two-story home
- Construction: Stone and vinyl exterior; Slab foundation
- Exterior features: Covered front porch; Deck; Patio; Storage shed; Full gutters; Privacy wood fence in rear; Paved road access
Interior
- Kitchen: Bar area; Pantry; Formica countertops; Tile flooring; Painted cabinets; Dishwasher; Disposal; Refrigerator; Microwave above stove; Smooth surface range; Recessed lighting
- Bedrooms: Master bedroom on main level with double vanity, garden tub, walk-in closet, and vinyl flooring; Bedroom 2 on second level with shared bath, tub/shower, ceiling fan, and carpet; Bedroom 3 on second level with shared bath, tub/shower, ceiling fan, and carpet
- Flooring: Luxury vinyl plank in living room; Vinyl flooring in master bedroom; Carpet in secondary bedrooms; Tile in kitchen
- Bathrooms: Two full bathrooms; One half bathroom; Main level: one full bath and one half bath
- Heating & cooling: Central heating; Central air conditioning
- Interior features: Smoke detector; Pull-down attic access; French doors; Vaulted ceiling in living room; Ceiling fans; Recessed lighting; Formal dining area; Office
- Laundry & utility: Main-level utility/laundry room
Neighborhood map
What this means for you Summary
Snapshot
- This is a 3-bed/2.5-bath single-family listed at $270k.
Deal economics
- At list price, monthly cash flow is $-37 ($-445/yr) — negative.
- To cash-flow at today's rent, offer at most $263k (2.4% below list).
- To meet the 1% rule (rent ≥ 1% of price), the offer needs to be $203k (24.8% below list).
- Recommended offer: $203k (24.8% below list) — sets the bar for 1% rule.
Location & tenants
- Location reads 81/100 on livability (#8 in SC, #1,502 nationally) — a professional / high-income tenant draw. Strengths: housing A+, health & safety A+, employment A; Watch: commute F.
- Lexington 01 (suburban): math 42% / reading 53% proficiency, ranked #11 of 80 in SC (top 14%) — families likely to look elsewhere, expect single-tenant / working-renter base with shorter leases.
- Zoned schools: Pleasant Hill Elementary (math 57% / reading 61%, grade B-, #93 of 597 statewide, top 16%, 898 students, 14% FRL); Pleasant Hill Middle (math 50% / reading 58%, grade B-, #27 of 229 statewide, top 12%, 748 students, 21% FRL); Lexington High (math 69% / reading 92%, grade A, #23 of 196 statewide, top 11%, 2,410 students, 17% FRL).
- Zoned-school proficiency averages 64% at this address vs 48% district-wide (+17 pts) — the actual schools serving this property are materially stronger than the Lexington 01 average implies; a family-tenant draw the district grade alone would hide.
- Market conditions: Rents rising (+3.2%/yr); 714 active listings in the ZIP; 7 comparable units currently listed for rent nearby; rentals at typical pace (median 24d on market — plan ~3-4 weeks tenant-placement turnaround); solid renter incomes; 1,712 units permitted in Lexington County in 2024 (0 in 5+ unit buildings).
Forward outlook
- Local home prices are declining (-3.0%/yr); year-one equity from $2k of loan paydown is wiped out by about $8k of value loss. Plan a longer hold.
- Lexington County population projected at +26% by 2050 — long-run rental-demand tailwind backs the buy-and-hold thesis.
Negotiation context
- It's been on market 43 days — a 3% lower offer ($262k) is reasonable based on typical stale-listing flexibility.
- 2 sale attempts with the ask held roughly flat each time — persistent listings suggest the price (not the market) is what's stuck; bring a comps-based counter.
- Current owner paid $111k; list at $270k implies a 143% gain — meaningful room to come down on a strong offer.
Risks & watch-outs
- Climate carrying-cost: major wind risk, 67% chance of damaging wind over 30y; extreme-heat days projected 7→16/yr by 2055 (HVAC capex compounding) — expect insurance premiums to compound above CPI over the hold.
Questions for the listing agent
- What do current leases actually rent for vs. the listed asking? Can we see a recent rent roll and the last 12 months of T-12 income?
- It's been on market 43 days. Have you received any prior offers? Is the seller open to a 25% concession, seller financing, or rate buy-down credit?
- What does the HOA fee cover, when was the last increase, and are there any pending special assessments or reserve-fund shortfalls?
- Is there a deadline driving the sale (1031 exchange, divorce, estate, relocation)? That informs how much negotiation room exists.
- Schools are B-rated — typically a magnet for longer-tenancy family renters. What's the average tenant stay here, and is there a school-zone premium baked into asking?
- The area grade is low — what's the realistic commute time and amenity access for the typical tenant pool here? Any planned neighborhood developments (good or bad) we should know about?
- What's the average days-on-market for RENTAL listings here right now (not sales)? A rising rental-DOM trend means longer vacancies and softer asking-rent achievability than the comps imply.
- What's the recent tenant-quality profile in this submarket — average credit score on applications, eviction rate, late-payment / NSF rate, and stable-employment percentage? A property-management company in the area should have these aggregated.
- How much new for-sale + rental construction is in the pipeline within 1–3 miles? Heavy new supply typically softens prices + rents 12–24 months out; constrained supply supports both.
Investment metrics
- 1% rule
- 0.75% ✗
- Cap rate
- 6.13%
- Cash-on-cash
- -0.59%
- DSCR
- 0.97
- GRM
- 11.1
CMA / ARV
- ARV (on-the-fly)
- $260,854
- Comps found
- 1
Show comp detail 1 sale within ~0.75 mi
| Address | Dist | Beds/Ba | Sqft | Sold | Price | $/sf | Match |
|---|---|---|---|---|---|---|---|
| 129 Dawson Hill Ln | 0.15mi | 3/2.5 | 1,644 (-10%) | 5mo | $234,000 | $142 | 71 |
Match score weights: distance 35% · size 25% · config 20% · recency 20%. Top-matched comps best support the ARV.
Projected returns pro-forma
-3.0% appreciation · 3.23% rent growth · sell at horizon
- IRR
- -17.1%
- Equity multiple
- 0.39×
- Total profit
- $-45,733
- Equity at exit
- $40,243
- IRR
- -8.7%
- Equity multiple
- 0.45×
- Total profit
- $-41,357
- Equity at exit
- $23,336
Cash invested: $75,572 (down + closing). Projections, not guarantees.
Landlord ↔ Tenant lean methodology
- Overall (STATE)
- 90 Strongly Landlord-Friendly
- State South Carolina
- 90 Strongly Landlord-Friendly · R+6
- County
- — inherits STATE
- City
- — inherits STATE
ZIP-level market 29072
- Rents YoY
- 3.2%
- Active inventory
- 714
- Price-to-rent
- 11.1×
Monthly cashflow live
- Estimated rent
- $2,031 high interval (Pro) →
- Mortgage (P&I)
- −$1,415
- Tax from tax record
- −$75 /mo · $905/yr
- Insurance
- −$112
- HOA
- −$38
- Vacancy / Maint / Mgmt
- −$426
- Net cashflow
- $-37
Break-even live
Sensitivity live
| Price | -10% $116 | -5% $39 | +0% $-37 | +5% $-113 | +10% $-190 |
|---|---|---|---|---|---|
| Rent | -10% $-197 | -5% $-117 | +0% $-37 | +5% $43 | +10% $123 |
| Rate | -1.0pp $99 | -0.5pp $32 | base $-37 | +0.5pp $-107 | +1.0pp $-178 |
UW: 25.0% down · 7.5% · 30yr · 1.5% tax · 5.0% vac · 8.0% maint · 8.0% mgmt
Financing live
Cash to close
- Down payment
- $67,475
- Closing costs
- $8,097
- Reserves months
- —
- Total cash needed
- —
Loan-product check · same deal, 3 products live
Conventional
25% down · 7.5% · 30yr
- Down + closing
- —
- Monthly P&I
- —
- Monthly cashflow
- —
- DSCR
- —
- Eligible?
- —
Personal DTI + credit; lowest rate.
DSCR
20% down · 8.5% · 30yr
- Down + closing
- —
- Monthly P&I
- —
- Monthly cashflow
- —
- DSCR
- —
- Eligible?
- —
No personal income docs; deal must DSCR.
Hard money
10% down · 12.0% · 12mo
- Down + closing
- —
- Monthly P&I
- —
- Monthly cashflow
- —
- DSCR
- —
- Eligible?
- —
Short-term bridge; refi at stabilization.
Rent comps 7 comps
| Address | Beds | Baths | Sqft | Rent | $/sqft | DOM | Units | Dist |
|---|---|---|---|---|---|---|---|---|
| 926 Dawsons Park Way Lexington, SC | 3.0 | 2.5 | 1468 | $1,879 | $1.28 | 16d | 1 | 0.90mi |
| 759 Dawsons Park Way Lexington, SC | 3.0 | 2.5 | 1468 | $1,869 | $1.27 | 23d | 1 | 1.05mi |
| 333 Canary Grass Ct Lexington, SC | 3.0 | 2.5 | 1672 | $1,950 | $1.17 | 16d | 1 | 1.14mi |
| 142 Jeremiah Rd Lexington, SC | 3.0 | 2.0 | 2094 | $2,133 | $1.02 | 25d | 1 | 1.23mi |
| 421 Hosea Ct Lexington, SC | 3.0 | 2.5 | 1861 | $1,950 | $1.05 | 5d | 1 | 1.27mi |
| 409 Hosea Ct Lexington, SC | 3.0 | 2.5 | 1861 | $2,095 | $1.13 | 25d | 1 | 1.28mi |
| 219 Luna Trl Lexington, SC | 3.0 | 3.0 | 2585 | $2,550 | $0.99 | 25d | 1 | 1.47mi |
HOA detail
- Monthly dues
- $38 · $456/yr
Listing history 6 events
-
2026-05-14historical Active - Contingent
-
2026-05-13status Active
-
2026-05-13historical Active - Contingent
-
2026-05-08price $269,900
-
2026-04-16$274,900 Active
-
2011-02-03soldstatus $110,900
ⓘ Source: listings_history table (triggers on properties + properties_extension) + one-shot
backfill from property_details.listing_events for pre-trigger history.
Tax reassessment forecast SC · Resets to sale price
- Current annual tax
- $905 · $75/mo
- Projected year-2 tax
- $1,538 · $128/mo
- Expected delta
- +$634/yr (+$53/mo · 70.0%)
ⓘ Screening estimate from a state-policy table — verify with the county assessor before closing.
Climate risk First Street
- Flood 1/10 Low FEMA zone X (unshaded) · 0% chance over 30 yrs
- Wildfire 3/10 Moderate
- Heat 7/10 Severe 7 d/yr ≥108°F today · 16 d/yr by 30 yrs out
- Wind 6/10 Major 67% chance of damaging wind over 30 yrs
- Air quality 3/10 Moderate 2 unhealthy d/yr today · 2 by 30 yrs out
Nearby sold comps map
Loading sold comps map…
Walkable amenities ~0.75 mi
Loading nearby amenities…
Taxation est. · year 1
- Rental income
- $24,367
- − Mortgage interest
- −$15,119
- − Property taxes
- −$905
- − Insurance
- −$1,350
- − Repairs & maintenance
- −$1,949
- − Management
- −$1,949
- − HOA
- −$456
- − Depreciation
- −$7,852
- Taxable loss
- −$5,212
- Est. tax savings @ 24.0%
- +$1,251
- After-tax cash flow
- $806/yr
For passive investors: Depreciation is non-cash, so a rental often shows a tax loss while cash-flowing — sheltering income. Rental losses are passive: they offset passive income freely, and up to $25,000/yr can offset ordinary (W-2) income if you actively participate and your MAGI is under $100k (phasing out to $0 by $150k); unused losses carry forward. On sale, claimed depreciation is recaptured at up to 25%, and gains may owe capital-gains tax (a 1031 exchange can defer both). Figures are a year-1 estimate at your 24.0% rate — not tax advice; consult a CPA.
Schools (NCES district)
- District
- Lexington 01
- NCES district ID
- 4502700
- Math proficiency
- 42% ▼ -12.00%
- Reading proficiency
- 53% ▼ -2.00%
- Median HH income
- $61,298
- Composite
- 41.75/100
- National rank
- #3399
- State rank
- #11 of 80 in SC
Livability — Lexington
- Score
- 81/100
- State rank
- #8
- US rank
- #1502
Category grades
Schools grade is shown separately in the Schools card above.
Census & demographics
- County
- Lexington County · 232,571 people
- City population
- 122,563
- Metro
- Columbia, SC
- Population (ZIP)
- 69,407
- Household income
- $106,382
- Rent vs Own
- Severe rent burden
- 858.0
Population outlook (Lexington County) Hauer SSP2
- Today (2025)
- 322,999 people
- By 2030
- 342,356 · +6.0%
- By 2040
- 377,715 · +16.9%
- By 2050
- 406,984 · +26.0%
- By 2075
- 465,447 · +44.1%
- By 2100
- 485,674 · +50.4%
Race, ethnicity, and origin ACS 2023
- Neighborhood character
- Predominantly White (80%)
- Race & ethnicity
- White 80% Black 7% Hispanic / Latino 5% Two or more races 5% Asian 4%
- Hispanic origin (detail)
- Mexican 1%
- Common ancestry
- Italian 4% Serbian 3% Romanian 3%
- Foreign-born
- 7% · Canada, Jamaica, China
- Languages at home
- 91% English-only · Spanish 4% Other Indo-European 1% Other Asian/Pacific 1%
Political lean MEDSL · Lexington
- 2024 margin
- Solid R (+33.5) · D 32.5% · R 66.0% · Other 1.4%
- 2008→2024 swing
- +4.6pp toward D · 2008: -38.0pp · 2024: -33.5pp
- All cycles
- 2024: R+33.5 2020: R+30.1 2016: R+36.7 2012: R+37.8 2008: R+38.0
Not yet ingested
- Civics
- —
Market trends
- HPI YoY
- ▼ -197.53%
- Current HPI
- 212.3235
- Rent YoY
- ▲ 3.23%
- Metro
- Columbia, SC
- State GDP YoY
- ▲ 4.51%
- F500 in state
- 2
Industry mix (Fortune 500 HQ in SC)
| Industry | F500 HQs | Revenue |
|---|---|---|
| Packaging | 1 | $7B |
|
||
Price history
+143.4% since first listed6 events — show timeline
- 2026-05-14 Contingent — Consolidated MLS
- 2026-05-13 Relisted — Consolidated MLS
- 2026-05-13 Contingent — Consolidated MLS
- 2026-05-08 Price Changed $269,900 Consolidated MLS
- 2026-04-16 Listed $274,900 Consolidated MLS
- 2011-02-03 Sold (Public Records) $110,900 Public Records
Property tax history
-8.0%/yrLatest (2024): $905 · +4.4% YoY. Source: county tax records.
Cash-flow waterfall
monthlySold comps — $/sqft
last 12 mo · ≤1 miLoading sold comps…