 🏗️ New Construction
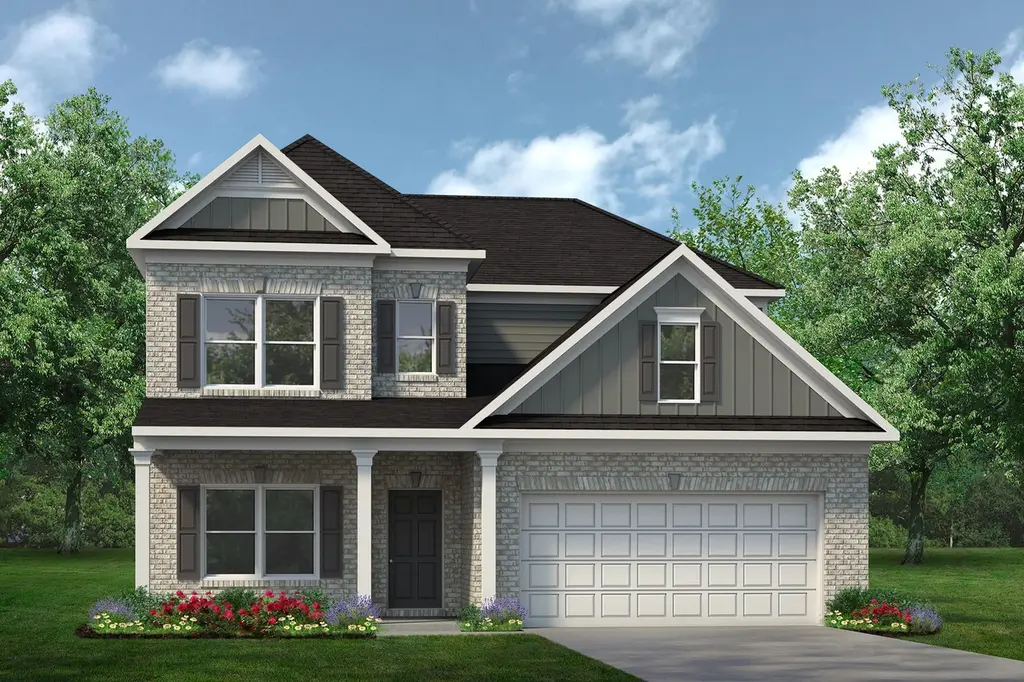
The Palmer Plan · Willis, TX
Flood risk No data
- FEMA flood zone
- —
- Chance of flooding over 30 yrs
- —
- Est. flood insurance / yr
- —
Fire risk No data
- Est. fire insurance / yr
- —
Heat risk No data
- Hot days now (above threshold)
- —
- Hot days in 30 yrs
- —
Wind risk No data
- Chance of severe wind over 30 yrs
- —
Air-quality risk No data
- Unhealthy air days now
- —
- Unhealthy air days in 30 yrs
- —
Risk factors via First Street. Map © Google.
Why this score? — see what drove the F grade
The composite is a weighted blend of 9 inputs, each scored 0–100. Each bar is that input's sub-score; the figure is the points it added to the 100-point composite (weight × sub-score).
- ARV discount +7.5/15.0
- Cash flow +4.4/30.0
- Condition / age +4.0/5.0
- Schools +3.2/10.0
- Livability +3.1/5.0
- Rent growth +2.0/5.0
- 1% rule +0.5/10.0
- DSCR +0.0/10.0
- Appreciation +0.0/10.0
$274,990
🖨 Deal sheet (PDF) 📄 Offer letter ✓ Due diligence
Listing remarks
Welcome to the Palmer, a large home featuring a standard first-floor owner's suite and the unique option of a second owner's suite upstairs. The first floor features open living and dining areas. At the top of the stairs, you'll be greeted by a huge loft and three additional bedrooms, two with walk-in closets. An optional second owner's suite includes a more cozy yet ample loft area. In either configuration, a junior en suite bedroom is standard.
Key facts
- Second owner's suite
- Huge loft
- 2 parking spots
Tags
Property features AI
Finance
- Financial info: List price indicated (listing details provided separately)
Exterior
- Parking: 2 parking spaces
- Utilities: Natural gas available; Electric service available; Central air conditioning
- Home design: Single-family plan (The Palmer); New construction plan
- Construction: New construction (model/plan: The Palmer); Living area approximately 2,934
- Exterior features: Located at 12595 Canyon Falls Blvd, Willis TX 77318
Interior
- Kitchen: Includes standard kitchen (plan details not specified)
- Bedrooms: 4 bedrooms
- Bathrooms: 3 full bathrooms; 1 half bathroom
- Heating & cooling: Natural gas heating; Electric heating; Heat pump; Central air conditioning
- Interior features: Open floor plan (model: The Palmer); Plan-style new construction
- Laundry & utility: Washer/dryer connections (typical for new construction)
Neighborhood map
What this means for you Summary
Snapshot
- This is a 4-bed/3.5-bath single-family listed at $275k. Condition is rated good.
Deal economics
- At list price, monthly cash flow is $-1k ($-14k/yr) — negative.
- The deal already cash-flows at list — no discount required.
- To meet the 1% rule (rent ≥ 1% of price), the offer needs to be $248k (9.8% below list).
- Recommended offer: $248k (9.8% below list) — sets the bar for 1% rule.
- Cap rate 3.2% vs local median 4.7% in Willis — below-typical yield; the buyer is paying a premium for something (appreciation thesis, condition, location) that the cap rate doesn't capture.
Location & tenants
- Location reads 62/100 on livability (#933 in TX) — a middle-class / working-renter tenant base. Strengths: cost of living A+, housing A+; Watch: crime C-, schools D+, employment D+.
- Willis ISD (rural): math 33% / reading 40% proficiency, ranked #458 of 826 in TX (top 55%) — families likely to look elsewhere, expect single-tenant / working-renter base with shorter leases.
- Market conditions: Rents soft (-2.1%/yr); 1199 active listings in the ZIP; 1 comparable units currently listed for rent nearby; solid renter incomes; 13,259 units permitted in Montgomery County in 2024 (1,402 in 5+ unit buildings).
- This rent runs 32% of the median local income ($92k/yr) — at the standard rent-burdened threshold; future hikes will face affordability resistance.
Forward outlook
- Local home prices are declining (-3.0%/yr); year-one equity from $3k of loan paydown is wiped out by about $14k of value loss. Plan a longer hold.
- Montgomery County population projected at +65% by 2050 — long-run rental-demand tailwind backs the buy-and-hold thesis.
Negotiation context
- It's been on market 23 days — a 2% lower offer ($271k) is reasonable based on typical stale-listing flexibility.
Questions for the listing agent
- What do current leases actually rent for vs. the listed asking? Can we see a recent rent roll and the last 12 months of T-12 income?
- Is there a deadline driving the sale (1031 exchange, divorce, estate, relocation)? That informs how much negotiation room exists.
- Schools are D-rated, which usually means shorter tenancies and higher turnover. Who's the typical renter profile here, and what's been the actual vacancy rate?
- The area grade is low — what's the realistic commute time and amenity access for the typical tenant pool here? Any planned neighborhood developments (good or bad) we should know about?
- What's the average days-on-market for RENTAL listings here right now (not sales)? A rising rental-DOM trend means longer vacancies and softer asking-rent achievability than the comps imply.
- What's the recent tenant-quality profile in this submarket — average credit score on applications, eviction rate, late-payment / NSF rate, and stable-employment percentage? A property-management company in the area should have these aggregated.
- How much new for-sale + rental construction is in the pipeline within 1–3 miles? Heavy new supply typically softens prices + rents 12–24 months out; constrained supply supports both.
Investment metrics
- 1% rule
- 0.55% ✗
- Cap rate
- 3.17%
- Cash-on-cash
- -11.15%
- DSCR
- 0.50
- GRM
- 15.3
CMA / ARV
- ARV (on-the-fly)
- $454,770
- Comps found
- 11
Show comp detail 11 sales within ~0.75 mi
| Address | Dist | Beds/Ba | Sqft | Sold | Price | $/sf | Match |
|---|---|---|---|---|---|---|---|
| 224 Warbler Song Dr | 0.66mi | 4/3.5 | 2,954 (+1%) | 8mo | $389,990 | $132 | 62 |
| 240 Warbler Song Dr | 0.68mi | 4/3.5 | 2,861 (-2%) | 4mo | $424,990 | $149 | 61 |
| 402 Northern Cardinal Ct | 0.66mi | 4/3.5 | 2,818 (-4%) | 2mo | $559,313 | $198 | 61 |
| 136 Mockingbird Trails Dr | 0.73mi | 4/3.5 | 3,100 (+6%) | 1mo | $429,990 | $139 | 56 |
| 256 Warbler Song Dr | 0.72mi | 4/3.5 | 2,881 (-2%) | 13mo | $409,990 | $142 | 53 |
| 496 Golden St Unit A | 0.52mi | 3/2.5 (-1) | 3,020 (+3%) | 18mo | $740,000 | $245 | 47 |
| 223 Warbler Song Dr | 0.69mi | 4/3.0 | 3,320 (+13%) | 2mo | $514,733 | $155 | 43 |
| 239 Warbler Song Dr | 0.70mi | 4/3.0 | 2,497 (-15%) | 0mo | $399,990 | $160 | 40 |
| 140 Mockingbird Trails Dr | 0.72mi | 4/3.0 | 2,513 (-14%) | 1mo | $364,990 | $145 | 40 |
| 119 Mockingbird Trails Dr | 0.75mi | 4/3.5 | 3,306 (+13%) | 8mo | $519,960 | $157 | 38 |
| 260 Warbler Song Dr | 0.73mi | 4/3.0 | 2,505 (-15%) | 11mo | $417,990 | $167 | 30 |
Match score weights: distance 35% · size 25% · config 20% · recency 20%. Top-matched comps best support the ARV.
Projected returns pro-forma
-3.0% appreciation · 0.0% rent growth · sell at horizon
- IRR
- -39.9%
- Equity multiple
- -0.23×
- Total profit
- $-156,296
- Equity at exit
- $67,808
- IRR
- -85.5%
- Equity multiple
- -1.05×
- Total profit
- $-261,092
- Equity at exit
- $39,320
Cash invested: $127,336 (down + closing). Projections, not guarantees.
Landlord ↔ Tenant lean methodology
- Overall (STATE)
- 87 Strongly Landlord-Friendly
- State Texas
- 87 Strongly Landlord-Friendly · R+5
- County
- — inherits STATE
- City
- — inherits STATE
ZIP-level market 77318
- Home prices YoY
- -32.7%
- Rents YoY
- -2.1%
- Active inventory
- 1199
- Price-to-rent
- 9.2×
Monthly cashflow live
- Estimated rent
- $2,480 medium interval (Pro) →
- Mortgage (P&I)
- −$2,385
- Tax est. 1.5%
- −$568 /mo · $6,822/yr
- Insurance
- −$189
- HOA
- −$0
- Vacancy / Maint / Mgmt
- −$521
- Net cashflow
- $-1,183
Break-even live
Sensitivity live
| Price | -10% $-869 | -5% $-1,026 | +0% $-1,183 | +5% $-1,341 | +10% $-1,498 |
|---|---|---|---|---|---|
| Rent | -10% $-1,379 | -5% $-1,281 | +0% $-1,183 | +5% $-1,085 | +10% $-987 |
| Rate | -1.0pp $-954 | -0.5pp $-1,068 | base $-1,183 | +0.5pp $-1,301 | +1.0pp $-1,421 |
UW: 25.0% down · 7.5% · 30yr · 1.5% tax · 5.0% vac · 8.0% maint · 8.0% mgmt
Financing live
Cash to close
- Down payment
- $113,692
- Closing costs
- $13,643
- Reserves months
- —
- Total cash needed
- —
Loan-product check · same deal, 3 products live
Conventional
25% down · 7.5% · 30yr
- Down + closing
- —
- Monthly P&I
- —
- Monthly cashflow
- —
- DSCR
- —
- Eligible?
- —
Personal DTI + credit; lowest rate.
DSCR
20% down · 8.5% · 30yr
- Down + closing
- —
- Monthly P&I
- —
- Monthly cashflow
- —
- DSCR
- —
- Eligible?
- —
No personal income docs; deal must DSCR.
Hard money
10% down · 12.0% · 12mo
- Down + closing
- —
- Monthly P&I
- —
- Monthly cashflow
- —
- DSCR
- —
- Eligible?
- —
Short-term bridge; refi at stabilization.
Rent comps 1 comps
| Address | Beds | Baths | Sqft | Rent | $/sqft | DOM | Units | Dist |
|---|---|---|---|---|---|---|---|---|
| 347 Skyline Ridge Dr Willis, TX | 3.0 | 3.0 | 3000 | $3,100 | $1.03 | 44d | 1 | 1.43mi |
Listing history 14 events
-
2026-06-21days on market $274,990 Active 23 DOM
-
2026-06-18days on market $274,990 Active 20 DOM
-
2026-06-17days on market $274,990 Active 19 DOM
-
2026-06-16days on market $274,990 Active 18 DOM
-
2026-06-15days on market $274,990 Active 17 DOM
-
2026-06-13days on market $274,990 Active 15 DOM
-
2026-06-09days on market $274,990 Active 11 DOM
-
2026-06-08days on market $274,990 Active 10 DOM
-
2026-06-07days on market $274,990 Active 9 DOM
-
2026-06-04days on market $274,990 Active 6 DOM
-
2026-06-03days on market $274,990 Active 5 DOM
-
2026-06-02days on market $274,990 Active 4 DOM
-
2026-06-01days on market $274,990 Active 3 DOM
-
2026-05-31days on market $274,990 Active 2 DOM
ⓘ Source: listings_history table (triggers on properties + properties_extension) + one-shot
backfill from property_details.listing_events for pre-trigger history.
Nearby sold comps map
Loading sold comps map…
Walkable amenities ~0.75 mi
Loading nearby amenities…
Taxation est. · year 1
- Rental income
- $29,763
- − Mortgage interest
- −$25,474
- − Property taxes
- −$6,822
- − Insurance
- −$2,274
- − Repairs & maintenance
- −$2,381
- − Management
- −$2,381
- − Depreciation
- −$13,230
- Taxable loss
- −$22,798
- Est. tax savings @ 24.0%
- +$5,472
- After-tax cash flow
- $-8,729/yr
For passive investors: Depreciation is non-cash, so a rental often shows a tax loss while cash-flowing — sheltering income. Rental losses are passive: they offset passive income freely, and up to $25,000/yr can offset ordinary (W-2) income if you actively participate and your MAGI is under $100k (phasing out to $0 by $150k); unused losses carry forward. On sale, claimed depreciation is recaptured at up to 25%, and gains may owe capital-gains tax (a 1031 exchange can defer both). Figures are a year-1 estimate at your 24.0% rate — not tax advice; consult a CPA.
Condition & rehab AI · 12 photos
This home is in good condition with a good condition score of 80. It has a cosmetic rehab level and requires minimal repairs and maintenance. The highest-ROI updates include painting the exterior siding, replacing carpet in bedrooms, installing smart home devices, and adding outdoor lighting. The home is move-in ready and has a large floor plan with multiple bedrooms and bathrooms.
Value-add opportunities
- Resale Paint exterior siding — Fresh paint can enhance curb appeal and home value.
- Both Replace carpet in bedrooms — Carpet can be outdated and replacing it can improve both resale and rental value.
- Both Install smart home devices — Smart home devices can increase convenience and appeal to potential buyers/renters.
- Both Add outdoor lighting — Outdoor lighting can enhance safety and curb appeal, making the home more attractive to potential buyers/renters.
Renovation cost estimate screening
Value-add ROI direction
- Resale Paint exterior siding — Fresh paint can enhance curb appeal and home value. ↑
- Both Replace carpet in bedrooms — Carpet can be outdated and replacing it can improve both resale and rental value. ↑
- Both Install smart home devices — Smart home devices can increase convenience and appeal to potential buyers/renters. ↑
- Both Add outdoor lighting — Outdoor lighting can enhance safety and curb appeal, making the home more attractive to potential buyers/renters. ↑
ⓘ Cost ranges are severity-bucket heuristics (US national rule-of-thumb). Get contractor quotes + a written scope before underwriting a rehab budget.
Schools (NCES district)
- District
- Willis ISD
- NCES district ID
- 4845900
- Math proficiency
- 33% ▼ -15.00%
- Reading proficiency
- 40% ▼ -2.00%
- Median HH income
- $57,828
- Composite
- 32.32/100
- National rank
- #5746
- State rank
- #458 of 826 in TX
Livability — Willis
- Score
- 62/100
- State rank
- #933
- US rank
- #16579
Category grades
Schools grade is shown separately in the Schools card above.
Census & demographics
- Census place
- Willis, TX
- County
- Montgomery County · 663,713 people
- City population
- 38,421
- Metro
- Houston-The Woodlands-Sugar Land, TX
- Population (ZIP)
- 20,792
- Household income
- $92,415
- Rent vs Own
- Severe rent burden
- 279.0
Population outlook (Montgomery County) Hauer SSP2
- Today (2025)
- 713,896 people
- By 2030
- 805,263 · +12.8%
- By 2040
- 992,708 · +39.1%
- By 2050
- 1,179,590 · +65.2%
- By 2075
- 1,628,084 · +128.1%
- By 2100
- 1,937,880 · +171.5%
Race, ethnicity, and origin ACS 2023
- Neighborhood character
- Predominantly White (72%)
- Race & ethnicity
- White 72% Hispanic / Latino 17% Two or more races 14% Black 3%
- Hispanic origin (detail)
- Mexican 12%
- Common ancestry
- Lithuanian 4% Slovak 2% Serbian 2%
- Foreign-born
- 6% · Canada, Jamaica
- Languages at home
- 88% English-only · Spanish 10%
Political lean MEDSL · Montgomery
- 2024 margin
- Solid R (+45.5) · D 26.8% · R 72.3%
- 2008→2024 swing
- +7.2pp toward D · 2008: -52.7pp · 2024: -45.5pp
- All cycles
- 2024: R+45.5 2020: R+43.8 2016: R+51.4 2012: R+60.7 2008: R+52.7
Not yet ingested
- Civics
- —
Market trends
- HPI YoY
- ▼ -114.58%
- Current HPI
- 236.256
- Rent YoY
- ▼ -2.09%
- Metro
- Houston-The Woodlands-Sugar Land, TX
- State GDP YoY
- ▲ 3.95%
- F500 in state
- 110
Industry mix (Fortune 500 HQ in TX)
| Industry | F500 HQs | Revenue |
|---|---|---|
| Energy | 16 | $1,198B |
|
||
| Technology | 5 | $198B |
|
||
| Engineering / Construction | 4 | $72B |
|
||
| Energy Services | 3 | $60B |
|
||
| Utilities | 3 | $41B |
|
||
| Healthcare | 2 | $330B |
|
||
Cash-flow waterfall
monthlySold comps — $/sqft
last 12 mo · ≤1 miLoading sold comps…