 🏗️ New Construction
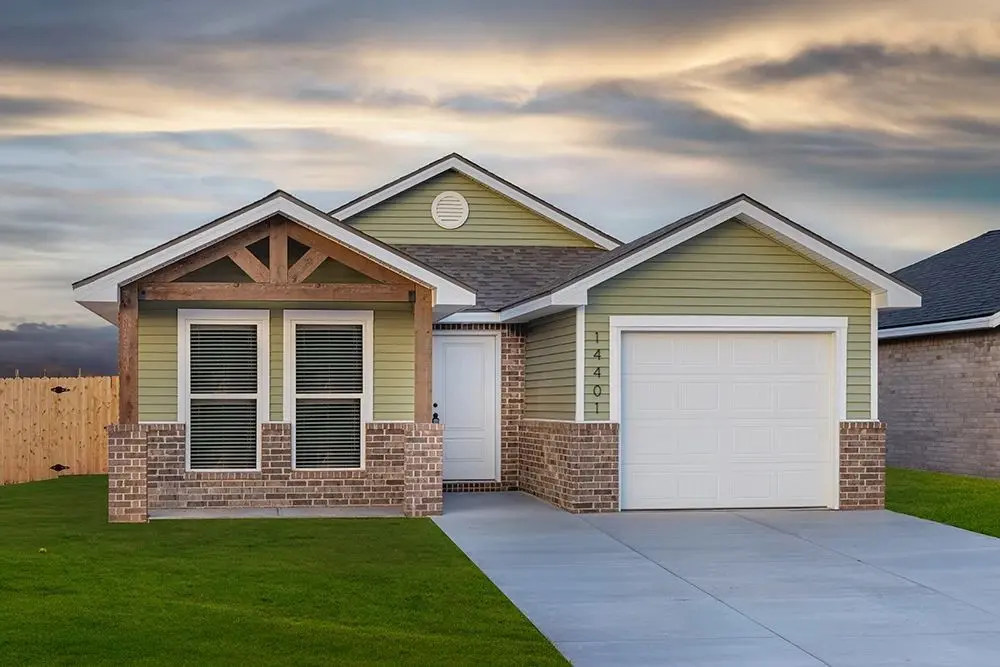
Aspen Plan · Odessa, TX
Flood risk 6/10 · Moderate
- FEMA flood zone
- X (shaded)
- Chance of flooding over 30 yrs
- 0.73%
- Est. flood insurance / yr
- $507 – $1,088
Fire risk 6/10 · Moderate
- Est. fire insurance / yr
- $1,222 – $2,270
Heat risk 6/10 · Moderate
- Hot days now (above 101°F)
- 7 days/yr
- Hot days in 30 yrs
- 22 days/yr
Wind risk 2/10 · Minimal
- Chance of severe wind over 30 yrs
- 3.0%
Air-quality risk 1/10 · Minimal
- Unhealthy air days now
- 0 days/yr
- Unhealthy air days in 30 yrs
- 0 days/yr
Risk factors via First Street. Map © Google.
Why this score? — see what drove the C+ grade
The composite is a weighted blend of 9 inputs, each scored 0–100. Each bar is that input's sub-score; the figure is the points it added to the 100-point composite (weight × sub-score).
- Cash flow +25.2/30.0
- DSCR +8.2/10.0
- ARV discount +7.5/15.0
- 1% rule +6.6/10.0
- Condition / age +4.0/5.0
- Livability +3.8/5.0
- Rent growth +2.6/5.0
- Schools +2.2/10.0
- Appreciation +0.0/10.0
$194,950
🖨 Deal sheet 📄 Offer letter ✓ Due diligence
Listing remarks MLS
The 1,100 square-foot Aspen floor plan is a smart, efficient layout with open living spaces that just make sense. Brick and vinyl exterior with covered entryLuxury vinyl plank flooring in main areasOpen-concept kitchen, living, and dining areaKitchen islandGranite or quartz countertopsStainless steel appliancesPrivate primary suite with walk-in closet
Key facts
- Open living spaces
- Covered entry
- Kitchen island
Tags
Neighborhood map
What this means for you Summary
Snapshot
- This is a 3-bed/2.0-bath single-family listed at $195k. Condition is rated good.
Deal economics
- At list price, monthly cash flow is $434 ($5k/yr) — positive.
- The deal already cash-flows at list — no discount required.
- Meets the 1% rule at list price ($2k rent vs $195k).
- Recommended offer: $183k (6.0% below list) — sets the bar for market timing.
Location & tenants
- Location reads 75/100 on livability (#132 in TX, #3,928 nationally) — a middle-class / working-renter tenant base. Strengths: cost of living A+, housing A+, health & safety A+; Watch: commute D+, amenities D, schools F.
- Ector County ISD (urban): math 22% / reading 27% proficiency, ranked #707 of 826 in TX (top 86%) — low school quality limits family demand, transient renter base, plan for 1-2y turnover.
- Market conditions: Rents flat; 431 active listings in the ZIP; 9 comparable units currently listed for rent nearby; rentals at typical pace (median 21d on market — plan ~3-4 weeks tenant-placement turnaround); 44% of comp listings sitting > 30 days — soft ceiling on asking rent; solid renter incomes; 1,004 units permitted in Ector County in 2024 (0 in 5+ unit buildings).
Forward outlook
- Local home prices are declining (-3.0%/yr); year-one equity from $1k of loan paydown is wiped out by about $6k of value loss. Plan a longer hold.
- Ector County population projected at +78% by 2050 — long-run rental-demand tailwind backs the buy-and-hold thesis.
Negotiation context
- It's been on market 65 days — a 6% lower offer ($183k) is reasonable based on typical stale-listing flexibility.
Risks & watch-outs
- Climate carrying-cost: major flood risk; major wildfire risk; extreme-heat days projected 7→22/yr by 2055 (HVAC capex compounding) — expect insurance premiums to compound above CPI over the hold.
Questions for the listing agent
- It's been on market 65 days. Have you received any prior offers? Is the seller open to a 6% concession, seller financing, or rate buy-down credit?
- Why hasn't it sold? Are there any deal-killer items the seller is aware of (foundation, flood, title, zoning, code violations)?
- Is there a deadline driving the sale (1031 exchange, divorce, estate, relocation)? That informs how much negotiation room exists.
- Schools are F-rated, which usually means shorter tenancies and higher turnover. Who's the typical renter profile here, and what's been the actual vacancy rate?
- What's the average days-on-market for RENTAL listings here right now (not sales)? A rising rental-DOM trend means longer vacancies and softer asking-rent achievability than the comps imply.
- What's the recent tenant-quality profile in this submarket — average credit score on applications, eviction rate, late-payment / NSF rate, and stable-employment percentage? A property-management company in the area should have these aggregated.
- How much new for-sale + rental construction is in the pipeline within 1–3 miles? Heavy new supply typically softens prices + rents 12–24 months out; constrained supply supports both.
Investment metrics
- 1% rule
- 1.16% ✓
- Cap rate
- 8.96%
- Cash-on-cash
- 9.53%
- DSCR
- 1.42
- GRM
- 7.2
CMA / ARV
No comps found within radius.
Projected returns pro-forma
-3.0% appreciation · 0.54% rent growth · sell at horizon
- IRR
- -4.7%
- Equity multiple
- 0.83×
- Total profit
- $-9,378
- Equity at exit
- $29,068
- IRR
- 1.8%
- Equity multiple
- 1.11×
- Total profit
- $6,268
- Equity at exit
- $16,856
Cash invested: $54,586 (down + closing). Projections, not guarantees.
Landlord ↔ Tenant lean methodology
- Overall (STATE)
- 87 Strongly Landlord-Friendly
- State Texas
- 87 Strongly Landlord-Friendly · R+5
- County
- — inherits STATE
- City
- — inherits STATE
ZIP-level market 79765
- Home prices YoY
- -28.7%
- Rents YoY
- 0.5%
- Active inventory
- 431
- Price-to-rent
- 7.2×
Monthly cashflow live
- Estimated rent
- $2,254 high interval (Pro) →
- Mortgage (P&I)
- −$1,022
- Tax est. 1.5%
- −$244 /mo · $2,924/yr
- Insurance
- −$81
- HOA
- −$0
- Vacancy / Maint / Mgmt
- −$473
- Net cashflow
- $434
Break-even live
UW: 25.0% down · 7.5% · 30yr · 1.5% tax · 5.0% vac · 8.0% maint · 8.0% mgmt
Financing live
Cash to close
- Down payment
- $48,738
- Closing costs
- $5,848
- Reserves months
- —
- Total cash needed
- —
Loan-product check · same deal, 3 products live
Conventional
25% down · 7.5% · 30yr
- Down + closing
- —
- Monthly P&I
- —
- Monthly cashflow
- —
- DSCR
- —
- Eligible?
- —
Personal DTI + credit; lowest rate.
DSCR
20% down · 8.5% · 30yr
- Down + closing
- —
- Monthly P&I
- —
- Monthly cashflow
- —
- DSCR
- —
- Eligible?
- —
No personal income docs; deal must DSCR.
Hard money
10% down · 12.0% · 12mo
- Down + closing
- —
- Monthly P&I
- —
- Monthly cashflow
- —
- DSCR
- —
- Eligible?
- —
Short-term bridge; refi at stabilization.
Rent comps 9 comps
| Address | Beds | Baths | Sqft | Rent | $/sqft | DOM | Units | Dist |
|---|---|---|---|---|---|---|---|---|
| 10306 Sheriff St Odessa, TX | 3.0 | 2.0 | 1240 | $2,050 | $1.65 | 13d | 1 | 0.20mi |
| 10310 Creek St Odessa, TX | 3.0 | 2.0 | 1238 | $2,300 | $1.86 | 13d | 1 | 0.25mi |
| 401 Farmstead Ln Odessa, TX | 3.0 | 2.0 | 1390 | $2,500 | $1.80 | 43d | 1 | 0.32mi |
| 310 E 95th St Odessa, TX | 3.0 | 2.0 | 1390 | $2,300 | $1.65 | 20d | 1 | 0.54mi |
| 808 E 96th St Odessa, TX | 3.0 | 2.0 | 1474 | $2,350 | $1.59 | 43d | 1 | 0.80mi |
| 9100 Andrews Hwy Odessa, TX | 1.0–2.0 | 1.0–1.5 | 645 | $1,259 | $1.95 | 13d | 5 | 0.89mi |
| 1306 E 94th St Odessa, TX | 3.0 | 2.0 | 1488 | $2,350 | $1.58 | 20d | 1 | 1.12mi |
| 1303 Terra Cotta St Odessa, TX | 3.0 | 2.0 | 1377 | $1,999 | $1.45 | 43d | 1 | 1.16mi |
| 1025 Pine Leaf Pl Odessa, TX | 3.0 | 2.0 | 1411 | $2,200 | $1.56 | 43d | 1 | 1.30mi |
Listing history 17 events
-
2026-06-19days on market $194,950 Active 65 DOM
-
2026-06-18days on market $194,950 Active 64 DOM
-
2026-06-17days on market $194,950 Active 63 DOM
-
2026-06-16days on market $194,950 Active 62 DOM
-
2026-06-15days on market $194,950 Active 61 DOM
-
2026-06-14days on market $194,950 Active 59 DOM
-
2026-06-13days on market $194,950 Active 58 DOM
-
2026-06-10days on market $194,950 Active 56 DOM
-
2026-06-09days on market $194,950 Active 55 DOM
-
2026-06-08days on market $194,950 Active 54 DOM
-
2026-06-07days on market $194,950 Active 53 DOM
-
2026-06-03days on market $194,950 Active 48 DOM
-
2026-06-01days on market $194,950 Active 47 DOM
-
2026-05-31days on market $194,950 Active 46 DOM
-
2026-05-30days on market $194,950 Active 45 DOM
-
2026-05-13price $194,950 353-char remark
Show marketing remark (353 chars)
The 1,100 square-foot Aspen floor plan is a smart, efficient layout with open living spaces that just make sense. Brick and vinyl exterior with covered entryLuxury vinyl plank flooring in main areasOpen-concept kitchen, living, and dining areaKitchen islandGranite or quartz countertopsStainless steel appliancesPrivate primary suite with walk-in closet
-
2026-04-15$188,950 Active 353-char remark
Show marketing remark (353 chars)
The 1,100 square-foot Aspen floor plan is a smart, efficient layout with open living spaces that just make sense. Brick and vinyl exterior with covered entryLuxury vinyl plank flooring in main areasOpen-concept kitchen, living, and dining areaKitchen islandGranite or quartz countertopsStainless steel appliancesPrivate primary suite with walk-in closet
ⓘ Source: listings_history table (triggers on properties + properties_extension) + one-shot
backfill from property_details.listing_events for pre-trigger history.
Climate risk First Street
- Flood 6/10 Major FEMA zone X (shaded) · 73% chance over 30 yrs
- Wildfire 6/10 Major
- Heat 6/10 Major 7 d/yr ≥101°F today · 22 d/yr by 30 yrs out
- Wind 2/10 Low 3% chance of damaging wind over 30 yrs
- Air quality 1/10 Low 0 unhealthy d/yr today · 0 by 30 yrs out
Nearby sold comps map
Loading sold comps map…
Walkable amenities ~0.75 mi
Loading nearby amenities…
Taxation est. · year 1
- Rental income
- $27,053
- − Mortgage interest
- −$10,920
- − Property taxes
- −$2,924
- − Insurance
- −$975
- − Repairs & maintenance
- −$2,164
- − Management
- −$2,164
- − Depreciation
- −$5,671
- Taxable income
- $2,234
- Est. tax owed @ 24.0%
- −$536
- After-tax cash flow
- $4,669/yr
For passive investors: Depreciation is non-cash, so a rental often shows a tax loss while cash-flowing — sheltering income. Rental losses are passive: they offset passive income freely, and up to $25,000/yr can offset ordinary (W-2) income if you actively participate and your MAGI is under $100k (phasing out to $0 by $150k); unused losses carry forward. On sale, claimed depreciation is recaptured at up to 25%, and gains may owe capital-gains tax (a 1031 exchange can defer both). Figures are a year-1 estimate at your 24.0% rate — not tax advice; consult a CPA.
Condition & rehab AI · 12 photos
This well-maintained single-family home with an open floor plan and modern finishes is ready for immediate occupancy. It offers a good return on investment with minimal updates needed.
Value-add opportunities
- Both Painting exterior and interior walls — Fresh paint enhances curb appeal and interior aesthetics.
- Both Landscaping improvements — Enhances curb appeal and adds value to the property.
- Both Add smart home features — Improves convenience and adds modern appeal, attracting more buyers/renters.
- Both Install smart thermostat — Saves energy and adds modern appeal, attracting more buyers/renters.
Renovation cost estimate screening
Value-add ROI direction
- Both Painting exterior and interior walls — Fresh paint enhances curb appeal and interior aesthetics. ↑
- Both Landscaping improvements — Enhances curb appeal and adds value to the property. ↑
- Both Add smart home features — Improves convenience and adds modern appeal, attracting more buyers/renters. ↑
- Both Install smart thermostat — Saves energy and adds modern appeal, attracting more buyers/renters. ↑
ⓘ Cost ranges are severity-bucket heuristics (US national rule-of-thumb). Get contractor quotes + a written scope before underwriting a rehab budget.
Schools (NCES district)
- District
- Ector County ISD
- NCES district ID
- 4818000
- Math proficiency
- 22% ▼ -9.00%
- Reading proficiency
- 27% ▼ -4.00%
- Median HH income
- $52,740
- Composite
- 21.89/100
- National rank
- #8233
- State rank
- #707 of 826 in TX
Livability — Odessa
- Score
- 75/100
- State rank
- #132
- US rank
- #3928
Category grades
Schools grade is shown separately in the Schools card above.
Census & demographics
- Census place
- Odessa, TX
- County
- Ector County · 131,169 people
- City population
- 131,169
- Metro
- Odessa, TX
- Population (ZIP)
- 25,904
- Household income
- $104,965
- Rent vs Own
- Severe rent burden
- 884.0
Population outlook (Ector County) Hauer SSP2
- Today (2025)
- 212,765 people
- By 2030
- 241,962 · +13.7%
- By 2040
- 306,582 · +44.1%
- By 2050
- 379,755 · +78.5%
- By 2075
- 568,991 · +167.4%
- By 2100
- 709,829 · +233.6%
Race, ethnicity, and origin ACS 2023
- Neighborhood character
- Diverse neighborhood (Simpson 0.59)
- Race & ethnicity
- Hispanic / Latino 49% White 41% Two or more races 15% Black 5% Asian 3% Native American 1%
- Hispanic origin (detail)
- Mexican 45%
- Common ancestry
- Romanian 1% Slovak 1% Lithuanian 1%
- Foreign-born
- 10% · Canada, China, South Korea
- Languages at home
- 63% English-only · Spanish 31% German/W. Germanic 1% Tagalog/Filipino 1%
Political lean MEDSL · Ector
- 2024 margin
- Solid R (+52.9) · D 23.2% · R 76.1%
- 2008→2024 swing
- -4.9pp toward R · 2008: -48.0pp · 2024: -52.9pp
- All cycles
- 2024: R+52.9 2020: R+47.8 2016: R+40.6 2012: R+48.9 2008: R+48.0
Not yet ingested
- Civics
- —
Market trends
- HPI YoY
- ▼ -69.68%
- Current HPI
- 173.4252
- Rent YoY
- ▲ 0.54%
- Metro
- Odessa, TX
- State GDP YoY
- ▲ 3.95%
- F500 in state
- 110
Industry mix (Fortune 500 HQ in TX)
| Industry | F500 HQs | Revenue |
|---|---|---|
| Energy | 16 | $1,198B |
|
||
| Technology | 5 | $198B |
|
||
| Engineering / Construction | 4 | $72B |
|
||
| Energy Services | 3 | $60B |
|
||
| Utilities | 3 | $41B |
|
||
| Healthcare | 2 | $330B |
|
||
Price history
+3.2% since first listed2 events — show timeline
- 2026-05-13 Price Changed $194,950 Zillow
- 2026-04-15 Listed $188,950 Zillow
Cash-flow waterfall
monthlySold comps — $/sqft
last 12 mo · ≤1 miLoading sold comps…