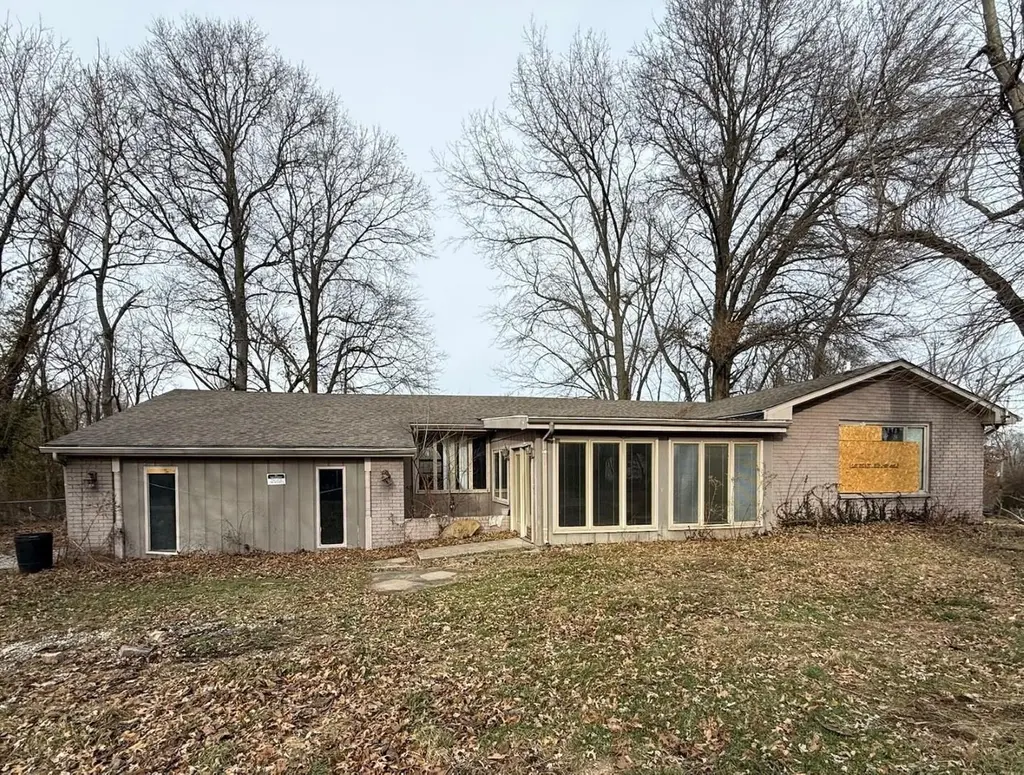
11035 Avery Rd · West Frankfort, IL
Flood risk 1/10 · Minimal
- FEMA flood zone
- X (unshaded)
- Chance of flooding over 30 yrs
- 0.0%
- Est. flood insurance / yr
- $473 – $860
Fire risk 1/10 · Minimal
- Est. fire insurance / yr
- $804 – $1,492
Heat risk 4/10 · Minor
- Hot days now (above 107°F)
- 7 days/yr
- Hot days in 30 yrs
- 18 days/yr
Wind risk 2/10 · Minimal
- Chance of severe wind over 30 yrs
- 3.0%
Air-quality risk 2/10 · Minimal
- Unhealthy air days now
- 0 days/yr
- Unhealthy air days in 30 yrs
- 1 days/yr
Risk factors via First Street. Map © Google.
Why this score? — see what drove the C- grade
The composite is a weighted blend of 9 inputs, each scored 0–100. Each bar is that input's sub-score; the figure is the points it added to the 100-point composite (weight × sub-score).
- Cash flow +21.3/30.0
- ARV discount +7.5/15.0
- 1% rule +6.9/10.0
- DSCR +6.8/10.0
- Livability +2.8/5.0
- Rent growth +2.5/5.0
- Condition / age +2.5/5.0
- Schools +0.9/10.0
- Appreciation +0.0/10.0
$109,700
🖨 Deal sheet (PDF) 📄 Offer letter ✓ Due diligence
Listing remarks MLS
Opportunity knocks! This distressed 3 bedroom home on the outskirts of West Frankfort is priced to sell and ready for a smart buyer or rehabber to unlock the significant value possible. Structure includes 3 bedrooms/3 baths in a traditional layout with good bones. No heat, no lights. Sold "AS IS, WHERE IS". Interior needs a full overhaul. Electrical system requires a complete rewire. HVAC is missing so a new system is needed. There is damage in one bedroom with open ceiling to attic but doesn't appear to be leaking. Comparable home is good, move-in condition in this area are valued between $150,000 and $200,000 once fully rehabbed, creating a strong upside for return on investment when repaired and brought back to market standards.
Key facts
- 1.2 acre lot
- Listed 169 days
Neighborhood map
What this means for you Summary
Snapshot
- This is a 3-bed/2.0-bath single-family listed at $110k.
Deal economics
- At list price, monthly cash flow is $160 ($2k/yr) — positive.
- The deal already cash-flows at list — no discount required.
- Meets the 1% rule at list price ($1k rent vs $110k).
- Recommended offer: $97k (12.0% below list) — sets the bar for market timing.
- Cap rate 8.0% vs local median 5.8% in West Frankfort — top-decile yield for the area; either an underpriced asset or a hidden risk that comps aren't pricing in. Stress-test before assuming the spread holds.
Location & tenants
- Location reads 56/100 on livability (#1,210 in IL) — a working-class tenant base; expect higher turnover. Strengths: cost of living A+, housing A+; Watch: crime D, schools F, amenities F.
- Frankfort CUSD 168 (town): math 6% / reading 16% proficiency, ranked #577 of 620 in IL (top 93%) — low school quality limits family demand, transient renter base, plan for 1-2y turnover.
- Market conditions: 90 active listings in the ZIP; 17 units permitted in Franklin County in 2024 (0 in 5+ unit buildings).
Forward outlook
- Local home prices are declining (-3.0%/yr); year-one equity from $758 of loan paydown is wiped out by about $3k of value loss. Plan a longer hold.
- Franklin County population projected at -16% by 2050 — secular population decline; favor cash flow + early exit over multi-decade hold.
Negotiation context
- It's been on market 170 days — a 12% lower offer ($97k) is reasonable based on typical stale-listing flexibility.
Risks & watch-outs
- Watch-outs: property tax is 2.8% of price.
Questions for the listing agent
- It's been on market 170 days. Have you received any prior offers? Is the seller open to a 12% concession, seller financing, or rate buy-down credit?
- Property tax is high relative to price — has the assessment been appealed recently, and will the sale trigger a re-assessment?
- Why hasn't it sold? Are there any deal-killer items the seller is aware of (foundation, flood, title, zoning, code violations)?
- Is there a deadline driving the sale (1031 exchange, divorce, estate, relocation)? That informs how much negotiation room exists.
- Schools are F-rated, which usually means shorter tenancies and higher turnover. Who's the typical renter profile here, and what's been the actual vacancy rate?
- Crime grade is D in this area — have there been break-ins, vandalism, or insurance claims at this property in the last 3 years? What carrier currently insures it and at what premium?
- What's the average days-on-market for RENTAL listings here right now (not sales)? A rising rental-DOM trend means longer vacancies and softer asking-rent achievability than the comps imply.
- What's the recent tenant-quality profile in this submarket — average credit score on applications, eviction rate, late-payment / NSF rate, and stable-employment percentage? A property-management company in the area should have these aggregated.
- How much new for-sale + rental construction is in the pipeline within 1–3 miles? Heavy new supply typically softens prices + rents 12–24 months out; constrained supply supports both.
Investment metrics
- 1% rule
- 1.19% ✓
- Cap rate
- 8.05%
- Cash-on-cash
- 6.27%
- DSCR
- 1.28
- GRM
- 7.0
CMA / ARV
- ARV (median comp)
- $221,095
- List price
- $109,700
- Delta
- -50.38%
- Verdict
- UNDERPRICED
- Comps
- 19 within 1.0 mi
Show comp detail 6 sales within ~0.75 mi
| Address | Dist | Beds/Ba | Sqft | Sold | Price | $/sf | Match |
|---|---|---|---|---|---|---|---|
| 1718 Russell Rd | 0.25mi | 4/2.0 (+1) | 2,148 (-12%) | 3mo | $215,000 | $100 | 61 |
| 1718 Russell Rd | 0.25mi | 4/2.0 (+1) | 2,148 (-12%) | 3mo | $215,000 | $100 | 61 |
| 1881 Russell Rd | 0.39mi | 3/2.0 | 2,079 (-15%) | 13mo | $225,000 | $108 | 47 |
| 1881 Russell Rd | 0.39mi | 3/2.0 | 2,079 (-15%) | 13mo | $225,000 | $108 | 47 |
| 1065 Crystal Rd | 0.72mi | 4/3.0 (+1) | 2,400 (-2%) | 12mo | $215,000 | $90 | 45 |
| 1065 Crystal Rd | 0.71mi | 4/3.0 (+1) | 2,400 (-2%) | 12mo | $215,000 | $90 | 45 |
Match score weights: distance 35% · size 25% · config 20% · recency 20%. Top-matched comps best support the ARV.
Projected returns pro-forma
-3.0% appreciation · 3.0% rent growth · sell at horizon
- IRR
- -6.6%
- Equity multiple
- 0.76×
- Total profit
- $-7,463
- Equity at exit
- $16,357
- IRR
- 3.2%
- Equity multiple
- 1.23×
- Total profit
- $7,032
- Equity at exit
- $9,485
Cash invested: $30,716 (down + closing). Projections, not guarantees.
Landlord ↔ Tenant lean methodology
- Overall (STATE)
- 43 Moderately Tenant-Leaning
- State Illinois
- 43 Moderately Tenant-Leaning · D+7
- County
- — inherits STATE
- City
- — inherits STATE
ZIP-level market 62896
- Active inventory
- 90
- Price-to-rent
- 7.0×
Monthly cashflow live
- Estimated rent
- $1,309 medium interval (Pro) →
- Mortgage (P&I)
- −$575
- Tax from tax record
- −$253 /mo · $3,036/yr
- Insurance
- −$46
- HOA
- −$0
- Vacancy / Maint / Mgmt
- −$275
- Net cashflow
- $160
Break-even live
Sensitivity live
| Price | -10% $223 | -5% $192 | +0% $160 | +5% $129 | +10% $98 |
|---|---|---|---|---|---|
| Rent | -10% $57 | -5% $109 | +0% $160 | +5% $212 | +10% $264 |
| Rate | -1.0pp $216 | -0.5pp $188 | base $160 | +0.5pp $132 | +1.0pp $103 |
UW: 25.0% down · 7.5% · 30yr · 1.5% tax · 5.0% vac · 8.0% maint · 8.0% mgmt
Financing live
Cash to close
- Down payment
- $27,425
- Closing costs
- $3,291
- Reserves months
- —
- Total cash needed
- —
Loan-product check · same deal, 3 products live
Conventional
25% down · 7.5% · 30yr
- Down + closing
- —
- Monthly P&I
- —
- Monthly cashflow
- —
- DSCR
- —
- Eligible?
- —
Personal DTI + credit; lowest rate.
DSCR
20% down · 8.5% · 30yr
- Down + closing
- —
- Monthly P&I
- —
- Monthly cashflow
- —
- DSCR
- —
- Eligible?
- —
No personal income docs; deal must DSCR.
Hard money
10% down · 12.0% · 12mo
- Down + closing
- —
- Monthly P&I
- —
- Monthly cashflow
- —
- DSCR
- —
- Eligible?
- —
Short-term bridge; refi at stabilization.
Listing history 20 events
-
2026-06-18days on market $109,700 Active 170 DOM
-
2026-06-17days on market $109,700 Active 169 DOM
-
2026-06-17price $109,700 Active 168 DOM
-
2026-06-16days on market $114,000 Active 168 DOM
-
2026-06-15days on market $114,000 Active 167 DOM
-
2026-06-13days on market $114,000 Active 165 DOM
-
2026-06-12days on market $114,000 Active 164 DOM
-
2026-06-09days on market $114,000 Active 161 DOM
-
2026-06-08days on market $114,000 Active 160 DOM
-
2026-06-07days on market $114,000 Active 159 DOM
-
2026-06-04days on market $114,000 Active 155 DOM
-
2026-06-02days on market $114,000 Active 154 DOM
-
2026-06-01days on market $114,000 Active 153 DOM
-
2026-05-31days on market $114,000 Active 152 DOM
-
2026-05-31days on market $114,000 Active 151 DOM
-
2026-04-27price $114,000 760-char remark
Show marketing remark (760 chars)
Opportunity knocks! This distressed 3 bedroom home on the outskirts of West Frankfort is priced to sell and ready for a smart buyer or rehabber to unlock the significant value possible. Structure includes 3 bedrooms/3 baths in a traditional layout with good bones. No heat, no lights. Sold "AS IS, WHERE IS". Interior needs a full overhaul. Electrical system requires a complete rewire. HVAC is missing so a new system is needed. There is damage in one bedroom with open ceiling to attic but doesn't appear to be leaking. Comparable home is good, move-in condition in this area are valued between $150,000 and $200,000 once fully rehabbed, creating a strong upside for return on investment when repaired and brought back to market standards.
-
2026-02-13price $124,700 760-char remark
Show marketing remark (760 chars)
Opportunity knocks! This distressed 3 bedroom home on the outskirts of West Frankfort is priced to sell and ready for a smart buyer or rehabber to unlock the significant value possible. Structure includes 3 bedrooms/3 baths in a traditional layout with good bones. No heat, no lights. Sold "AS IS, WHERE IS". Interior needs a full overhaul. Electrical system requires a complete rewire. HVAC is missing so a new system is needed. There is damage in one bedroom with open ceiling to attic but doesn't appear to be leaking. Comparable home is good, move-in condition in this area are valued between $150,000 and $200,000 once fully rehabbed, creating a strong upside for return on investment when repaired and brought back to market standards.
-
2025-12-30$129,700 Active 760-char remark
Show marketing remark (760 chars)
Opportunity knocks! This distressed 3 bedroom home on the outskirts of West Frankfort is priced to sell and ready for a smart buyer or rehabber to unlock the significant value possible. Structure includes 3 bedrooms/3 baths in a traditional layout with good bones. No heat, no lights. Sold "AS IS, WHERE IS". Interior needs a full overhaul. Electrical system requires a complete rewire. HVAC is missing so a new system is needed. There is damage in one bedroom with open ceiling to attic but doesn't appear to be leaking. Comparable home is good, move-in condition in this area are valued between $150,000 and $200,000 once fully rehabbed, creating a strong upside for return on investment when repaired and brought back to market standards.
-
2021-08-06historical
-
2005-01-17historical
ⓘ Source: listings_history table (triggers on properties + properties_extension) + one-shot
backfill from property_details.listing_events for pre-trigger history.
Tax reassessment forecast IL · Partial reset (capped growth)
- Current annual tax
- $3,036 · $253/mo
- Projected year-2 tax
- $3,036 · $253/mo
- Expected delta
- $0/yr ($0/mo · 0.0%)
ⓘ Screening estimate from a state-policy table — verify with the county assessor before closing.
Climate risk First Street
- Flood 1/10 Low FEMA zone X (unshaded) · 0% chance over 30 yrs
- Wildfire 1/10 Low
- Heat 4/10 Moderate 7 d/yr ≥107°F today · 18 d/yr by 30 yrs out
- Wind 2/10 Low 3% chance of damaging wind over 30 yrs
- Air quality 2/10 Low 0 unhealthy d/yr today · 1 by 30 yrs out
Nearby sold comps map
Loading sold comps map…
Walkable amenities ~0.75 mi
Loading nearby amenities…
Taxation est. · year 1
- Rental income
- $15,713
- − Mortgage interest
- −$6,145
- − Property taxes
- −$3,036
- − Insurance
- −$548
- − Repairs & maintenance
- −$1,257
- − Management
- −$1,257
- − Depreciation
- −$3,191
- Taxable income
- $279
- Est. tax owed @ 24.0%
- −$67
- After-tax cash flow
- $1,859/yr
For passive investors: Depreciation is non-cash, so a rental often shows a tax loss while cash-flowing — sheltering income. Rental losses are passive: they offset passive income freely, and up to $25,000/yr can offset ordinary (W-2) income if you actively participate and your MAGI is under $100k (phasing out to $0 by $150k); unused losses carry forward. On sale, claimed depreciation is recaptured at up to 25%, and gains may owe capital-gains tax (a 1031 exchange can defer both). Figures are a year-1 estimate at your 24.0% rate — not tax advice; consult a CPA.
Schools (NCES district)
- District
- Frankfort CUSD 168
- NCES district ID
- 1741580
- Math proficiency
- 6% ▼ -9.00%
- Reading proficiency
- 16% ▼ -10.00%
- Median HH income
- $34,447
- Composite
- 8.93/100
- National rank
- #9886
- State rank
- #577 of 620 in IL
Livability — West Frankfort
- Score
- 56/100
- State rank
- #1210
- US rank
- #22742
Category grades
Schools grade is shown separately in the Schools card above.
Census & demographics
- City population
- 10,691
- Population (ZIP)
- 10,691
Population outlook (Franklin County) Hauer SSP2
- Today (2025)
- 37,954 people
- By 2030
- 36,828 · -3.0%
- By 2040
- 34,452 · -9.2%
- By 2050
- 31,855 · -16.1%
- By 2075
- 25,171 · -33.7%
- By 2100
- 18,462 · -51.4%
Race, ethnicity, and origin ACS 2023
- Neighborhood character
- Predominantly White (96%)
- Race & ethnicity
- White 96% Two or more races 2%
- Common ancestry
- Romanian 2% Lithuanian 1% Iranian 1%
- Foreign-born
- 1% · Canada, Jamaica
- Languages at home
- 98% English-only · Spanish 1%
Political lean MEDSL · Franklin
- 2024 margin
- Solid R (+50.6) · D 24.1% · R 74.6% · Other 1.3%
- 2008→2024 swing
- -47.8pp toward R · 2008: -2.8pp · 2024: -50.6pp
- All cycles
- 2024: R+50.6 2020: R+47.5 2016: R+45.3 2012: R+16.8 2008: R+2.8
Not yet ingested
- Civics
- —
Market trends
- HPI YoY
- ▼ -94.00%
- Current HPI
- 86.36
- Rent YoY
- —
- Metro
- —
- State GDP YoY
- ▲ 1.59%
- F500 in state
- 60
Industry mix (Fortune 500 HQ in IL)
| Industry | F500 HQs | Revenue |
|---|---|---|
| Insurance | 4 | $201B |
|
||
| Consumer Goods | 4 | $87B |
|
||
| Industrial Machinery | 3 | $64B |
|
||
| Healthcare | 2 | $55B |
|
||
| Retail / Pharmacy | 1 | $148B |
|
||
| Agriculture / Food | 1 | $86B |
|
||
Price history
-12.1% since first listed5 events — show timeline
- 2026-04-27 Price Changed $114,000 MRED as Distributed by MLS Grid
- 2026-02-13 Price Changed $124,700 MRED as Distributed by MLS Grid
- 2025-12-30 Listed $129,700 MRED as Distributed by MLS Grid
- 2021-08-06 Listing Removed — RMLSA as Distributed by MLS Grid
- 2005-01-17 Listing Removed — MRED as Distributed by MLS Grid
Property tax history
+4.4%/yrLatest (2024): $3,036 · +9.3% YoY. Source: county tax records.
Cash-flow waterfall
monthlySold comps — $/sqft
last 12 mo · ≤1 miLoading sold comps…