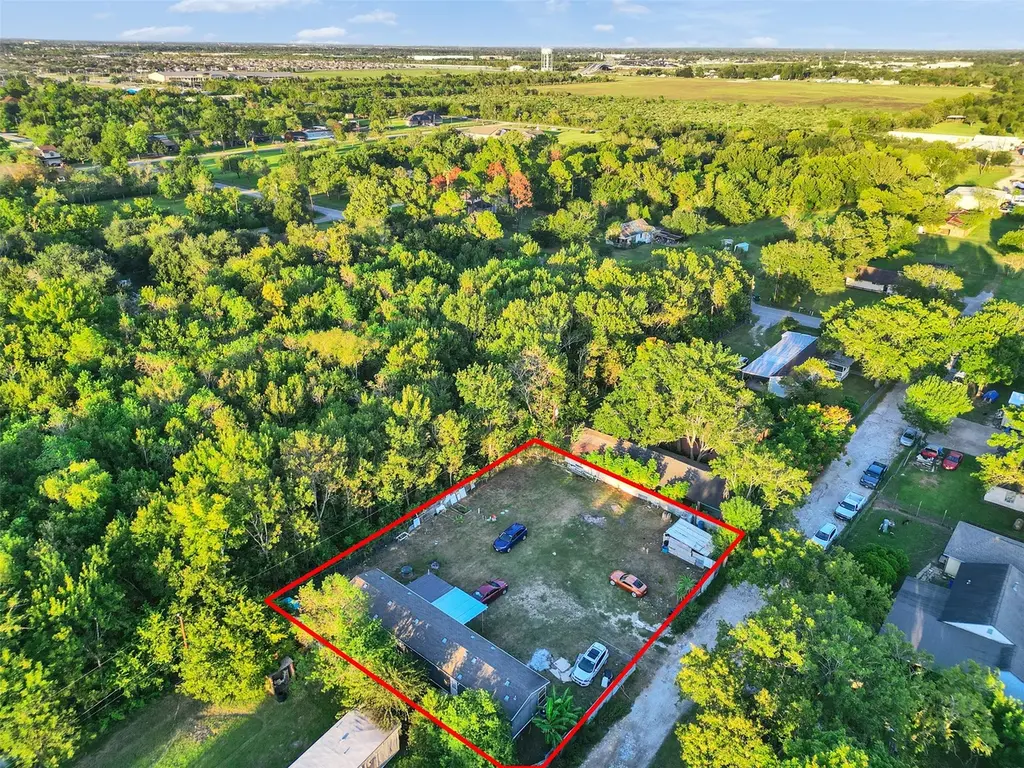
7225 7225 Libby Ln · Pearland, TX
Flood risk 1/10 · Minimal
- FEMA flood zone
- X (unshaded)
- Chance of flooding over 30 yrs
- 0.0%
- Est. flood insurance / yr
- $507 – $1,088
Fire risk 3/10 · Minor
- Est. fire insurance / yr
- $1,222 – $2,270
Heat risk 9/10 · Severe
- Hot days now (above 108°F)
- 7 days/yr
- Hot days in 30 yrs
- 23 days/yr
Wind risk 9/10 · Severe
- Chance of severe wind over 30 yrs
- 99.0%
Air-quality risk 2/10 · Minimal
- Unhealthy air days now
- 1 days/yr
- Unhealthy air days in 30 yrs
- 1 days/yr
Risk factors via First Street. Map © Google.
Why this score? — see what drove the B- grade
The composite is a weighted blend of 9 inputs, each scored 0–100. Each bar is that input's sub-score; the figure is the points it added to the 100-point composite (weight × sub-score).
- Cash flow +29.7/30.0
- DSCR +10.0/10.0
- ARV discount +7.5/15.0
- 1% rule +7.2/10.0
- Livability +4.0/5.0
- Schools +3.9/10.0
- Rent growth +2.9/5.0
- Condition / age +2.5/5.0
- Appreciation +0.0/10.0
$175,000
🖨 Deal sheet 📄 Offer letter ✓ Due diligence
Listing remarks MLS
Welcome to 7225 Libby Ln, a fantastic opportunity to own a piece of peaceful Pearland, with room to roam. This attractive property offers a comfortable and practical manufactured home of 1,152 square feet. Lot size ACRES 0.306 (13,329sqft) . The interior layout features 3-4 spacious bedrooms and 2 full bathrooms. The property is a short drive to the Pearland Town Center and quick local access to Highway 35 and proximity to Highway 288 and Beltway 8. Don’t miss out on this fantastic Pearland gem! Schedule your showing today.
Key facts
- 0.31 acre lot
- Built 2017
- Listed 76 days
Neighborhood map
What this means for you Summary
Snapshot
- This is a 3-bed/2.0-bath manufactured listed at $175k.
Deal economics
- At list price, monthly cash flow is $637 ($8k/yr) — positive.
- The deal already cash-flows at list — no discount required.
- Meets the 1% rule at list price ($2k rent vs $175k).
- Recommended offer: $164k (6.0% below list) — sets the bar for market timing.
- Cap rate 10.7% vs local median 3.0% in Pearland — top-decile yield for the area; either an underpriced asset or a hidden risk that comps aren't pricing in. Stress-test before assuming the spread holds.
Location & tenants
- Location reads 81/100 on livability (#32 in TX, #1,539 nationally) — a professional / high-income tenant draw. Strengths: schools A+, employment A+, housing A+; Watch: amenities D-, commute F.
- Alvin ISD (suburban): math 39% / reading 48% proficiency, ranked #255 of 826 in TX (top 31%) — families likely to look elsewhere, expect single-tenant / working-renter base with shorter leases.
- Market conditions: Rents rising (+1.5%/yr); 497 active listings in the ZIP; 1 comparable units currently listed for rent nearby; high-income renter base; 3,960 units permitted in Brazoria County in 2024 (593 in 5+ unit buildings).
Forward outlook
- Local home prices are declining (-3.0%/yr); year-one equity from $1k of loan paydown is wiped out by about $5k of value loss. Plan a longer hold.
- Brazoria County population projected at +44% by 2050 — long-run rental-demand tailwind backs the buy-and-hold thesis.
- At projected returns (-3.0% appreciation + 1.5% rent growth), your $49k cash investment doubles in ~9 years — after that, you're playing with house money.
Negotiation context
- It's been on market 76 days — a 6% lower offer ($164k) is reasonable based on typical stale-listing flexibility.
- 3 sale attempts; this cycle's ask is 10838% above the opening price — seller raised mid-cycle; expect resistance to lowballs.
Risks & watch-outs
- Climate carrying-cost: severe wind risk, 99% chance of damaging wind over 30y; extreme-heat days projected 7→23/yr by 2055 (HVAC capex compounding) — expect insurance premiums to compound above CPI over the hold.
Questions for the listing agent
- It's been on market 76 days. Have you received any prior offers? Is the seller open to a 6% concession, seller financing, or rate buy-down credit?
- Why hasn't it sold? Are there any deal-killer items the seller is aware of (foundation, flood, title, zoning, code violations)?
- Is there a deadline driving the sale (1031 exchange, divorce, estate, relocation)? That informs how much negotiation room exists.
- Schools are A-rated — typically a magnet for longer-tenancy family renters. What's the average tenant stay here, and is there a school-zone premium baked into asking?
- What's the average days-on-market for RENTAL listings here right now (not sales)? A rising rental-DOM trend means longer vacancies and softer asking-rent achievability than the comps imply.
- What's the recent tenant-quality profile in this submarket — average credit score on applications, eviction rate, late-payment / NSF rate, and stable-employment percentage? A property-management company in the area should have these aggregated.
- How much new for-sale + rental construction is in the pipeline within 1–3 miles? Heavy new supply typically softens prices + rents 12–24 months out; constrained supply supports both.
Investment metrics
- 1% rule
- 1.22% ✓
- Cap rate
- 10.66%
- Cash-on-cash
- 15.60%
- DSCR
- 1.69
- GRM
- 6.8
CMA / ARV
No comps found within radius.
Projected returns pro-forma
-3.0% appreciation · 1.47% rent growth · sell at horizon
- IRR
- 4.8%
- Equity multiple
- 1.18×
- Total profit
- $8,893
- Equity at exit
- $26,093
- IRR
- 12.9%
- Equity multiple
- 1.95×
- Total profit
- $46,791
- Equity at exit
- $15,131
Cash invested: $49,000 (down + closing). Projections, not guarantees.
Landlord ↔ Tenant lean methodology
- Overall (STATE)
- 87 Strongly Landlord-Friendly
- State Texas
- 87 Strongly Landlord-Friendly · R+5
- County
- — inherits STATE
- City
- — inherits STATE
ZIP-level market 77584
- Home prices YoY
- -18.7%
- Rents YoY
- 1.5%
- Active inventory
- 497
- Price-to-rent
- 6.8×
Monthly cashflow live
- Estimated rent
- $2,144 medium interval (Pro) →
- Mortgage (P&I)
- −$918
- Tax from tax record
- −$66 /mo · $792/yr
- Insurance
- −$73
- HOA
- −$0
- Vacancy / Maint / Mgmt
- −$450
- Net cashflow
- $637
Break-even live
UW: 25.0% down · 7.5% · 30yr · 1.5% tax · 5.0% vac · 8.0% maint · 8.0% mgmt
Financing live
Cash to close
- Down payment
- $43,750
- Closing costs
- $5,250
- Reserves months
- —
- Total cash needed
- —
Loan-product check · same deal, 3 products live
Conventional
25% down · 7.5% · 30yr
- Down + closing
- —
- Monthly P&I
- —
- Monthly cashflow
- —
- DSCR
- —
- Eligible?
- —
Personal DTI + credit; lowest rate.
DSCR
20% down · 8.5% · 30yr
- Down + closing
- —
- Monthly P&I
- —
- Monthly cashflow
- —
- DSCR
- —
- Eligible?
- —
No personal income docs; deal must DSCR.
Hard money
10% down · 12.0% · 12mo
- Down + closing
- —
- Monthly P&I
- —
- Monthly cashflow
- —
- DSCR
- —
- Eligible?
- —
Short-term bridge; refi at stabilization.
Rent comps 1 comps
| Address | Beds | Baths | Sqft | Rent | $/sqft | DOM | Units | Dist |
|---|---|---|---|---|---|---|---|---|
| 3200 Business Center Dr Pearland, TX | 1.0–2.0 | 1.0–2.0 | 900 | $2,610 | $2.90 | 1d | 56 | 1.36mi |
Listing history 9 events
-
2026-05-31days on market $175,000 Pending 76 DOM
-
2026-04-11$1,600
-
2026-03-28price $175,000 535-char remark
Show marketing remark (535 chars)
Welcome to 7225 Libby Ln, a fantastic opportunity to own a piece of peaceful Pearland, with room to roam. This attractive property offers a comfortable and practical manufactured home of 1,152 square feet. Lot size ACRES 0.306 (13,329sqft) . The interior layout features 3-4 spacious bedrooms and 2 full bathrooms. The property is a short drive to the Pearland Town Center and quick local access to Highway 35 and proximity to Highway 288 and Beltway 8. Don’t miss out on this fantastic Pearland gem! Schedule your showing today.
-
2026-03-16$179,500 Active 535-char remark
Show marketing remark (535 chars)
Welcome to 7225 Libby Ln, a fantastic opportunity to own a piece of peaceful Pearland, with room to roam. This attractive property offers a comfortable and practical manufactured home of 1,152 square feet. Lot size ACRES 0.306 (13,329sqft) . The interior layout features 3-4 spacious bedrooms and 2 full bathrooms. The property is a short drive to the Pearland Town Center and quick local access to Highway 35 and proximity to Highway 288 and Beltway 8. Don’t miss out on this fantastic Pearland gem! Schedule your showing today.
-
2026-03-03price $175,000 546-char remark
Show marketing remark (546 chars)
Welcome to 7225 Libby Ln, a fantastic opportunity to own a piece of peaceful Pearland, with room to roam. This attractive property, built in 2017, offers a comfortable and practical living space of 1,152 square feet. Lot size ACRES 0.306 (13,329sqft) . The interior layout features 3-4 spacious bedrooms and 2 full bathrooms. The property is a short drive to the Pearland Town Center and quick local access to Highway 35 and proximity to Highway 288 and Beltway 8. Don’t miss out on this fantastic Pearland gem! Schedule your showing today.
-
2026-01-02price $179,500 546-char remark
Show marketing remark (546 chars)
Welcome to 7225 Libby Ln, a fantastic opportunity to own a piece of peaceful Pearland, with room to roam. This attractive property, built in 2017, offers a comfortable and practical living space of 1,152 square feet. Lot size ACRES 0.306 (13,329sqft) . The interior layout features 3-4 spacious bedrooms and 2 full bathrooms. The property is a short drive to the Pearland Town Center and quick local access to Highway 35 and proximity to Highway 288 and Beltway 8. Don’t miss out on this fantastic Pearland gem! Schedule your showing today.
-
2025-11-17price $180,000 546-char remark
Show marketing remark (546 chars)
Welcome to 7225 Libby Ln, a fantastic opportunity to own a piece of peaceful Pearland, with room to roam. This attractive property, built in 2017, offers a comfortable and practical living space of 1,152 square feet. Lot size ACRES 0.306 (13,329sqft) . The interior layout features 3-4 spacious bedrooms and 2 full bathrooms. The property is a short drive to the Pearland Town Center and quick local access to Highway 35 and proximity to Highway 288 and Beltway 8. Don’t miss out on this fantastic Pearland gem! Schedule your showing today.
-
2025-11-17price $170,000 546-char remark
Show marketing remark (546 chars)
Welcome to 7225 Libby Ln, a fantastic opportunity to own a piece of peaceful Pearland, with room to roam. This attractive property, built in 2017, offers a comfortable and practical living space of 1,152 square feet. Lot size ACRES 0.306 (13,329sqft) . The interior layout features 3-4 spacious bedrooms and 2 full bathrooms. The property is a short drive to the Pearland Town Center and quick local access to Highway 35 and proximity to Highway 288 and Beltway 8. Don’t miss out on this fantastic Pearland gem! Schedule your showing today.
-
2025-10-13$180,000 Active 546-char remark
Show marketing remark (546 chars)
Welcome to 7225 Libby Ln, a fantastic opportunity to own a piece of peaceful Pearland, with room to roam. This attractive property, built in 2017, offers a comfortable and practical living space of 1,152 square feet. Lot size ACRES 0.306 (13,329sqft) . The interior layout features 3-4 spacious bedrooms and 2 full bathrooms. The property is a short drive to the Pearland Town Center and quick local access to Highway 35 and proximity to Highway 288 and Beltway 8. Don’t miss out on this fantastic Pearland gem! Schedule your showing today.
ⓘ Source: listings_history table (triggers on properties + properties_extension) + one-shot
backfill from property_details.listing_events for pre-trigger history.
Tax reassessment forecast TX · Resets to sale price
- Current annual tax
- $792 · $66/mo
- Projected year-2 tax
- $3,202 · $267/mo
- Expected delta
- +$2,411/yr (+$201/mo · 304.5%)
ⓘ Screening estimate from a state-policy table — verify with the county assessor before closing.
Climate risk First Street
- Flood 1/10 Low FEMA zone X (unshaded) · 0% chance over 30 yrs
- Wildfire 3/10 Moderate
- Heat 9/10 Extreme 7 d/yr ≥108°F today · 23 d/yr by 30 yrs out
- Wind 9/10 Extreme 99% chance of damaging wind over 30 yrs
- Air quality 2/10 Low 1 unhealthy d/yr today · 1 by 30 yrs out
Nearby sold comps map
Loading sold comps map…
Walkable amenities ~0.75 mi
Loading nearby amenities…
Taxation est. · year 1
- Rental income
- $25,724
- − Mortgage interest
- −$9,803
- − Property taxes
- −$792
- − Insurance
- −$875
- − Repairs & maintenance
- −$2,058
- − Management
- −$2,058
- − Depreciation
- −$5,091
- Taxable income
- $5,048
- Est. tax owed @ 24.0%
- −$1,211
- After-tax cash flow
- $6,431/yr
For passive investors: Depreciation is non-cash, so a rental often shows a tax loss while cash-flowing — sheltering income. Rental losses are passive: they offset passive income freely, and up to $25,000/yr can offset ordinary (W-2) income if you actively participate and your MAGI is under $100k (phasing out to $0 by $150k); unused losses carry forward. On sale, claimed depreciation is recaptured at up to 25%, and gains may owe capital-gains tax (a 1031 exchange can defer both). Figures are a year-1 estimate at your 24.0% rate — not tax advice; consult a CPA.
Schools (NCES district)
- District
- Alvin ISD
- NCES district ID
- 4808090
- Math proficiency
- 39% ▼ -11.00%
- Reading proficiency
- 48% ▬ 0.00%
- Median HH income
- $66,740
- Composite
- 38.96/100
- National rank
- #4080
- State rank
- #255 of 826 in TX
Livability — Pearland
- Score
- 81/100
- State rank
- #32
- US rank
- #1539
Category grades
Schools grade is shown separately in the Schools card above.
Census & demographics
- County
- Brazoria County · 374,982 people
- City population
- 142,397
- Metro
- Houston-The Woodlands-Sugar Land, TX
- Population (ZIP)
- 91,065
- Household income
- $121,872
- Rent vs Own
- Severe rent burden
- 1539.0
Population outlook (Brazoria County) Hauer SSP2
- Today (2025)
- 420,414 people
- By 2030
- 457,585 · +8.8%
- By 2040
- 532,232 · +26.6%
- By 2050
- 605,399 · +44.0%
- By 2075
- 779,358 · +85.4%
- By 2100
- 883,759 · +110.2%
Race, ethnicity, and origin ACS 2023
- Neighborhood character
- Highly diverse neighborhood (Simpson 0.76)
- Race & ethnicity
- White 32% Hispanic / Latino 22% Asian 21% Black 21% Two or more races 14%
- Hispanic origin (detail)
- Mexican 16% Puerto Rican 2%
- Common ancestry
- Lithuanian 2% Romanian 1% Slovak 1%
- Foreign-born
- 25% · Canada, China, Vietnam
- Languages at home
- 64% English-only · Spanish 14% Chinese 4% Other Indo-European 4%
Political lean MEDSL · Brazoria
- 2024 margin
- R (+19.7) · D 39.5% · R 59.2% · Other 1.3%
- 2008→2024 swing
- +9.9pp toward D · 2008: -29.6pp · 2024: -19.7pp
- All cycles
- 2024: R+19.7 2020: R+18.2 2016: R+24.6 2012: R+34.2 2008: R+29.6
Not yet ingested
- Civics
- —
Market trends
- HPI YoY
- ▼ -49.09%
- Current HPI
- 213.4011
- Rent YoY
- ▲ 1.47%
- Metro
- Houston-The Woodlands-Sugar Land, TX
- State GDP YoY
- ▲ 3.95%
- F500 in state
- 110
Industry mix (Fortune 500 HQ in TX)
| Industry | F500 HQs | Revenue |
|---|---|---|
| Energy | 16 | $1,198B |
|
||
| Technology | 5 | $198B |
|
||
| Engineering / Construction | 4 | $72B |
|
||
| Energy Services | 3 | $60B |
|
||
| Utilities | 3 | $41B |
|
||
| Healthcare | 2 | $330B |
|
||
Price history
-99.1% since first listed8 events — show timeline
- 2026-04-11 Listed for Rent $1,600 HARMLS
- 2026-03-28 Price Changed $175,000 HARMLS
- 2026-03-16 Listed $179,500 HARMLS
- 2026-03-03 Price Changed $175,000 HARMLS
- 2026-01-02 Price Changed $179,500 HARMLS
- 2025-11-17 Price Changed $180,000 HARMLS
- 2025-11-17 Price Changed $170,000 HARMLS
- 2025-10-13 Listed $180,000 HARMLS
Property tax history
+2.2%/yrLatest (2025): $792 · -2.9% YoY. Source: county tax records.
Cash-flow waterfall
monthlySold comps — $/sqft
last 12 mo · ≤1 miLoading sold comps…