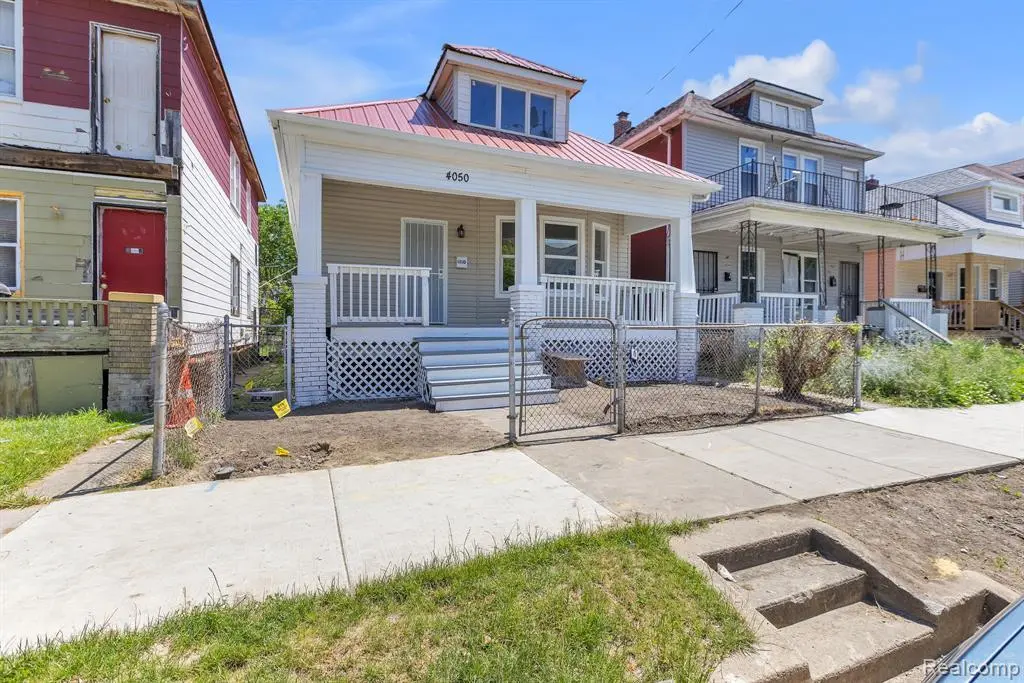
4050 Lillibridge St · Detroit, MI
Flood risk 1/10 · Minimal
- FEMA flood zone
- X (unshaded)
- Chance of flooding over 30 yrs
- 0.0%
- Est. flood insurance / yr
- $473 – $860
Fire risk 1/10 · Minimal
- Est. fire insurance / yr
- $784 – $1,456
Heat risk 3/10 · Minor
- Hot days now (above 96°F)
- 7 days/yr
- Hot days in 30 yrs
- 15 days/yr
Wind risk 2/10 · Minimal
- Chance of severe wind over 30 yrs
- —
Air-quality risk 3/10 · Minor
- Unhealthy air days now
- 2 days/yr
- Unhealthy air days in 30 yrs
- 5 days/yr
Risk factors via First Street. Map © Google.
Why this score? — see what drove the B- grade
The composite is a weighted blend of 9 inputs, each scored 0–100. Each bar is that input's sub-score; the figure is the points it added to the 100-point composite (weight × sub-score).
- Cash flow +30.0/30.0
- 1% rule +10.0/10.0
- DSCR +10.0/10.0
- ARV discount +7.5/15.0
- Livability +3.7/5.0
- Rent growth +2.5/5.0
- Condition / age +2.5/5.0
- Schools +1.3/10.0
- Appreciation +0.0/10.0
$108,000
🖨 Deal sheet 📄 Offer letter ✓ Due diligence
Listing remarks MLS
Welcome to this charming and well-maintained home located in the heart of Detroit's 48214 corridor. Offering 4 bedrooms and 2 full bathrooms, this residence features a functional layout with approximately 1,052 sqft of living space, perfect for homeowners or investors alike. Built in 1919, the home blends classic character with everyday comfort. Enjoy a bright interior, comfortable living areas, and a practical floor plan ready for your personal touch. The property includes a basement and sits on a manageable lot, providing low-maintenance outdoor space with room for future improvements or customization. Conveniently located near major roads, schools, and neighborhood amenities, this home offers easy access to downtown Detroit, Belle Isle, and the growing East Side and Jefferson Chalmers areas. Whether you're a first-time buyer or looking to expand your investment portfolio, this property presents a great opportunity in an up-and-coming area of the city. Schedule your showing today!
Key facts
- Manageable lot
- Functional layout
- 3,049 sq ft lot
Tags
Property features AI
Exterior
- Parking: No garage
- Utilities: Public water; Public sewer
- Home design: Single-family residence; One story; Ground-level entry
- Construction: Vinyl and wood siding; Brick/mortar foundation
- Exterior features: Paved road access; Lot approximately 0.07 acres (30 x 102.86)
Interior
- Bathrooms: 2 full bathrooms
- Heating & cooling: Forced air heating (natural gas); No cooling
- Interior features: Unfinished basement; 6 total rooms
Neighborhood map
What this means for you Summary
Snapshot
- This is a 4-bed/1.0-bath single-family listed at $108k.
Deal economics
- At list price, monthly cash flow is $606 ($7k/yr) — positive.
- The deal already cash-flows at list — no discount required.
- Meets the 1% rule at list price ($2k rent vs $108k).
- Recommended offer: $106k (1.5% below list) — sets the bar for market timing.
- Cap rate 13.0% vs local median 10.2% in Detroit — meaningfully above typical; check what's discounted (condition, days-on-market, listing class) to confirm the premium yield is real.
Location & tenants
- Location reads 73/100 on livability (#218 in MI) — a middle-class / working-renter tenant base. Strengths: amenities A+, commute A+, cost of living A+; Watch: schools F, crime F, employment F.
- Detroit Public Schools Community District (urban): math 10% / reading 24% proficiency, ranked #499 of 540 in MI (top 92%) — low school quality limits family demand, transient renter base, plan for 1-2y turnover; 90% free/reduced lunch — lower-income household profile, screen leases tightly.
- Market conditions: 298 active listings in the ZIP; 7 comparable units currently listed for rent nearby; rentals lingering (median 44d on market — plan ~5-8 weeks vacancy on turnover, expect pricing pressure); 71% of comp listings sitting > 30 days — soft ceiling on asking rent; lower-income renter base — watch delinquency; 2,639 units permitted in Wayne County in 2024 (1,216 in 5+ unit buildings).
- At $1,712/mo this rent would consume 61% of the median local household income ($34k/yr) (locally 1364% of renters already pay >50% of income on rent) — very limited rent-growth headroom before tenants either downsize or default.
Forward outlook
- Local home prices are declining (-3.0%/yr); year-one equity from $747 of loan paydown is wiped out by about $3k of value loss. Plan a longer hold.
- Wayne County population projected at -17% by 2050 — secular population decline; favor cash flow + early exit over multi-decade hold.
- At projected returns (-3.0% appreciation + 3.0% rent growth), your $30k cash investment doubles in ~6 years — after that, you're playing with house money.
Negotiation context
- It's been on market 15 days — a 2% lower offer ($106k) is reasonable based on typical stale-listing flexibility.
- 6 sale attempts since 14y ago with the ask held roughly flat each time — persistent listings suggest the price (not the market) is what's stuck; bring a comps-based counter.
- Current owner paid $1k; list at $108k implies a 8900% gain — meaningful room to come down on a strong offer.
Risks & watch-outs
- Watch-outs: built in 1919 — expect roof / HVAC / electrical / plumbing capex.
Questions for the listing agent
- Built in 1919 — when were the roof, HVAC, electrical panel, plumbing, and water heater last replaced?
- Is there a deadline driving the sale (1031 exchange, divorce, estate, relocation)? That informs how much negotiation room exists.
- Schools are F-rated, which usually means shorter tenancies and higher turnover. Who's the typical renter profile here, and what's been the actual vacancy rate?
- Crime grade is F in this area — have there been break-ins, vandalism, or insurance claims at this property in the last 3 years? What carrier currently insures it and at what premium?
- What's the average days-on-market for RENTAL listings here right now (not sales)? A rising rental-DOM trend means longer vacancies and softer asking-rent achievability than the comps imply.
- What's the recent tenant-quality profile in this submarket — average credit score on applications, eviction rate, late-payment / NSF rate, and stable-employment percentage? A property-management company in the area should have these aggregated.
- How much new for-sale + rental construction is in the pipeline within 1–3 miles? Heavy new supply typically softens prices + rents 12–24 months out; constrained supply supports both.
Investment metrics
- 1% rule
- 1.59% ✓
- Cap rate
- 13.03%
- Cash-on-cash
- 24.05%
- DSCR
- 2.07
- GRM
- 5.3
CMA / ARV
- ARV (on-the-fly)
- $42,080
- Comps found
- 9
Show comp detail 9 sales within ~0.75 mi
| Address | Dist | Beds/Ba | Sqft | Sold | Price | $/sf | Match |
|---|---|---|---|---|---|---|---|
| 4673 French Rd | 0.42mi | 3/1.0 (-1) | 1,060 (+1%) | 7mo | $16,500 | $16 | 68 |
| 4012 Lemay St | 0.13mi | 3/1.0 (-1) | 1,150 (+9%) | 7mo | $70,000 | $61 | 68 |
| 3789 Montclair St | 0.27mi | 3/1.0 (-1) | 1,110 (+6%) | 7mo | $32,000 | $29 | 67 |
| 3855 Harding St | 0.33mi | 3/1.0 (-1) | 986 (-6%) | 8mo | $45,000 | $46 | 62 |
| 3894 Lillibridge St | 0.15mi | 4/1.5 | 1,208 (+15%) | 6mo | $49,900 | $41 | 62 |
| 3504 Beniteau St | 0.36mi | 3/1.0 (-1) | 1,185 (+13%) | 7mo | $13,950 | $12 | 52 |
| 5270 Montclair St | 0.68mi | 3/1.0 (-1) | 1,112 (+6%) | 18mo | $55,000 | $49 | 39 |
| 4809 Maynard St | 0.72mi | 3/1.0 (-1) | 1,136 (+8%) | 20mo | $45,000 | $40 | 32 |
| 4254 Cadillac Blvd | 0.60mi | 3/1.0 (-1) | 1,193 (+13%) | 19mo | $16,750 | $14 | 29 |
Match score weights: distance 35% · size 25% · config 20% · recency 20%. Top-matched comps best support the ARV.
Projected returns pro-forma
-3.0% appreciation · 3.0% rent growth · sell at horizon
- IRR
- 17.3%
- Equity multiple
- 1.70×
- Total profit
- $21,133
- Equity at exit
- $16,103
- IRR
- 25.8%
- Equity multiple
- 3.26×
- Total profit
- $68,221
- Equity at exit
- $9,338
Cash invested: $30,240 (down + closing). Projections, not guarantees.
Landlord ↔ Tenant lean methodology
- Overall (STATE)
- 62 Landlord-Friendly
- State Michigan
- 62 Landlord-Friendly · EVEN
- County
- — inherits STATE
- City
- — inherits STATE
ZIP-level market 48214
- Active inventory
- 298
- Price-to-rent
- 5.3×
Monthly cashflow live
- Estimated rent
- $1,712 high interval (Pro) →
- Mortgage (P&I)
- −$566
- Tax est. 1.5%
- −$135 /mo · $1,620/yr
- Insurance
- −$45
- HOA
- −$0
- Vacancy / Maint / Mgmt
- −$360
- Net cashflow
- $606
Break-even live
UW: 25.0% down · 7.5% · 30yr · 1.5% tax · 5.0% vac · 8.0% maint · 8.0% mgmt
Financing live
Cash to close
- Down payment
- $27,000
- Closing costs
- $3,240
- Reserves months
- —
- Total cash needed
- —
Loan-product check · same deal, 3 products live
Conventional
25% down · 7.5% · 30yr
- Down + closing
- —
- Monthly P&I
- —
- Monthly cashflow
- —
- DSCR
- —
- Eligible?
- —
Personal DTI + credit; lowest rate.
DSCR
20% down · 8.5% · 30yr
- Down + closing
- —
- Monthly P&I
- —
- Monthly cashflow
- —
- DSCR
- —
- Eligible?
- —
No personal income docs; deal must DSCR.
Hard money
10% down · 12.0% · 12mo
- Down + closing
- —
- Monthly P&I
- —
- Monthly cashflow
- —
- DSCR
- —
- Eligible?
- —
Short-term bridge; refi at stabilization.
Rent comps 7 comps
| Address | Beds | Baths | Sqft | Rent | $/sqft | DOM | Units | Dist |
|---|---|---|---|---|---|---|---|---|
| 4487 French Rd Detroit, MI | 4.0 | 2.0 | 1280 | $1,800 | $1.41 | 43d | 1 | 0.29mi |
| 4667 Beniteau St Detroit, MI | 5.0 | 2.0 | 1396 | $1,700 | $1.22 | 43d | 1 | 0.36mi |
| 5045 Fairview St Detroit, MI | 3.0 | 1.0 | 1303 | $1,200 | $0.92 | 43d | 1 | 0.46mi |
| 5342 Cooper St Detroit, MI | 3.0 | 1.0 | 1125 | $1,200 | $1.07 | 24d | 1 | 0.94mi |
| 8843 E Canfield St Detroit, MI | 4.0 | 2.0 | 1200 | $2,400 | $2.00 | 43d | 1 | 1.00mi |
| 3475 Crane St Detroit, MI | 3.0 | 1.5 | 1000 | $1,338 | $1.34 | 43d | 1 | 1.10mi |
| 4169 Burns St Detroit, MI | 4.0 | 2.5 | 1326 | $2,300 | $1.73 | 24d | 1 | 1.17mi |
Listing history 11 events
-
2026-06-18days on market $108,000 Active 15 DOM
-
2026-06-17days on market $108,000 Active 14 DOM
-
2026-06-16days on market $108,000 Active 13 DOM
-
2026-06-15days on market $108,000 Active 12 DOM
-
2026-06-13days on market $108,000 Active 10 DOM
-
2026-06-13days on market $108,000 Active 9 DOM
-
2026-06-09days on market $108,000 Active 6 DOM
-
2026-06-08days on market $108,000 Active 5 DOM
-
2026-06-07days on market $108,000 Active 4 DOM
-
2026-06-04remarks 693-char remark
-
2026-06-04$108,000 Active 1 DOM
ⓘ Source: listings_history table (triggers on properties + properties_extension) + one-shot
backfill from property_details.listing_events for pre-trigger history.
Climate risk First Street
- Flood 1/10 Low FEMA zone X (unshaded) · 0% chance over 30 yrs
- Wildfire 1/10 Low
- Heat 3/10 Moderate 7 d/yr ≥96°F today · 15 d/yr by 30 yrs out
- Wind 2/10 Low
- Air quality 3/10 Moderate 2 unhealthy d/yr today · 5 by 30 yrs out
Nearby sold comps map
Loading sold comps map…
Walkable amenities ~0.75 mi
Loading nearby amenities…
Taxation est. · year 1
- Rental income
- $20,545
- − Mortgage interest
- −$6,050
- − Property taxes
- −$1,620
- − Insurance
- −$540
- − Repairs & maintenance
- −$1,644
- − Management
- −$1,644
- − Depreciation
- −$3,142
- Taxable income
- $5,906
- Est. tax owed @ 24.0%
- −$1,418
- After-tax cash flow
- $5,857/yr
For passive investors: Depreciation is non-cash, so a rental often shows a tax loss while cash-flowing — sheltering income. Rental losses are passive: they offset passive income freely, and up to $25,000/yr can offset ordinary (W-2) income if you actively participate and your MAGI is under $100k (phasing out to $0 by $150k); unused losses carry forward. On sale, claimed depreciation is recaptured at up to 25%, and gains may owe capital-gains tax (a 1031 exchange can defer both). Figures are a year-1 estimate at your 24.0% rate — not tax advice; consult a CPA.
Schools (NCES district)
- District
- Detroit Public Schools Community District
- NCES district ID
- 2601103
- Math proficiency
- 10% ▼ -2.00%
- Reading proficiency
- 24% ▲ 6.00%
- Median HH income
- $25,815
- Composite
- 13.06/100
- National rank
- #9564
- State rank
- #499 of 540 in MI
Livability — Detroit
- Score
- 73/100
- State rank
- #218
- US rank
- #5427
Category grades
Schools grade is shown separately in the Schools card above.
Census & demographics
- Census place
- Detroit, MI
- County
- Wayne County · 1,562,939 people
- City population
- 572,865
- Metro
- Detroit-Warren-Dearborn, MI
- Population (ZIP)
- 18,595
- Household income
- $33,544
- Rent vs Own
- Severe rent burden
- 1364.0
Population outlook (Wayne County) Hauer SSP2
- Today (2025)
- 1,675,273 people
- By 2030
- 1,620,300 · -3.3%
- By 2040
- 1,502,341 · -10.3%
- By 2050
- 1,384,039 · -17.4%
- By 2075
- 1,124,592 · -32.9%
- By 2100
- 881,193 · -47.4%
Race, ethnicity, and origin ACS 2023
- Neighborhood character
- Predominantly Black (79%)
- Race & ethnicity
- Black 79% White 16% Two or more races 4%
- Common ancestry
- Romanian 1% Iranian 1% Lithuanian 1%
- Foreign-born
- 3% · Canada, Jamaica
- Languages at home
- 98% English-only · Spanish 1%
Political lean MEDSL · Wayne
- 2024 margin
- Strong D (+29.0) · D 62.7% · R 33.7% · Other 3.6%
- 2008→2024 swing
- -20.5pp toward R · 2008: 49.5pp · 2024: 29.0pp
- All cycles
- 2024: D+29.0 2020: D+38.1 2016: D+37.3 2012: D+46.9 2008: D+49.5
Not yet ingested
- Civics
- —
Market trends
- HPI YoY
- ▼ -367.43%
- Current HPI
- 102.0969
- Rent YoY
- —
- Metro
- Detroit-Warren-Dearborn, MI
- State GDP YoY
- ▲ 1.37%
- F500 in state
- 28
Industry mix (Fortune 500 HQ in MI)
| Industry | F500 HQs | Revenue |
|---|---|---|
| Automotive Parts | 3 | $48B |
|
||
| Automotive | 2 | $372B |
|
||
| Chemicals | 1 | $45B |
|
||
| Automotive Retail | 1 | $29B |
|
||
| Healthcare / Medical Devices | 1 | $23B |
|
||
| Automotive Technology | 1 | $20B |
|
||
Price history
+8900.0% since first listed10 events — show timeline
- 2026-06-03 Listed $108,000 MiRealSource-MiMLS
- 2026-06-03 Listed $108,000 REALCOMP
- 2026-01-27 Listing Removed — MiRealSource-MiMLS
- 2026-01-27 Listing Removed — REALCOMP
- 2025-11-06 Listed $130,000 MiRealSource-MiMLS
- 2025-11-06 Listed $130,000 REALCOMP
- 2012-06-14 Sold (MLS) $1,200 MiRealSource-MiMLS
- 2012-06-14 Sold (MLS) $1,200 REALCOMP
- 2012-01-03 Listed $1,200 MiRealSource-MiMLS
- 2012-01-03 Listed $1,200 REALCOMP
Property tax history
-63.3%/yrLatest (2017): $26 · -94.8% YoY. Source: county tax records.
Cash-flow waterfall
monthlySold comps — $/sqft
last 12 mo · ≤1 miLoading sold comps…