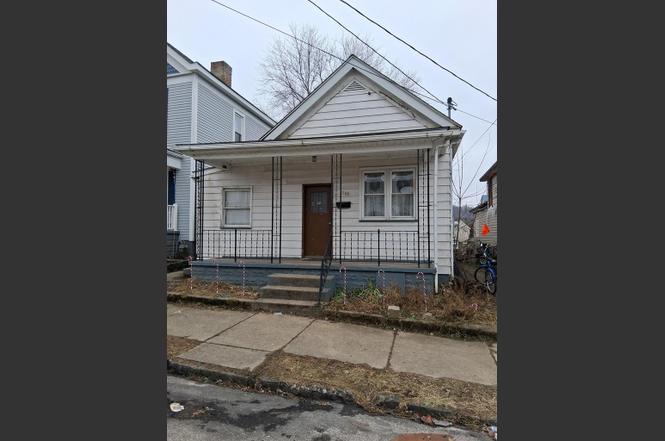
309 8th St · Moundsville, WV
Flood risk 9/10 · Severe
- FEMA flood zone
- X (unshaded)
- Chance of flooding over 30 yrs
- 0.99%
- Est. flood insurance / yr
- $473 – $860
Fire risk 1/10 · Minimal
- Est. fire insurance / yr
- $787 – $1,461
Heat risk 4/10 · Minor
- Hot days now (above 99°F)
- 8 days/yr
- Hot days in 30 yrs
- 20 days/yr
Wind risk 1/10 · Minimal
- Chance of severe wind over 30 yrs
- —
Air-quality risk 2/10 · Minimal
- Unhealthy air days now
- 1 days/yr
- Unhealthy air days in 30 yrs
- 3 days/yr
Risk factors via First Street. Map © Google.
Why this score? — see what drove the B+ grade
The composite is a weighted blend of 9 inputs, each scored 0–100. Each bar is that input's sub-score; the figure is the points it added to the 100-point composite (weight × sub-score).
- Cash flow +30.0/30.0
- ARV discount +15.0/15.0
- DSCR +10.0/10.0
- 1% rule +9.0/10.0
- Livability +3.3/5.0
- Schools +2.7/10.0
- Rent growth +2.5/5.0
- Condition / age +2.5/5.0
- Appreciation +0.0/10.0
$69,900
🖨 Deal sheet (PDF) 📄 Offer letter ✓ Due diligence
Listing remarks MLS
Great starter home or investment opportunity! 4 bedrooms, one captured. 10 foot ceilings! Large basement. Live here while making it your own. Design options are unlimited. Lots of storage available!
Key facts
- Efficient floor plan
- Resale potential
- Single-level layout
Tags
Property features AI
Exterior
- Parking: Detached 1-car garage
- Utilities: Public water; Public sewer
- Home design: Single family ranch (one story); Residential zoning
- Construction: Aluminum siding; Shingle roof
- Exterior features: Front porch
Interior
- Kitchen: Cooktop; Refrigerator; Electric water heater
- Flooring: Hardwood
- Bathrooms: 2 full bathrooms
- Heating & cooling: Forced air heating; Central air; Ceiling fan(s)
- Interior features: Hardwood flooring; Full basement; 8 total rooms
Neighborhood map
What this means for you Summary
Snapshot
- This is a 4-bed/2.0-bath single-family listed at $70k.
Deal economics
- At list price, monthly cash flow is $255 ($3k/yr) — positive.
- The deal already cash-flows at list — no discount required.
- Meets the 1% rule at list price ($981 rent vs $70k).
- Recommended offer: $62k (12.0% below list) — sets the bar for market timing.
- Cap rate 11.6% vs local median 4.7% in Moundsville — top-decile yield for the area; either an underpriced asset or a hidden risk that comps aren't pricing in. Stress-test before assuming the spread holds.
Location & tenants
- Location reads 66/100 on livability (#105 in WV) — a middle-class / working-renter tenant base. Strengths: cost of living A+, housing A-, health & safety A-; Watch: schools D+, amenities F, commute F.
- Marshall County Schools (suburban): math 28% / reading 36% proficiency, ranked #21 of 55 in WV (top 38%) — families likely to look elsewhere, expect single-tenant / working-renter base with shorter leases.
- Market conditions: 78 active listings in the ZIP; 6 units permitted in Marshall County in 2024 (0 in 5+ unit buildings).
Forward outlook
- Local home prices are declining (-3.0%/yr); year-one equity from $483 of loan paydown is wiped out by about $2k of value loss. Plan a longer hold.
- Marshall County population projected at -19% by 2050 — secular population decline; favor cash flow + early exit over multi-decade hold.
- At projected returns (-3.0% appreciation + 3.0% rent growth), your $20k cash investment doubles in ~8 years — after that, you're playing with house money.
Negotiation context
- It's been on market 159 days — a 12% lower offer ($62k) is reasonable based on typical stale-listing flexibility.
- 4 sale attempts since 21y ago; this cycle's ask has dropped $29k (29%) from the opening price — seller is motivated, your offer sets the floor, not the list.
- Current owner paid $58k; 22% above their basis — modest negotiation headroom, anchor on the comps not their cost.
Risks & watch-outs
- Watch-outs: flood insurance adds $56/mo; built in 1900 — expect roof / HVAC / electrical / plumbing capex.
- Climate carrying-cost: severe flood risk — expect insurance premiums to compound above CPI over the hold.
Questions for the listing agent
- It's been on market 159 days. Have you received any prior offers? Is the seller open to a 12% concession, seller financing, or rate buy-down credit?
- Built in 1900 — when were the roof, HVAC, electrical panel, plumbing, and water heater last replaced?
- What's the actual annual flood-insurance premium (NFIP or private), and is the property in a SFHA with mandatory coverage?
- Why hasn't it sold? Are there any deal-killer items the seller is aware of (foundation, flood, title, zoning, code violations)?
- Is there a deadline driving the sale (1031 exchange, divorce, estate, relocation)? That informs how much negotiation room exists.
- Schools are D-rated, which usually means shorter tenancies and higher turnover. Who's the typical renter profile here, and what's been the actual vacancy rate?
- What's the average days-on-market for RENTAL listings here right now (not sales)? A rising rental-DOM trend means longer vacancies and softer asking-rent achievability than the comps imply.
- What's the recent tenant-quality profile in this submarket — average credit score on applications, eviction rate, late-payment / NSF rate, and stable-employment percentage? A property-management company in the area should have these aggregated.
- How much new for-sale + rental construction is in the pipeline within 1–3 miles? Heavy new supply typically softens prices + rents 12–24 months out; constrained supply supports both.
Investment metrics
- 1% rule
- 1.40% ✓
- Cap rate
- 11.62%
- Cash-on-cash
- 19.04%
- DSCR
- 1.85
- GRM
- 5.9
CMA / ARV
- ARV (on-the-fly)
- $95,172
- Comps found
- 12
Show comp detail 12 sales within ~0.75 mi
| Address | Dist | Beds/Ba | Sqft | Sold | Price | $/sf | Match |
|---|---|---|---|---|---|---|---|
| 606 12th St | 0.33mi | 3/2.0 (-1) | 1,320 (+7%) | 0mo | $120,000 | $91 | 68 |
| 207 Tomlinson Ave | 0.44mi | 3/1.0 (-1) | 1,232 (-0%) | 7mo | $70,000 | $57 | 64 |
| 524 9th St | 0.17mi | 3/1.0 (-1) | 1,374 (+11%) | 3mo | $41,500 | $30 | 62 |
| 1417 Purdy Ave | 0.49mi | 3/1.5 (-1) | 1,232 (-0%) | 10mo | $1 | — | 61 |
| 1106 8th St | 0.42mi | 3/2.0 (-1) | 1,156 (-6%) | 8mo | $75,000 | $65 | 58 |
| 1414 8th St | 0.64mi | 4/2.0 | 1,280 (+4%) | 9mo | $147,500 | $115 | 56 |
| 1025 Morton Ave | 0.29mi | 3/1.5 (-1) | 1,355 (+10%) | 10mo | $148,000 | $109 | 55 |
| 1004 Morton Ave | 0.27mi | 3/1.0 (-1) | 1,373 (+11%) | 6mo | $36,000 | $26 | 55 |
| 1012 Mcconnell Dr | 0.47mi | 3/2.0 (-1) | 1,080 (-13%) | 1mo | $150,000 | $139 | 51 |
| 1412 6th St | 0.66mi | 3/1.0 (-1) | 1,196 (-3%) | 10mo | $150,000 | $125 | 46 |
| 1013 Sixth St | 0.41mi | 3/1.0 (-1) | 1,368 (+11%) | 12mo | $105,000 | $77 | 44 |
| 1502 8th St | 0.68mi | 3/1.0 (-1) | 1,385 (+12%) | 2mo | $101,000 | $73 | 37 |
Match score weights: distance 35% · size 25% · config 20% · recency 20%. Top-matched comps best support the ARV.
Projected returns pro-forma
-3.0% appreciation · 3.0% rent growth · sell at horizon
- IRR
- 6.5%
- Equity multiple
- 1.25×
- Total profit
- $4,953
- Equity at exit
- $10,422
- IRR
- 15.9%
- Equity multiple
- 2.30×
- Total profit
- $25,380
- Equity at exit
- $6,044
Cash invested: $19,572 (down + closing). Projections, not guarantees.
Landlord ↔ Tenant lean methodology
- Overall (STATE)
- 83 Strongly Landlord-Friendly
- State West Virginia
- 83 Strongly Landlord-Friendly · R+22
- County
- — inherits STATE
- City
- — inherits STATE
ZIP-level market 26041
- Home prices YoY
- -24.8%
- Active inventory
- 78
- Price-to-rent
- 5.9×
Monthly cashflow live
- Estimated rent
- $981 medium interval (Pro) →
- Mortgage (P&I)
- −$367
- Tax from tax record
- −$69 /mo · $828/yr
- Insurance
- −$29
- Flood insurance flood zone
- −$56 /mo · $666/yr
- HOA
- −$0
- Vacancy / Maint / Mgmt
- −$206
- Net cashflow
- $255
Break-even live
Sensitivity live
| Price | -10% $295 | -5% $275 | +0% $255 | +5% $235 | +10% $215 |
|---|---|---|---|---|---|
| Rent | -10% $177 | -5% $216 | +0% $255 | +5% $294 | +10% $333 |
| Rate | -1.0pp $290 | -0.5pp $273 | base $255 | +0.5pp $237 | +1.0pp $218 |
UW: 25.0% down · 7.5% · 30yr · 1.5% tax · 5.0% vac · 8.0% maint · 8.0% mgmt
Financing live
Cash to close
- Down payment
- $17,475
- Closing costs
- $2,097
- Reserves months
- —
- Total cash needed
- —
Loan-product check · same deal, 3 products live
Conventional
25% down · 7.5% · 30yr
- Down + closing
- —
- Monthly P&I
- —
- Monthly cashflow
- —
- DSCR
- —
- Eligible?
- —
Personal DTI + credit; lowest rate.
DSCR
20% down · 8.5% · 30yr
- Down + closing
- —
- Monthly P&I
- —
- Monthly cashflow
- —
- DSCR
- —
- Eligible?
- —
No personal income docs; deal must DSCR.
Hard money
10% down · 12.0% · 12mo
- Down + closing
- —
- Monthly P&I
- —
- Monthly cashflow
- —
- DSCR
- —
- Eligible?
- —
Short-term bridge; refi at stabilization.
Listing history 31 events
-
2026-06-19days on market $69,900 Active 159 DOM
-
2026-06-18days on market $69,900 Active 158 DOM
-
2026-06-17price $69,900 Active 157 DOM
-
2026-06-17days on market $76,000 Active 157 DOM
-
2026-06-16days on market $76,000 Active 156 DOM
-
2026-06-15days on market $76,000 Active 155 DOM
-
2026-06-14days on market $76,000 Active 153 DOM
-
2026-06-12days on market $76,000 Active 152 DOM
-
2026-06-09days on market $76,000 Active 149 DOM
-
2026-06-08days on market $76,000 Active 148 DOM
-
2026-06-07days on market $76,000 Active 147 DOM
-
2026-06-02days on market $76,000 Active 142 DOM
-
2026-06-01days on market $76,000 Active 141 DOM
-
2026-05-31days on market $76,000 Active 140 DOM
-
2026-05-30days on market $76,000 Active 139 DOM
-
2026-05-09price $76,000
-
2026-04-15price $79,500
-
2026-03-28price $84,900
-
2026-03-24status Active
-
2026-03-12status Pending
-
2026-02-13price $88,000
-
2026-01-15price $94,900
-
2025-12-30$99,000 Active
-
2025-10-29soldstatus $57,500
-
2025-09-26soldstatus $30,000 Closed 198-char remark
Show marketing remark (198 chars)
Great starter home or investment opportunity! 4 bedrooms, one captured. 10 foot ceilings! Large basement. Live here while making it your own. Design options are unlimited. Lots of storage available!
-
2025-09-23status Pending 198-char remark
Show marketing remark (198 chars)
Great starter home or investment opportunity! 4 bedrooms, one captured. 10 foot ceilings! Large basement. Live here while making it your own. Design options are unlimited. Lots of storage available!
-
2025-09-02$65,000 Active 198-char remark
Show marketing remark (198 chars)
Great starter home or investment opportunity! 4 bedrooms, one captured. 10 foot ceilings! Large basement. Live here while making it your own. Design options are unlimited. Lots of storage available!
-
2019-07-16soldstatus $35,545
-
2012-10-11soldstatus $26,800
-
2005-04-14soldstatus $39,000 215-char remark
Show marketing remark (215 chars)
NICE RANCH HOME IN CONVENIENT LOCATION. WELL MAINTAINED. 3 BEDROOMS, 2 FULL BATHS, PLUS A SUNROOM/CHANGING ROOM OFF THE MASTER BEDROOM. UPDATES INCLUDE ROOF, BATHS, INTERIOR PAINTING. NICE HARDWOOD FLOORS. MUST SEE.
-
2005-02-23$45,000 215-char remark
Show marketing remark (215 chars)
NICE RANCH HOME IN CONVENIENT LOCATION. WELL MAINTAINED. 3 BEDROOMS, 2 FULL BATHS, PLUS A SUNROOM/CHANGING ROOM OFF THE MASTER BEDROOM. UPDATES INCLUDE ROOF, BATHS, INTERIOR PAINTING. NICE HARDWOOD FLOORS. MUST SEE.
ⓘ Source: listings_history table (triggers on properties + properties_extension) + one-shot
backfill from property_details.listing_events for pre-trigger history.
Tax reassessment forecast WV · Resets to sale price
- Current annual tax
- $828 · $69/mo
- Projected year-2 tax
- $828 · $69/mo
- Expected delta
- $0/yr ($0/mo · 0.0%)
ⓘ Screening estimate from a state-policy table — verify with the county assessor before closing.
Climate risk First Street
- Flood 9/10 Extreme FEMA zone X (unshaded) · 99% chance over 30 yrs
- Wildfire 1/10 Low
- Heat 4/10 Moderate 8 d/yr ≥99°F today · 20 d/yr by 30 yrs out
- Wind 1/10 Low
- Air quality 2/10 Low 1 unhealthy d/yr today · 3 by 30 yrs out
Nearby sold comps map
Loading sold comps map…
Walkable amenities ~0.75 mi
Loading nearby amenities…
Taxation est. · year 1
- Rental income
- $11,776
- − Mortgage interest
- −$3,915
- − Property taxes
- −$828
- − Insurance
- −$1,016
- − Repairs & maintenance
- −$942
- − Management
- −$942
- − Depreciation
- −$2,033
- Taxable income
- $2,099
- Est. tax owed @ 24.0%
- −$504
- After-tax cash flow
- $2,556/yr
For passive investors: Depreciation is non-cash, so a rental often shows a tax loss while cash-flowing — sheltering income. Rental losses are passive: they offset passive income freely, and up to $25,000/yr can offset ordinary (W-2) income if you actively participate and your MAGI is under $100k (phasing out to $0 by $150k); unused losses carry forward. On sale, claimed depreciation is recaptured at up to 25%, and gains may owe capital-gains tax (a 1031 exchange can defer both). Figures are a year-1 estimate at your 24.0% rate — not tax advice; consult a CPA.
Schools (NCES district)
- District
- Marshall County Schools
- NCES district ID
- 5400750
- Math proficiency
- 28% ▼ -6.00%
- Reading proficiency
- 36% ▼ -4.00%
- Median HH income
- $40,289
- Composite
- 26.91/100
- National rank
- #7086
- State rank
- #21 of 55 in WV
Livability — Moundsville
- Score
- 66/100
- State rank
- #105
- US rank
- #11553
Category grades
Schools grade is shown separately in the Schools card above.
Census & demographics
- Census place
- Moundsville, WV
- County
- Marshall · 16,750 people
- Metro
- Wheeling, WV-OH
- Population (ZIP)
- 15,706
- Household income
- $55,545
- Rent vs Own
- Severe rent burden
- 7.4
Population outlook (Marshall County) Hauer SSP2
- Today (2025)
- 30,387 people
- By 2030
- 29,242 · -3.8%
- By 2040
- 26,806 · -11.8%
- By 2050
- 24,627 · -19.0%
- By 2075
- 19,846 · -34.7%
- By 2100
- 15,169 · -50.1%
Race, ethnicity, and origin ACS 2023
- Neighborhood character
- Predominantly White (94%)
- Race & ethnicity
- White 94% Two or more races 3% Hispanic / Latino 1%
- Common ancestry
- Romanian 4% Iranian 2% Italian 1%
- Foreign-born
- 1% · Canada
- Languages at home
- 98% English-only · Spanish 1% German/W. Germanic 1%
Political lean MEDSL · Marshall
- 2024 margin
- Solid R (+50.0) · D 24.1% · R 74.1% · Other 1.8%
- 2008→2024 swing
- -37.5pp toward R · 2008: -12.6pp · 2024: -50.0pp
- All cycles
- 2024: R+50.0 2020: R+49.6 2016: R+51.0 2012: R+28.6 2008: R+12.6
Not yet ingested
- Civics
- —
Market trends
- HPI YoY
- ▼ -50.71%
- Current HPI
- 153.9522
- Rent YoY
- —
- Metro
- —
- State GDP YoY
- —
- F500 in state
- 0
Price history
+68.9% since first listed16 events — show timeline
- 2026-05-09 Price Changed $76,000 WBOR
- 2026-04-15 Price Changed $79,500 WBOR
- 2026-03-28 Price Changed $84,900 WBOR
- 2026-03-24 Relisted — WBOR
- 2026-03-12 Pending — WBOR
- 2026-02-13 Price Changed $88,000 WBOR
- 2026-01-15 Price Changed $94,900 WBOR
- 2025-12-30 Listed $99,000 WBOR
- 2025-10-29 Sold (Public Records) $57,500 Public Records
- 2025-09-26 Sold (MLS) $30,000 WBOR
- 2025-09-23 Pending — WBOR
- 2025-09-02 Listed $65,000 WBOR
- 2019-07-16 Sold (Public Records) $35,545 Public Records
- 2012-10-11 Sold (Public Records) $26,800 Public Records
- 2005-04-14 Sold (MLS) $39,000 WBOR
- 2005-02-23 Listed $45,000 WBOR
Property tax history
+1.9%/yrLatest (2025): $828 · +2.9% YoY. Source: county tax records.
Cash-flow waterfall
monthlySold comps — $/sqft
last 12 mo · ≤1 miLoading sold comps…