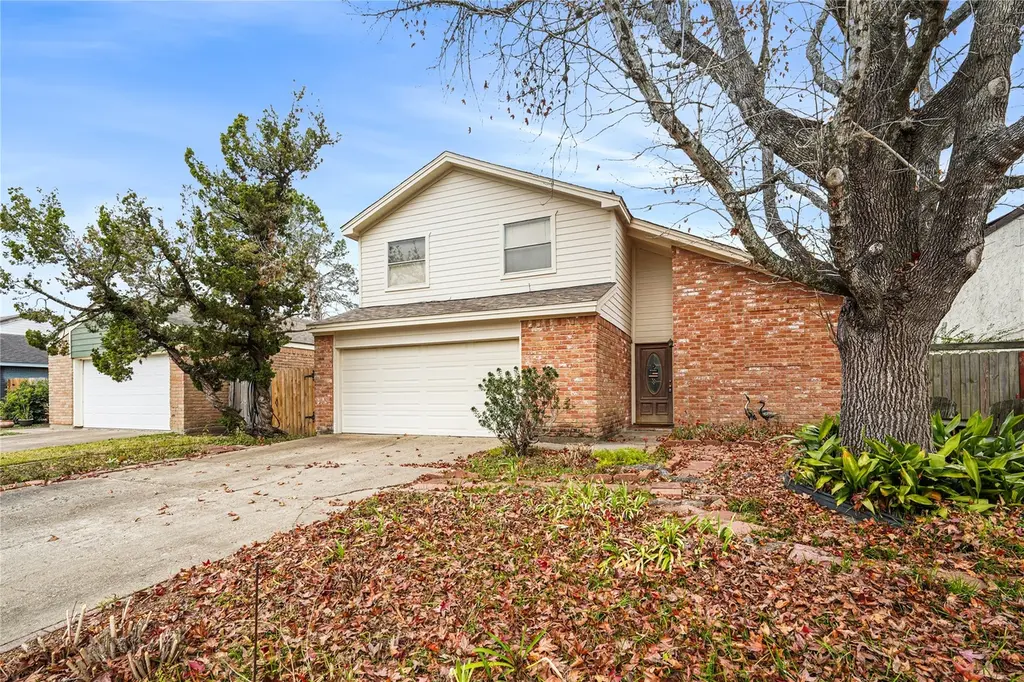
3302 Hunterwood Dr · Missouri City, TX
Flood risk 6/10 · Moderate
- FEMA flood zone
- X (unshaded)
- Chance of flooding over 30 yrs
- 0.69%
- Est. flood insurance / yr
- $507 – $1,088
Fire risk 1/10 · Minimal
- Est. fire insurance / yr
- $1,222 – $2,270
Heat risk 9/10 · Severe
- Hot days now (above 110°F)
- 7 days/yr
- Hot days in 30 yrs
- 23 days/yr
Wind risk 9/10 · Severe
- Chance of severe wind over 30 yrs
- 99.0%
Air-quality risk 2/10 · Minimal
- Unhealthy air days now
- 2 days/yr
- Unhealthy air days in 30 yrs
- 2 days/yr
Risk factors via First Street. Map © Google.
Why this score? — see what drove the C- grade
The composite is a weighted blend of 9 inputs, each scored 0–100. Each bar is that input's sub-score; the figure is the points it added to the 100-point composite (weight × sub-score).
- Cash flow +15.0/30.0
- ARV discount +12.4/15.0
- 1% rule +4.9/10.0
- DSCR +4.6/10.0
- Schools +4.5/10.0
- Appreciation +4.2/10.0
- Livability +3.4/5.0
- Rent growth +2.5/5.0
- Condition / age +2.5/5.0
$239,999
🖨 Deal sheet 📄 Offer letter ✓ Due diligence
Listing remarks MLS
Welcome to your dream home in the established Quail Valley community. This charming residence blends character and functionality in a prime location just minutes from First Colony Mall and Highway 59, offering easy access to shopping, dining, and everything you need. Zoned to highly rated schools, this home checks all the boxes. Enjoy a brand-new roof (2025), soaring ceilings, and a skylight in the living room that fills the space with natural light. A built-in wet bar makes entertaining effortless, while the home’s layout offers both comfort and versatility. Located just steps from the golf course, you’ll love the peaceful setting and lifestyle this home provides.
Key facts
- Hardie plank siding
- Brand new roof
- Built in wet bar
Tags
Neighborhood map
What this means for you Summary
Snapshot
- This is a 4-bed/3.0-bath single-family listed at $240k.
Deal economics
- At list price, monthly cash flow is $77 ($920/yr) — positive.
- The deal already cash-flows at list — no discount required.
- To meet the 1% rule (rent ≥ 1% of price), the offer needs to be $238k (1.0% below list).
- Recommended offer: $236k (1.5% below list) — sets the bar for market timing.
- Cap rate 6.7% vs local median 3.5% in Missouri City — top-decile yield for the area; either an underpriced asset or a hidden risk that comps aren't pricing in. Stress-test before assuming the spread holds.
Location & tenants
- Location reads 67/100 on livability (#526 in TX) — a middle-class / working-renter tenant base. Strengths: housing A+, crime A, employment A; Watch: amenities F, commute F, health & safety F.
- Fort Bend ISD (suburban): math 44% / reading 53% proficiency, ranked #140 of 826 in TX (top 17%) — families likely to look elsewhere, expect single-tenant / working-renter base with shorter leases.
- Market conditions: Rents soft (-0.1%/yr); 1215 active listings in the ZIP; 13 comparable units currently listed for rent nearby; rentals at typical pace (median 22d on market — plan ~3-4 weeks tenant-placement turnaround); high-income renter base; 12,093 units permitted in Fort Bend County in 2024 (815 in 5+ unit buildings).
Forward outlook
- Local home prices are declining (-1.7%/yr); year-one equity from $2k of loan paydown is wiped out by about $4k of value loss. Plan a longer hold.
- Fort Bend County population projected at +75% by 2050 — long-run rental-demand tailwind backs the buy-and-hold thesis.
Negotiation context
- It's been on market 17 days — a 2% lower offer ($236k) is reasonable based on typical stale-listing flexibility.
Risks & watch-outs
- Climate carrying-cost: major flood risk; severe wind risk, 99% chance of damaging wind over 30y; extreme-heat days projected 7→23/yr by 2055 (HVAC capex compounding) — expect insurance premiums to compound above CPI over the hold.
Questions for the listing agent
- Built in 1978 — when were the roof, HVAC, electrical panel, plumbing, and water heater last replaced?
- What does the HOA fee cover, when was the last increase, and are there any pending special assessments or reserve-fund shortfalls?
- Is there a deadline driving the sale (1031 exchange, divorce, estate, relocation)? That informs how much negotiation room exists.
- Schools are B-rated — typically a magnet for longer-tenancy family renters. What's the average tenant stay here, and is there a school-zone premium baked into asking?
- What's the average days-on-market for RENTAL listings here right now (not sales)? A rising rental-DOM trend means longer vacancies and softer asking-rent achievability than the comps imply.
- What's the recent tenant-quality profile in this submarket — average credit score on applications, eviction rate, late-payment / NSF rate, and stable-employment percentage? A property-management company in the area should have these aggregated.
- How much new for-sale + rental construction is in the pipeline within 1–3 miles? Heavy new supply typically softens prices + rents 12–24 months out; constrained supply supports both.
Investment metrics
- 1% rule
- 0.99% ✗
- Cap rate
- 6.68%
- Cash-on-cash
- 1.37%
- DSCR
- 1.06
- GRM
- 8.4
CMA / ARV
- ARV (median comp)
- $269,023
- List price
- $239,999
- Delta
- -3.35%
- Verdict
- FAIR
- Comps
- 20 within 1.0 mi
Show comp detail 12 sales within ~0.75 mi
| Address | Dist | Beds/Ba | Sqft | Sold | Price | $/sf | Match |
|---|---|---|---|---|---|---|---|
| 3229 Continental Dr | 0.15mi | 3/2.5 (-1) | 1,942 (+1%) | 4mo | $245,000 | $126 | 81 |
| 3311 La Costa Rd | 0.02mi | 3/2.0 (-1) | 1,817 (-6%) | 3mo | $295,000 | $162 | 78 |
| 3226 Palm Desert Ln | 0.12mi | 3/2.5 (-1) | 1,809 (-6%) | 0mo | $256,500 | $142 | 77 |
| 2810 Oak Hill Dr | 0.10mi | 4/2.5 | 2,163 (+12%) | 7mo | $272,000 | $126 | 67 |
| 3327 Springhill Dr | 0.34mi | 3/2.0 (-1) | 1,841 (-4%) | 1mo | $265,000 | $144 | 67 |
| 3322 Ashmont Ln | 0.26mi | 3/2.0 (-1) | 1,784 (-7%) | 2mo | $215,000 | $121 | 65 |
| 3215 Springhill Dr | 0.35mi | 3/2.0 (-1) | 1,784 (-7%) | 4mo | $259,000 | $145 | 59 |
| 3315 Golden Tee Ct | 0.48mi | 3/2.0 (-1) | 1,786 (-7%) | 2mo | $175,000 | $98 | 54 |
| 3043 Bonney Briar Dr | 0.62mi | 4/2.5 | 2,206 (+14%) | 1mo | $309,900 | $140 | 44 |
| 2850 Creekway Cir | 0.69mi | 3/2.0 (-1) | 2,072 (+8%) | 5mo | $269,000 | $130 | 42 |
| 2207 Cottonwood Ct | 0.68mi | 3/2.0 (-1) | 1,700 (-12%) | 4mo | $225,000 | $132 | 37 |
| 3430 W Creek Club Dr | 0.73mi | 4/2.5 | 2,210 (+15%) | 6mo | $338,000 | $153 | 34 |
Match score weights: distance 35% · size 25% · config 20% · recency 20%. Top-matched comps best support the ARV.
Projected returns pro-forma
-1.67% appreciation · 0.0% rent growth · sell at horizon
- IRR
- -10.2%
- Equity multiple
- 0.60×
- Total profit
- $-27,172
- Equity at exit
- $50,335
- IRR
- -6.4%
- Equity multiple
- 0.53×
- Total profit
- $-31,384
- Equity at exit
- $46,622
Cash invested: $67,200 (down + closing). Projections, not guarantees.
Landlord ↔ Tenant lean methodology
- Overall (STATE)
- 87 Strongly Landlord-Friendly
- State Texas
- 87 Strongly Landlord-Friendly · R+5
- County
- — inherits STATE
- City
- — inherits STATE
ZIP-level market 77459
- Home prices YoY
- -0.8%
- Rents YoY
- -0.1%
- Active inventory
- 1215
- Price-to-rent
- 8.4×
Monthly cashflow live
- Estimated rent
- $2,377 high interval (Pro) →
- Mortgage (P&I)
- −$1,259
- Tax from tax record
- −$404 /mo · $4,844/yr
- Insurance
- −$100
- HOA
- −$39
- Vacancy / Maint / Mgmt
- −$499
- Net cashflow
- $77
Break-even live
UW: 25.0% down · 7.5% · 30yr · 1.5% tax · 5.0% vac · 8.0% maint · 8.0% mgmt
Financing live
Cash to close
- Down payment
- $60,000
- Closing costs
- $7,200
- Reserves months
- —
- Total cash needed
- —
Loan-product check · same deal, 3 products live
Conventional
25% down · 7.5% · 30yr
- Down + closing
- —
- Monthly P&I
- —
- Monthly cashflow
- —
- DSCR
- —
- Eligible?
- —
Personal DTI + credit; lowest rate.
DSCR
20% down · 8.5% · 30yr
- Down + closing
- —
- Monthly P&I
- —
- Monthly cashflow
- —
- DSCR
- —
- Eligible?
- —
No personal income docs; deal must DSCR.
Hard money
10% down · 12.0% · 12mo
- Down + closing
- —
- Monthly P&I
- —
- Monthly cashflow
- —
- DSCR
- —
- Eligible?
- —
Short-term bridge; refi at stabilization.
Rent comps 13 comps
| Address | Beds | Baths | Sqft | Rent | $/sqft | DOM | Units | Dist |
|---|---|---|---|---|---|---|---|---|
| 3327 Shady Glen Ln Missouri City, TX | 4.0 | 2.5 | 2232 | $2,250 | $1.01 | 13d | 1 | 0.20mi |
| 22 Chapparal Ct Missouri City, TX | 3.0 | 2.0 | 1504 | $2,000 | $1.33 | 44d | 1 | 0.41mi |
| 2120 Bermuda Dunes Dr Missouri City, TX | 3.0 | 2.5 | 2100 | $2,200 | $1.05 | 24d | 1 | 0.44mi |
| 2608 Grand Plantation Ct Missouri City, TX | 3.0 | 2.0 | 2150 | $2,450 | $1.14 | 13d | 1 | 0.75mi |
| 3611 Duncaster Dr Missouri City, TX | 3.0 | 2.5 | 1926 | $2,100 | $1.09 | 20d | 1 | 0.77mi |
| 2319 Quail Valley East Dr Missouri City, TX | 5.0 | 3.0 | 2235 | $2,000 | $0.89 | 44d | 1 | 1.00mi |
| 2307 Hilton Head Dr Missouri City, TX | 4.0 | 2.0 | 2606 | $2,239 | $0.86 | 17d | 1 | 1.02mi |
| 3912 Cedar Valley Dr Missouri City, TX | 3.0 | 2.0 | 2151 | $2,200 | $1.02 | 21d | 1 | 1.24mi |
| 1547 Revolution Way Missouri City, TX | 3.0 | 3.0 | 1680 | $2,300 | $1.37 | 13d | 1 | 1.33mi |
| 1620 Good Day Dr Missouri City, TX | 3.0 | 3.0 | 1364 | $1,790 | $1.31 | 44d | 1 | 1.38mi |
| 1919 Doliver Cir Missouri City, TX | 3.0 | 2.0 | 1515 | $2,000 | $1.32 | 44d | 1 | 1.42mi |
| 4340 Lake Walk Ct Missouri City, TX | 3.0 | 2.5 | 2100 | $2,600 | $1.24 | 22d | 1 | 1.45mi |
| 1420 Revolution Way Missouri City, TX | 3.0 | 2.5 | 1649 | $2,250 | $1.36 | 44d | 1 | 1.46mi |
HOA detail
- Monthly dues
- $39 · $468/yr
Listing history 16 events
-
2026-06-18days on market $239,999 Active 17 DOM
-
2026-06-17days on market $239,999 Active 16 DOM
-
2026-06-16days on market $239,999 Active 15 DOM
-
2026-06-15days on market $239,999 Active 14 DOM
-
2026-06-13days on market $239,999 Active 12 DOM
-
2026-06-09days on market $239,999 Active 8 DOM
-
2026-06-08days on market $239,999 Active 7 DOM
-
2026-06-07days on market $239,999 Active 6 DOM
-
2026-06-04days on market $239,999 Active 3 DOM
-
2026-06-03days on market $239,999 Active 2 DOM
-
2026-06-02remarks 693-char remark
-
2026-06-02pricedays on market $239,999 Active 1 DOM
-
2026-06-01days on market $260,000 Active 109 DOM
-
2026-05-31days on market $260,000 Active 108 DOM
-
2026-02-12$260,000 Active 688-char remark
Show marketing remark (688 chars)
Welcome to your dream home in the established Quail Valley community. This charming residence blends character and functionality in a prime location just minutes from First Colony Mall and Highway 59, offering easy access to shopping, dining, and everything you need. Zoned to highly rated schools, this home checks all the boxes. Enjoy a brand-new roof (2025), soaring ceilings, and a skylight in the living room that fills the space with natural light. A built-in wet bar makes entertaining effortless, while the home’s layout offers both comfort and versatility. Located just steps from the golf course, you’ll love the peaceful setting and lifestyle this home provides.
-
2006-09-18soldstatus
ⓘ Source: listings_history table (triggers on properties + properties_extension) + one-shot
backfill from property_details.listing_events for pre-trigger history.
Tax reassessment forecast TX · Resets to sale price
- Current annual tax
- $4,844 · $404/mo
- Projected year-2 tax
- $4,844 · $404/mo
- Expected delta
- $0/yr ($0/mo · 0.0%)
ⓘ Screening estimate from a state-policy table — verify with the county assessor before closing.
Climate risk First Street
- Flood 6/10 Major FEMA zone X (unshaded) · 69% chance over 30 yrs
- Wildfire 1/10 Low
- Heat 9/10 Extreme 7 d/yr ≥110°F today · 23 d/yr by 30 yrs out
- Wind 9/10 Extreme 99% chance of damaging wind over 30 yrs
- Air quality 2/10 Low 2 unhealthy d/yr today · 2 by 30 yrs out
Nearby sold comps map
Loading sold comps map…
Walkable amenities ~0.75 mi
Loading nearby amenities…
Taxation est. · year 1
- Rental income
- $28,526
- − Mortgage interest
- −$13,444
- − Property taxes
- −$4,844
- − Insurance
- −$1,200
- − Repairs & maintenance
- −$2,282
- − Management
- −$2,282
- − HOA
- −$468
- − Depreciation
- −$6,982
- Taxable loss
- −$2,976
- Est. tax savings @ 24.0%
- +$714
- After-tax cash flow
- $1,634/yr
For passive investors: Depreciation is non-cash, so a rental often shows a tax loss while cash-flowing — sheltering income. Rental losses are passive: they offset passive income freely, and up to $25,000/yr can offset ordinary (W-2) income if you actively participate and your MAGI is under $100k (phasing out to $0 by $150k); unused losses carry forward. On sale, claimed depreciation is recaptured at up to 25%, and gains may owe capital-gains tax (a 1031 exchange can defer both). Figures are a year-1 estimate at your 24.0% rate — not tax advice; consult a CPA.
Schools (NCES district)
- District
- Fort Bend ISD
- NCES district ID
- 4819650
- Math proficiency
- 44% ▼ -15.00%
- Reading proficiency
- 53% ▼ -4.00%
- Median HH income
- $82,360
- Composite
- 44.61/100
- National rank
- #2779
- State rank
- #140 of 826 in TX
Livability — Missouri City
- Score
- 67/100
- State rank
- #526
- US rank
- #10308
Category grades
Schools grade is shown separately in the Schools card above.
Census & demographics
- Census place
- Missouri City, TX
- County
- Fort Bend County · 836,777 people
- City population
- 123,513
- Metro
- Houston-The Woodlands-Sugar Land, TX
- Population (ZIP)
- 84,221
- Household income
- $129,151
- Rent vs Own
- Severe rent burden
- 1004.0
Population outlook (Fort Bend County) Hauer SSP2
- Today (2025)
- 1,004,526 people
- By 2030
- 1,153,104 · +14.8%
- By 2040
- 1,453,718 · +44.7%
- By 2050
- 1,753,781 · +74.6%
- By 2075
- 2,455,772 · +144.5%
- By 2100
- 2,930,528 · +191.7%
Race, ethnicity, and origin ACS 2023
- Neighborhood character
- Highly diverse neighborhood (Simpson 0.75)
- Race & ethnicity
- White 34% Black 26% Asian 22% Hispanic / Latino 13% Two or more races 10%
- Hispanic origin (detail)
- Mexican 7%
- Common ancestry
- Lithuanian 2% Slovak 1% Italian 1%
- Foreign-born
- 21% · Canada, China, Vietnam
- Languages at home
- 73% English-only · Other Asian/Pacific 8% Spanish 7% Other Indo-European 5%
Political lean MEDSL · Fort Bend
- 2024 margin
- Toss-up / Even · D 49.5% · R 47.9% · Other 2.6%
- 2008→2024 swing
- +4.0pp toward D · 2008: -2.4pp · 2024: 1.6pp
- All cycles
- 2024: D+1.6 2020: D+10.6 2016: D+6.6 2012: R+6.8 2008: R+2.4
Not yet ingested
- Civics
- —
Market trends
- HPI YoY
- ▼ -1.67%
- Current HPI
- 212.3573
- Rent YoY
- ▼ -0.15%
- Metro
- Houston-The Woodlands-Sugar Land, TX
- State GDP YoY
- ▲ 3.95%
- F500 in state
- 110
Industry mix (Fortune 500 HQ in TX)
| Industry | F500 HQs | Revenue |
|---|---|---|
| Energy | 16 | $1,198B |
|
||
| Technology | 5 | $198B |
|
||
| Engineering / Construction | 4 | $72B |
|
||
| Energy Services | 3 | $60B |
|
||
| Utilities | 3 | $41B |
|
||
| Healthcare | 2 | $330B |
|
||
Price history
2 events — show timeline
- 2026-02-12 Listed $260,000 HARMLS
- 2006-09-18 Sold (Public Records) — Public Records
Property tax history
+4.3%/yrLatest (2025): $4,844 · +1.6% YoY. Source: county tax records.
Cash-flow waterfall
monthlySold comps — $/sqft
last 12 mo · ≤1 miLoading sold comps…