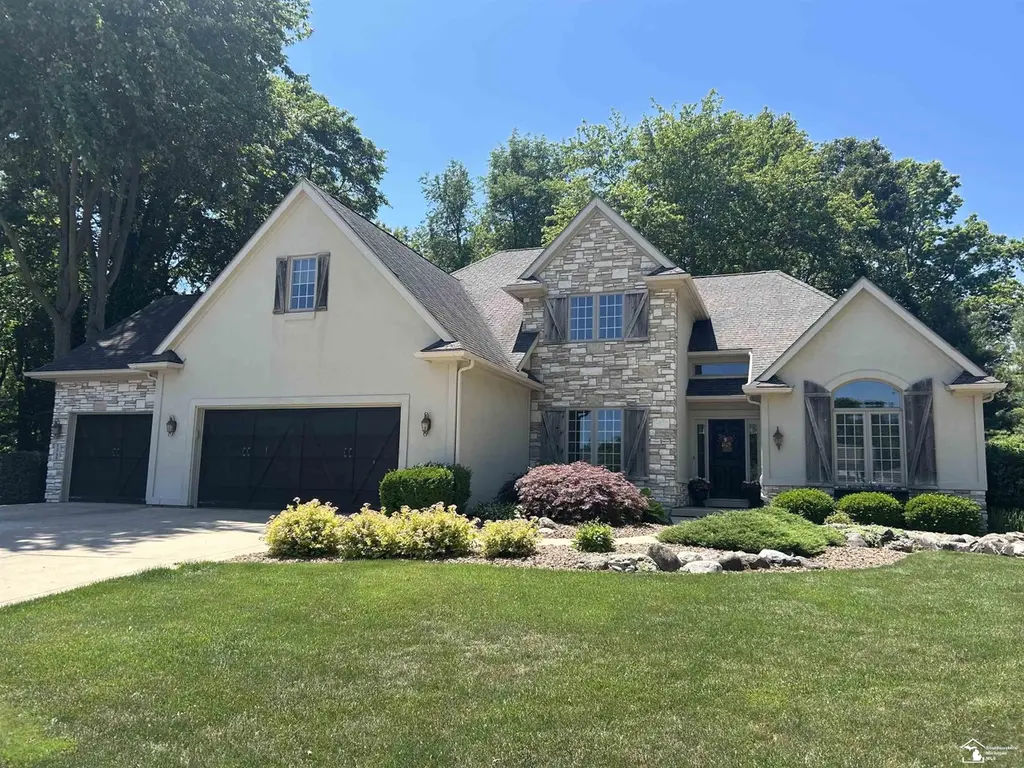
1345 Logans Run St · Temperance, MI
Flood risk 1/10 · Minimal
- FEMA flood zone
- X (unshaded)
- Chance of flooding over 30 yrs
- 0.0%
- Est. flood insurance / yr
- $473 – $860
Fire risk 1/10 · Minimal
- Est. fire insurance / yr
- $784 – $1,456
Heat risk 3/10 · Minor
- Hot days now (above 102°F)
- 7 days/yr
- Hot days in 30 yrs
- 16 days/yr
Wind risk 2/10 · Minimal
- Chance of severe wind over 30 yrs
- —
Air-quality risk 2/10 · Minimal
- Unhealthy air days now
- 1 days/yr
- Unhealthy air days in 30 yrs
- 3 days/yr
Risk factors via First Street. Map © Google.
Why this score? — see what drove the C- grade
The composite is a weighted blend of 9 inputs, each scored 0–100. Each bar is that input's sub-score; the figure is the points it added to the 100-point composite (weight × sub-score).
- Cash flow +26.7/30.0
- DSCR +9.2/10.0
- 1% rule +6.0/10.0
- Schools +3.8/10.0
- Livability +3.6/5.0
- Rent growth +2.5/5.0
- Condition / age +2.5/5.0
- ARV discount +0.0/15.0
- Appreciation +0.0/10.0
$544,900
🖨 Deal sheet 📄 Offer letter ✓ Due diligence
Listing remarks MLS
Welcome home to this stunning 1 1/2 story residence nestled on a quiet cut de sac and was formerly featured as a Parade Of Homes Showcase! From the moment you step inside, you'll appreciate the exceptional craftsmanship and timeless design throughout. The Beautiful Tuscan inspired kitchen features a large island, bay windows, skylight that fills the space with natural light. Gorgeous Australian Cypress hardwood flooring in the kitchen and throughout out the main level adding warmth and character. The inviting family room boasts soaring vaulted ceilings and a stunning stone gas fireplace with plenty of space for gatherings. Enjoy the first floor suite with elegant tray ceiling and luxurious ensuite bath featuring dbl vanities a stand alone garden tub and separate shower. Upstairs, 3 generous sizes bedrooms, a bonus room with charm and a cozy window seat perfect for relaxing or reading. This home is situated on . 42 acres, the beautiful landscape grounds create your own private oasis. Enjoy peaceful evenings on the patio surrounded by mature landscaping and serene outdoor space. A storage shed provides extra room for equipment. Enjoy the 3 car garage. The basement is partially finished that gives you endless possibilities. It's already plumbed for an additional bathroom. This exceptional home combines elegance, comfort and functionality in a desirable setting. Don't miss your opportunity to make it yours!
Key facts
- Large island
- Bay windows
- Stone gas fireplace
Tags
Property features AI
Finance
- HOA & community: Homeowners association
Exterior
- Parking: Attached garage with approximately 3.5 spaces
- Utilities: Public water; Public sewer
- Home design: Single-family residence; One and one-half story
- Construction: Brick, stone, and stucco exterior
- Exterior features: Deck; Cul-de-sac lot
Interior
- Kitchen: Dishwasher; Disposal; Microwave; Oven; Range; Refrigerator; Gas water heater
- Bedrooms: Total of 8 rooms (includes bedrooms and living spaces)
- Bathrooms: Two full bathrooms; One half bathroom
- Heating & cooling: Forced air heating (natural gas); Central air conditioning; Ceiling fans
- Interior features: Bay windows; Gas fireplace in the family room; Finished basement
Neighborhood map
What this means for you Summary
Snapshot
- This is a 4-bed/2.5-bath single-family listed at $545k.
Deal economics
- At list price, monthly cash flow is $1k ($18k/yr) — positive.
- The deal already cash-flows at list — no discount required.
- Meets the 1% rule at list price ($6k rent vs $545k).
Location & tenants
- Location reads 72/100 on livability (#229 in MI) — a middle-class / working-renter tenant base. Strengths: employment A+, cost of living A+, housing A+; Watch: amenities F, commute F, health & safety F.
- Bedford Public Schools (suburban): math 33% / reading 53% proficiency, ranked #150 of 540 in MI (top 28%) — families likely to look elsewhere, expect single-tenant / working-renter base with shorter leases; only 18% free/reduced lunch — higher-income household profile.
- Market conditions: 79 active listings in the ZIP; 1 comparable units currently listed for rent nearby; solid renter incomes; 264 units permitted in Monroe County in 2024 (40 in 5+ unit buildings).
- At $5,995/mo this rent would consume 87% of the median local household income ($83k/yr) — very limited rent-growth headroom before tenants either downsize or default.
Forward outlook
- Local home prices are declining (-3.0%/yr); year-one equity from $4k of loan paydown is wiped out by about $16k of value loss. Plan a longer hold.
- Monroe County population projected at -20% by 2050 — secular population decline; favor cash flow + early exit over multi-decade hold.
- At projected returns (-3.0% appreciation + 3.0% rent growth), your $153k cash investment doubles in ~10 years — after that, you're playing with house money.
Negotiation context
- Only 5 days on market — expect competitive offers; lowballing is unlikely to land.
- 5 sale attempts since 21y ago with the ask held roughly flat each time — persistent listings suggest the price (not the market) is what's stuck; bring a comps-based counter.
- Current owner paid $375k; 45% above their basis — modest negotiation headroom, anchor on the comps not their cost.
Questions for the listing agent
- Is there a deadline driving the sale (1031 exchange, divorce, estate, relocation)? That informs how much negotiation room exists.
- What's the average days-on-market for RENTAL listings here right now (not sales)? A rising rental-DOM trend means longer vacancies and softer asking-rent achievability than the comps imply.
- What's the recent tenant-quality profile in this submarket — average credit score on applications, eviction rate, late-payment / NSF rate, and stable-employment percentage? A property-management company in the area should have these aggregated.
- How much new for-sale + rental construction is in the pipeline within 1–3 miles? Heavy new supply typically softens prices + rents 12–24 months out; constrained supply supports both.
Investment metrics
- 1% rule
- 1.10% ✓
- Cap rate
- 9.54%
- Cash-on-cash
- 11.61%
- DSCR
- 1.52
- GRM
- 7.6
CMA / ARV
- ARV (on-the-fly)
- $466,100
- Comps found
- 4
Show comp detail 4 sales within ~0.75 mi
| Address | Dist | Beds/Ba | Sqft | Sold | Price | $/sf | Match |
|---|---|---|---|---|---|---|---|
| 1455 Pearl Dr | 0.17mi | 4/2.5 | 2,940 (-0%) | 22mo | $517,500 | $176 | 73 |
| 1461 W Temperance Rd | 0.21mi | 5/2.0 (+1) | 2,792 (-5%) | 5mo | $279,000 | $100 | 70 |
| 9200 Valetta Dr | 0.21mi | 3/2.5 (-1) | 2,820 (-4%) | 19mo | $445,000 | $158 | 62 |
| 607 Webber Dr | 0.73mi | 4/2.5 | 3,233 (+10%) | 20mo | $405,000 | $125 | 33 |
Match score weights: distance 35% · size 25% · config 20% · recency 20%. Top-matched comps best support the ARV.
Projected returns pro-forma
-3.0% appreciation · 3.0% rent growth · sell at horizon
- IRR
- 0.9%
- Equity multiple
- 1.04×
- Total profit
- $5,469
- Equity at exit
- $81,246
- IRR
- 10.5%
- Equity multiple
- 1.82×
- Total profit
- $124,891
- Equity at exit
- $47,113
Cash invested: $152,572 (down + closing). Projections, not guarantees.
Landlord ↔ Tenant lean methodology
- Overall (STATE)
- 62 Landlord-Friendly
- State Michigan
- 62 Landlord-Friendly · EVEN
- County
- — inherits STATE
- City
- — inherits STATE
ZIP-level market 48182
- Active inventory
- 79
- Price-to-rent
- 7.6×
Monthly cashflow live
- Estimated rent
- $5,995 medium interval (Pro) →
- Mortgage (P&I)
- −$2,858
- Tax from tax record
- −$176 /mo · $2,110/yr
- Insurance
- −$227
- HOA
- −$0
- Vacancy / Maint / Mgmt
- −$1,259
- Net cashflow
- $1,476
Break-even live
UW: 25.0% down · 7.5% · 30yr · 1.5% tax · 5.0% vac · 8.0% maint · 8.0% mgmt
Financing live
Cash to close
- Down payment
- $136,225
- Closing costs
- $16,347
- Reserves months
- —
- Total cash needed
- —
Loan-product check · same deal, 3 products live
Conventional
25% down · 7.5% · 30yr
- Down + closing
- —
- Monthly P&I
- —
- Monthly cashflow
- —
- DSCR
- —
- Eligible?
- —
Personal DTI + credit; lowest rate.
DSCR
20% down · 8.5% · 30yr
- Down + closing
- —
- Monthly P&I
- —
- Monthly cashflow
- —
- DSCR
- —
- Eligible?
- —
No personal income docs; deal must DSCR.
Hard money
10% down · 12.0% · 12mo
- Down + closing
- —
- Monthly P&I
- —
- Monthly cashflow
- —
- DSCR
- —
- Eligible?
- —
Short-term bridge; refi at stabilization.
Rent comps 1 comps
| Address | Beds | Baths | Sqft | Rent | $/sqft | DOM | Units | Dist |
|---|---|---|---|---|---|---|---|---|
| 1379 Castlebury Dr Temperance, MI | 5.0 | 3.5 | 3392 | $5,995 | $1.77 | 13d | 1 | 0.26mi |
Listing history 5 events
-
2026-06-14statusdays on market $544,900 Pending 5 DOM
-
2026-06-10days on market $544,900 Active 3 DOM
-
2026-06-09days on market $544,900 Active 2 DOM
-
2026-06-08remarks 699-char remark
-
2026-06-08$544,900 Active 1 DOM
ⓘ Source: listings_history table (triggers on properties + properties_extension) + one-shot
backfill from property_details.listing_events for pre-trigger history.
Tax reassessment forecast MI · Partial reset (capped growth)
- Current annual tax
- $2,110 · $176/mo
- Projected year-2 tax
- $5,251 · $438/mo
- Expected delta
- +$3,141/yr (+$262/mo · 148.9%)
ⓘ Screening estimate from a state-policy table — verify with the county assessor before closing.
Climate risk First Street
- Flood 1/10 Low FEMA zone X (unshaded) · 0% chance over 30 yrs
- Wildfire 1/10 Low
- Heat 3/10 Moderate 7 d/yr ≥102°F today · 16 d/yr by 30 yrs out
- Wind 2/10 Low
- Air quality 2/10 Low 1 unhealthy d/yr today · 3 by 30 yrs out
Nearby sold comps map
Loading sold comps map…
Walkable amenities ~0.75 mi
Loading nearby amenities…
Taxation est. · year 1
- Rental income
- $71,940
- − Mortgage interest
- −$30,523
- − Property taxes
- −$2,110
- − Insurance
- −$2,724
- − Repairs & maintenance
- −$5,755
- − Management
- −$5,755
- − Depreciation
- −$15,852
- Taxable income
- $9,221
- Est. tax owed @ 24.0%
- −$2,213
- After-tax cash flow
- $15,495/yr
For passive investors: Depreciation is non-cash, so a rental often shows a tax loss while cash-flowing — sheltering income. Rental losses are passive: they offset passive income freely, and up to $25,000/yr can offset ordinary (W-2) income if you actively participate and your MAGI is under $100k (phasing out to $0 by $150k); unused losses carry forward. On sale, claimed depreciation is recaptured at up to 25%, and gains may owe capital-gains tax (a 1031 exchange can defer both). Figures are a year-1 estimate at your 24.0% rate — not tax advice; consult a CPA.
Schools (NCES district)
- District
- Bedford Public Schools
- NCES district ID
- 2604470
- Math proficiency
- 33% ▼ -14.00%
- Reading proficiency
- 53% ▼ -3.00%
- Median HH income
- $63,784
- Composite
- 38.22/100
- National rank
- #4252
- State rank
- #150 of 540 in MI
Livability — Temperance
- Score
- 72/100
- State rank
- #229
- US rank
- #5788
Category grades
Schools grade is shown separately in the Schools card above.
Census & demographics
- Census place
- Temperance, MI
- County
- Monroe · 31,363 people
- City population
- 20,705
- Metro
- Monroe, MI
- Population (ZIP)
- 20,705
- Household income
- $83,155
- Rent vs Own
- Severe rent burden
- 12.7
Population outlook (Monroe County) Hauer SSP2
- Today (2025)
- 144,439 people
- By 2030
- 140,033 · -3.1%
- By 2040
- 128,408 · -11.1%
- By 2050
- 115,024 · -20.4%
- By 2075
- 87,273 · -39.6%
- By 2100
- 63,110 · -56.3%
Race, ethnicity, and origin ACS 2023
- Neighborhood character
- Predominantly White (90%)
- Race & ethnicity
- White 90% Hispanic / Latino 6% Two or more races 5% Black 1%
- Hispanic origin (detail)
- Mexican 4%
- Common ancestry
- Romanian 14% Lithuanian 4% Italian 3%
- Foreign-born
- 2% · Canada
- Languages at home
- 97% English-only · Spanish 2% Other Indo-European 1%
Political lean MEDSL · Monroe
- 2024 margin
- Strong R (+27.1) · D 35.7% · R 62.9% · Other 1.4%
- 2008→2024 swing
- -31.5pp toward R · 2008: 4.3pp · 2024: -27.1pp
- All cycles
- 2024: R+27.1 2020: R+22.6 2016: R+22.1 2012: D+1.0 2008: D+4.3
Not yet ingested
- Civics
- —
Market trends
- HPI YoY
- ▼ -140.99%
- Current HPI
- 158.2484
- Rent YoY
- —
- Metro
- —
- State GDP YoY
- ▲ 1.37%
- F500 in state
- 28
Industry mix (Fortune 500 HQ in MI)
| Industry | F500 HQs | Revenue |
|---|---|---|
| Automotive Parts | 3 | $48B |
|
||
| Automotive | 2 | $372B |
|
||
| Chemicals | 1 | $45B |
|
||
| Automotive Retail | 1 | $29B |
|
||
| Healthcare / Medical Devices | 1 | $23B |
|
||
| Automotive Technology | 1 | $20B |
|
||
Price history
+45.3% since first listed10 events — show timeline
- 2026-06-08 Listed $544,900 REALCOMP
- 2026-06-07 Listed $544,900 MiRealSource-MiMLS
- 2005-10-20 Sold (Public Records) $374,900 Public Records
- 2005-10-14 Sold (MLS) $374,900 REALCOMP
- 2005-10-14 Sold (MLS) $374,900 MiRealSource-MiMLS
- 2005-10-14 Sold (MLS) $374,900 REALCOMP
- 2005-09-22 Listing Removed — MiRealSource-MiMLS
- 2005-08-05 Listed $374,900 MiRealSource-MiMLS
- 2005-08-05 Listed $374,900 REALCOMP
- 2005-07-14 Listed $374,900 REALCOMP
Property tax history
-4.3%/yrLatest (2025): $2,110 · -57.8% YoY. Source: county tax records.
Cash-flow waterfall
monthlySold comps — $/sqft
last 12 mo · ≤1 miLoading sold comps…