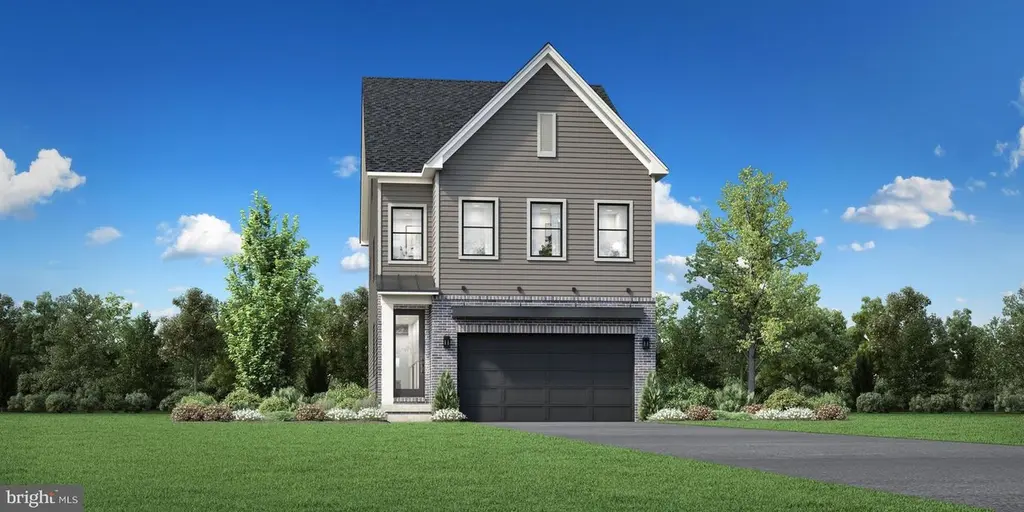
23241 Gallatin Grove Dr · Brambleton, VA
Flood risk 1/10 · Minimal
- FEMA flood zone
- X (unshaded)
- Chance of flooding over 30 yrs
- 0.0%
- Est. flood insurance / yr
- $507 – $1,088
Fire risk 4/10 · Minor
- Est. fire insurance / yr
- $666 – $1,236
Heat risk 6/10 · Moderate
- Hot days now (above 103°F)
- 7 days/yr
- Hot days in 30 yrs
- 16 days/yr
Wind risk 4/10 · Minor
- Chance of severe wind over 30 yrs
- 8.0%
Air-quality risk 2/10 · Minimal
- Unhealthy air days now
- 1 days/yr
- Unhealthy air days in 30 yrs
- 1 days/yr
Risk factors via First Street. Map © Google.
Why this score? — see what drove the D- grade
The composite is a weighted blend of 9 inputs, each scored 0–100. Each bar is that input's sub-score; the figure is the points it added to the 100-point composite (weight × sub-score).
- ARV discount +13.6/15.0
- Appreciation +7.5/10.0
- Schools +6.7/10.0
- Livability +3.6/5.0
- Rent growth +2.5/5.0
- Condition / age +2.5/5.0
- Cash flow +2.4/30.0
- 1% rule +0.0/10.0
- DSCR +0.0/10.0
$964,995
🖨 Deal sheet 📄 Offer letter ✓ Due diligence
Listing remarks MLS
The Gifford home design blends comfort and luxury across three levels with a partially finished daylight basement that adds extra living and entertaining space. The main floor features an open-concept layout with a spacious great room, casual dining area, and a gourmet kitchen with a center island, breakfast bar, and walk-in pantry. Upstairs, the primary suite offers a relaxing retreat with a large walk-in closet and a spa-like bath with dual vanities and a premium shower. Additional bedrooms, a two-car garage, and multiple entertaining zones throughout the home provide both functionality and versatility.
Key facts
- Spa-like bath
- Primary suite
- Gourmet kitchen
Tags
Neighborhood map
What this means for you Summary
Snapshot
- This is a 4-bed/3.5-bath single-family listed at $965k.
Deal economics
- At list price, monthly cash flow is $-3k ($-41k/yr) — negative.
- To cash-flow at today's rent, offer at most $474k (50.9% below list).
- To meet the 1% rule (rent ≥ 1% of price), the offer needs to be $432k (55.3% below list).
- Recommended offer: $432k (55.3% below list) — sets the bar for 1% rule.
Location & tenants
- Location reads 71/100 on livability (#214 in VA) — a middle-class / working-renter tenant base. Strengths: crime A+, employment A+, housing A+; Watch: amenities D-, commute F, cost of living F.
- Loudoun County Public School District (suburban): math 64% / reading 79% proficiency, ranked #7 of 131 in VA (top 5%) — strong family-tenant draw, lease renewals of 3-5y typical; only 12% free/reduced lunch — higher-income household profile.
- Market conditions: 174 active listings in the ZIP; 8 comparable units currently listed for rent nearby; rentals at typical pace (median 24d on market — plan ~3-4 weeks tenant-placement turnaround); high-income renter base; 3,317 units permitted in Loudoun County in 2024 (1,818 in 5+ unit buildings).
Forward outlook
- In year one you build about $55k of equity ($7k loan paydown + $48k appreciation (5.0% local appreciation)).
- Loudoun County population projected at +65% by 2050 — long-run rental-demand tailwind backs the buy-and-hold thesis.
- By year 2, paydown + projected appreciation supports a ~$88k cash-out refi (75% LTV) — recoverable capital for the next deal without selling this one.
Negotiation context
- It's been on market 35 days — a 3% lower offer ($936k) is reasonable based on typical stale-listing flexibility.
Risks & watch-outs
- Climate carrying-cost: extreme-heat days projected 7→16/yr by 2055 (HVAC capex compounding) — expect insurance premiums to compound above CPI over the hold.
Questions for the listing agent
- What do current leases actually rent for vs. the listed asking? Can we see a recent rent roll and the last 12 months of T-12 income?
- It's been on market 35 days. Have you received any prior offers? Is the seller open to a 55% concession, seller financing, or rate buy-down credit?
- What does the HOA fee cover, when was the last increase, and are there any pending special assessments or reserve-fund shortfalls?
- Is there a deadline driving the sale (1031 exchange, divorce, estate, relocation)? That informs how much negotiation room exists.
- Schools are A-rated — typically a magnet for longer-tenancy family renters. What's the average tenant stay here, and is there a school-zone premium baked into asking?
- The area grade is low — what's the realistic commute time and amenity access for the typical tenant pool here? Any planned neighborhood developments (good or bad) we should know about?
- What's the average days-on-market for RENTAL listings here right now (not sales)? A rising rental-DOM trend means longer vacancies and softer asking-rent achievability than the comps imply.
- What's the recent tenant-quality profile in this submarket — average credit score on applications, eviction rate, late-payment / NSF rate, and stable-employment percentage? A property-management company in the area should have these aggregated.
- How much new for-sale + rental construction is in the pipeline within 1–3 miles? Heavy new supply typically softens prices + rents 12–24 months out; constrained supply supports both.
Investment metrics
- 1% rule
- 0.45% ✗
- Cap rate
- 2.07%
- Cash-on-cash
- -15.07%
- DSCR
- 0.33
- GRM
- 18.6
CMA / ARV
- ARV (median comp)
- $1,115,851
- List price
- $964,995
- Delta
- -13.52%
- Verdict
- UNDERPRICED
- Comps
- 20 within 1.0 mi
Show comp detail 2 sales within ~0.75 mi
| Address | Dist | Beds/Ba | Sqft | Sold | Price | $/sf | Match |
|---|---|---|---|---|---|---|---|
| 41684 Carefree Ct | 0.31mi | 5/4.5 (+1) | 3,360 (+15%) | 8mo | $1,075,000 | $320 | 46 |
| 23003 Glenwood Heights Cir | 0.62mi | 5/3.0 (+1) | 2,832 (-3%) | 22mo | $992,000 | $350 | 40 |
Match score weights: distance 35% · size 25% · config 20% · recency 20%. Top-matched comps best support the ARV.
Projected returns pro-forma
4.98% appreciation · 3.0% rent growth · sell at horizon
- IRR
- 0.3%
- Equity multiple
- 1.02×
- Total profit
- $5,086
- Equity at exit
- $545,361
- IRR
- 3.9%
- Equity multiple
- 1.75×
- Total profit
- $203,331
- Equity at exit
- $939,991
Cash invested: $270,199 (down + closing). Projections, not guarantees.
Landlord ↔ Tenant lean methodology
- Overall (STATE)
- 55 Moderately Landlord-Leaning
- State Virginia
- 55 Moderately Landlord-Leaning · D+2
- County
- — inherits STATE
- City
- — inherits STATE
ZIP-level market 20105
- Home prices YoY
- 1.5%
- Active inventory
- 174
- Price-to-rent
- 18.6×
Monthly cashflow live
- Estimated rent
- $4,318 high interval (Pro) →
- Mortgage (P&I)
- −$5,061
- Tax est. 1.5%
- −$1,206 /mo · $14,475/yr
- Insurance
- −$402
- HOA
- −$135
- Vacancy / Maint / Mgmt
- −$907
- Net cashflow
- $-3,393
Break-even live
UW: 25.0% down · 7.5% · 30yr · 1.5% tax · 5.0% vac · 8.0% maint · 8.0% mgmt
Financing live
Cash to close
- Down payment
- $241,249
- Closing costs
- $28,950
- Reserves months
- —
- Total cash needed
- —
Loan-product check · same deal, 3 products live
Conventional
25% down · 7.5% · 30yr
- Down + closing
- —
- Monthly P&I
- —
- Monthly cashflow
- —
- DSCR
- —
- Eligible?
- —
Personal DTI + credit; lowest rate.
DSCR
20% down · 8.5% · 30yr
- Down + closing
- —
- Monthly P&I
- —
- Monthly cashflow
- —
- DSCR
- —
- Eligible?
- —
No personal income docs; deal must DSCR.
Hard money
10% down · 12.0% · 12mo
- Down + closing
- —
- Monthly P&I
- —
- Monthly cashflow
- —
- DSCR
- —
- Eligible?
- —
Short-term bridge; refi at stabilization.
Rent comps 8 comps
| Address | Beds | Baths | Sqft | Rent | $/sqft | DOM | Units | Dist |
|---|---|---|---|---|---|---|---|---|
| 41935 Spring Air Dr Brambleton, VA | 5.0 | 4.0 | 4104 | $4,900 | $1.19 | 43d | 1 | 0.66mi |
| 23335 Tradewind Dr Brambleton, VA | 3.0 | 3.5 | 3182 | $3,900 | $1.23 | 4d | 1 | 0.88mi |
| 42171 Castle Ridge Sq Brambleton, VA | 3.0 | 3.5 | 2846 | $3,899 | $1.37 | 24d | 1 | 0.91mi |
| 42230 Castle Ridge Sq Brambleton, VA | 3.0 | 3.5 | 2846 | $3,799 | $1.33 | 43d | 1 | 0.96mi |
| 42281 Belgrave Gardens Ter Brambleton, VA | 4.0 | 3.5 | 3232 | $4,200 | $1.30 | 5d | 1 | 1.12mi |
| 22810 Tawny Pine Sq Brambleton, VA | 5.0 | 4.5 | 2740 | $5,199 | $1.90 | 24d | 1 | 1.14mi |
| 22806 Breezy Hollow Dr Brambleton, VA | 4.0 | 3.5 | 3044 | $3,800 | $1.25 | 5d | 1 | 1.29mi |
| 42449 Malachite Ter Brambleton, VA | 3.0 | 3.5 | 2000 | $3,295 | $1.65 | 43d | 1 | 1.45mi |
HOA detail
- Monthly dues
- $135 · $1,620/yr
Listing history 1 events
-
2026-04-16$964,995 Active 612-char remark
Show marketing remark (612 chars)
The Gifford home design blends comfort and luxury across three levels with a partially finished daylight basement that adds extra living and entertaining space. The main floor features an open-concept layout with a spacious great room, casual dining area, and a gourmet kitchen with a center island, breakfast bar, and walk-in pantry. Upstairs, the primary suite offers a relaxing retreat with a large walk-in closet and a spa-like bath with dual vanities and a premium shower. Additional bedrooms, a two-car garage, and multiple entertaining zones throughout the home provide both functionality and versatility.
ⓘ Source: listings_history table (triggers on properties + properties_extension) + one-shot
backfill from property_details.listing_events for pre-trigger history.
Climate risk First Street
- Flood 1/10 Low FEMA zone X (unshaded) · 0% chance over 30 yrs
- Wildfire 4/10 Moderate
- Heat 6/10 Major 7 d/yr ≥103°F today · 16 d/yr by 30 yrs out
- Wind 4/10 Moderate 8% chance of damaging wind over 30 yrs
- Air quality 2/10 Low 1 unhealthy d/yr today · 1 by 30 yrs out
Nearby sold comps map
Loading sold comps map…
Walkable amenities ~0.75 mi
Loading nearby amenities…
Taxation est. · year 1
- Rental income
- $51,816
- − Mortgage interest
- −$54,055
- − Property taxes
- −$14,475
- − Insurance
- −$4,825
- − Repairs & maintenance
- −$4,145
- − Management
- −$4,145
- − HOA
- −$1,620
- − Depreciation
- −$28,073
- Taxable loss
- −$59,522
- Est. tax savings @ 24.0%
- +$14,285
- After-tax cash flow
- $-26,427/yr
For passive investors: Depreciation is non-cash, so a rental often shows a tax loss while cash-flowing — sheltering income. Rental losses are passive: they offset passive income freely, and up to $25,000/yr can offset ordinary (W-2) income if you actively participate and your MAGI is under $100k (phasing out to $0 by $150k); unused losses carry forward. On sale, claimed depreciation is recaptured at up to 25%, and gains may owe capital-gains tax (a 1031 exchange can defer both). Figures are a year-1 estimate at your 24.0% rate — not tax advice; consult a CPA.
Schools (NCES district)
- District
- Loudoun County Public School District
- NCES district ID
- 5102250
- Math proficiency
- 64% ▼ -22.00%
- Reading proficiency
- 79% ▼ -5.00%
- Median HH income
- $121,927
- Composite
- 67.43/100
- National rank
- #379
- State rank
- #7 of 131 in VA
Livability — Brambleton
- Score
- 71/100
- State rank
- #214
- US rank
- #6915
Category grades
Schools grade is shown separately in the Schools card above.
Census & demographics
- County
- Loudoun County · 393,062 people
- City population
- 63,615
- Metro
- Washington-Arlington-Alexandria, DC-VA-MD-WV
- Population (ZIP)
- 37,639
- Household income
- $219,123
- Rent vs Own
- Severe rent burden
- 49.0
Population outlook (Loudoun County) Hauer SSP2
- Today (2025)
- 503,590 people
- By 2030
- 568,852 · +13.0%
- By 2040
- 701,480 · +39.3%
- By 2050
- 828,841 · +64.6%
- By 2075
- 1,105,645 · +119.6%
- By 2100
- 1,265,472 · +151.3%
Race, ethnicity, and origin ACS 2023
- Neighborhood character
- Diverse neighborhood (Simpson 0.69)
- Race & ethnicity
- White 45% Asian 31% Black 11% Two or more races 9% Hispanic / Latino 7%
- Hispanic origin (detail)
- Mexican 1%
- Common ancestry
- Romanian 3% Italian 2% Serbian 1%
- Foreign-born
- 30% · Canada, South Korea, China
- Languages at home
- 63% English-only · Other Indo-European 14% Other Asian/Pacific 9% Spanish 5%
Political lean MEDSL · Loudoun
- 2024 margin
- D (+16.3) · D 56.6% · R 40.4% · Other 3.0%
- 2008→2024 swing
- +8.0pp toward D · 2008: 8.2pp · 2024: 16.3pp
- All cycles
- 2024: D+16.3 2020: D+25.0 2016: D+16.8 2012: D+4.5 2008: D+8.2
Not yet ingested
- Civics
- —
Market trends
- HPI YoY
- ▲ 4.98%
- Current HPI
- 344.3873
- Rent YoY
- —
- Metro
- Washington-Arlington-Alexandria, DC-VA-MD-WV
- State GDP YoY
- ▲ 2.40%
- F500 in state
- 50
Industry mix (Fortune 500 HQ in VA)
| Industry | F500 HQs | Revenue |
|---|---|---|
| Aerospace / Defense | 4 | $236B |
|
||
| Technology / Defense | 3 | $32B |
|
||
| Financial Services | 2 | $176B |
|
||
| Utilities | 2 | $27B |
|
||
| Insurance | 2 | $25B |
|
||
| Technology | 2 | $15B |
|
||
Price history
1 event — show timeline
- 2026-04-16 Listed $964,995 BRIGHT MLS
Cash-flow waterfall
monthlySold comps — $/sqft
last 12 mo · ≤1 miLoading sold comps…