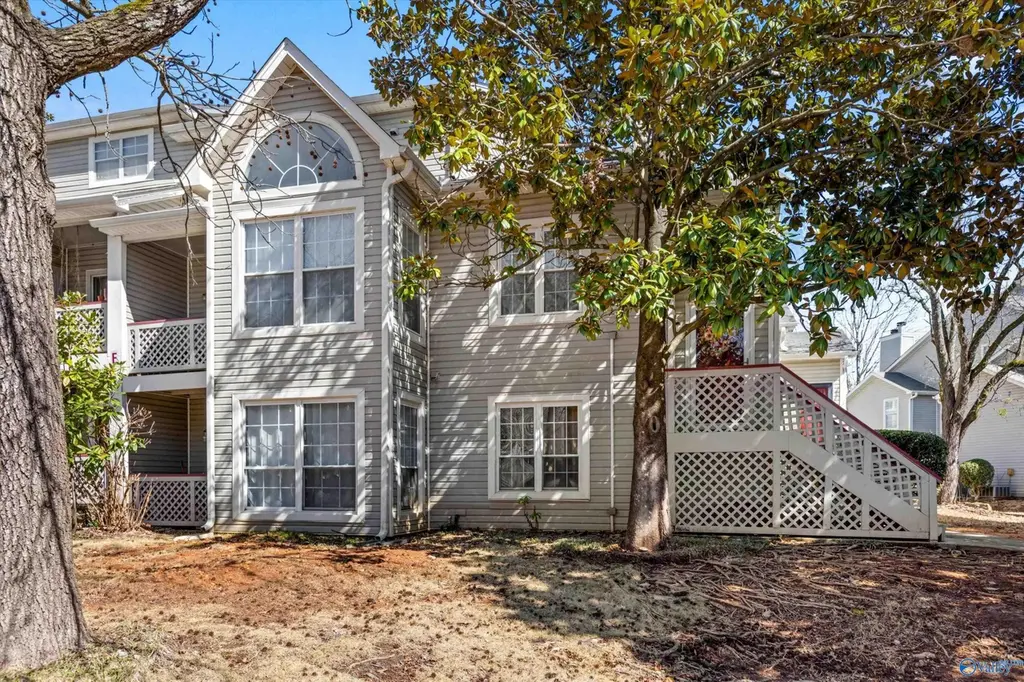
1039 Stones Throw Dr NW #5 · Huntsville, AL
Flood risk 1/10 · Minimal
- FEMA flood zone
- X (unshaded)
- Chance of flooding over 30 yrs
- 0.0%
- Est. flood insurance / yr
- $507 – $1,088
Fire risk 1/10 · Minimal
- Est. fire insurance / yr
- $916 – $1,700
Heat risk 6/10 · Moderate
- Hot days now (above 105°F)
- 7 days/yr
- Hot days in 30 yrs
- 19 days/yr
Wind risk 4/10 · Minor
- Chance of severe wind over 30 yrs
- 16.0%
Air-quality risk 2/10 · Minimal
- Unhealthy air days now
- 0 days/yr
- Unhealthy air days in 30 yrs
- 2 days/yr
Risk factors via First Street. Map © Google.
Why this score? — see what drove the D grade
The composite is a weighted blend of 9 inputs, each scored 0–100. Each bar is that input's sub-score; the figure is the points it added to the 100-point composite (weight × sub-score).
- ARV discount +13.2/15.0
- Appreciation +10.0/10.0
- Cash flow +5.0/30.0
- Livability +4.1/5.0
- Rent growth +3.1/5.0
- Schools +2.9/10.0
- Condition / age +2.5/5.0
- 1% rule +2.3/10.0
- DSCR +0.0/10.0
$189,900
🖨 Deal sheet (PDF) 📄 Offer letter ✓ Due diligence
Listing remarks MLS
Welcome to 1039 Stones Throw Condo. Conveniently located to all that Mid City has to offer, Research Park and Bridge Street. Updated 2 Bedroom end Unit is waiting for you. Fresh paint, laminate flooring, Updated cabinets and counter tops. Master located on the main floor. Relax on your deck or around the community pool. Google Fiber is available.
Key facts
- Updated cabinets
- Community pool
- End unit
Tags
Neighborhood map
What this means for you Summary
Snapshot
- This is a 2-bed/2.0-bath condo listed at $190k.
Deal economics
- At list price, monthly cash flow is $-445 ($-5k/yr) — negative.
- To cash-flow at today's rent, offer at most $126k (33.9% below list).
- To meet the 1% rule (rent ≥ 1% of price), the offer needs to be $139k (26.9% below list).
- Recommended offer: $126k (33.9% below list) — sets the bar for cash-flow.
Location & tenants
- Location reads 82/100 on livability (#3 in AL, #1,082 nationally) — a professional / high-income tenant draw. Strengths: commute A+, cost of living A+, housing A+; Watch: crime F.
- Huntsville City (urban): math 21% / reading 46% proficiency, ranked #48 of 129 in AL (top 37%) — families likely to look elsewhere, expect single-tenant / working-renter base with shorter leases.
- Zoned schools: Providence Elementary (math 14% / reading 42%, grade F, #385 of 627 statewide, top 62%, 848 students, 52% FRL); Williams Middle School (math 16% / reading 50%, grade F, #101 of 257 statewide, top 40%, 548 students, 58% FRL); Columbia High School (math 12% / reading 17%, grade F, #220 of 305 statewide, top 77%, 954 students, 50% FRL).
- Market conditions: Rents rising (+2.6%/yr); 216 active listings in the ZIP; 40 comparable units currently listed for rent nearby; rentals at typical pace (median 16d on market — plan ~3-4 weeks tenant-placement turnaround); solid renter incomes; 4,709 units permitted in Madison County in 2024 (1,186 in 5+ unit buildings).
Forward outlook
- In year one you build about $20k of equity ($1k loan paydown + $19k appreciation (10.0% local appreciation)).
- Madison County population projected at +18% by 2050 — long-run rental-demand tailwind backs the buy-and-hold thesis.
- By year 2, paydown + projected appreciation supports a ~$33k cash-out refi (75% LTV) — recoverable capital for the next deal without selling this one.
Negotiation context
- It's been on market 112 days — a 9% lower offer ($173k) is reasonable based on typical stale-listing flexibility.
Risks & watch-outs
- Climate carrying-cost: extreme-heat days projected 7→19/yr by 2055 (HVAC capex compounding) — expect insurance premiums to compound above CPI over the hold.
Questions for the listing agent
- What do current leases actually rent for vs. the listed asking? Can we see a recent rent roll and the last 12 months of T-12 income?
- It's been on market 112 days. Have you received any prior offers? Is the seller open to a 34% concession, seller financing, or rate buy-down credit?
- What does the HOA fee cover, when was the last increase, and are there any pending special assessments or reserve-fund shortfalls?
- Any open or pending special assessments — roof, HVAC, plumbing, elevator, façade? What's the per-unit balance and payoff schedule, and is the seller paying it off at close or rolling it to the buyer?
- Why hasn't it sold? Are there any deal-killer items the seller is aware of (foundation, flood, title, zoning, code violations)?
- Is there a deadline driving the sale (1031 exchange, divorce, estate, relocation)? That informs how much negotiation room exists.
- Crime grade is F in this area — have there been break-ins, vandalism, or insurance claims at this property in the last 3 years? What carrier currently insures it and at what premium?
- The area grade is low — what's the realistic commute time and amenity access for the typical tenant pool here? Any planned neighborhood developments (good or bad) we should know about?
- What's the average days-on-market for RENTAL listings here right now (not sales)? A rising rental-DOM trend means longer vacancies and softer asking-rent achievability than the comps imply.
- What's the recent tenant-quality profile in this submarket — average credit score on applications, eviction rate, late-payment / NSF rate, and stable-employment percentage? A property-management company in the area should have these aggregated.
- How much new apartment / multifamily construction is in the pipeline within 1–3 miles? Heavy new supply (>2% of stock underway) typically softens rents 12–24 months out; light construction supports rent growth.
Investment metrics
- 1% rule
- 0.73% ✗
- Cap rate
- 3.48%
- Cash-on-cash
- -10.03%
- DSCR
- 0.55
- GRM
- 11.4
CMA / ARV
- ARV (median comp)
- $217,309
- List price
- $189,900
- Delta
- -12.61%
- Verdict
- UNDERPRICED
- Comps
- 20 within 1.0 mi
Projected returns pro-forma
10.0% appreciation · 2.57% rent growth · sell at horizon
- IRR
- 17.1%
- Equity multiple
- 2.40×
- Total profit
- $74,672
- Equity at exit
- $171,077
- IRR
- 16.2%
- Equity multiple
- 5.54×
- Total profit
- $241,293
- Equity at exit
- $368,934
Cash invested: $53,172 (down + closing). Projections, not guarantees.
Landlord ↔ Tenant lean methodology
- Overall (STATE)
- 90 Strongly Landlord-Friendly
- State Alabama
- 90 Strongly Landlord-Friendly · R+15
- County
- — inherits STATE
- City
- — inherits STATE
ZIP-level market 35806
- Home prices YoY
- 20.0%
- Rents YoY
- 2.6%
- Active inventory
- 216
- Price-to-rent
- 11.4×
Monthly cashflow live
- Estimated rent
- $1,388 high interval (Pro) →
- Mortgage (P&I)
- −$996
- Tax est. 1.5%
- −$237 /mo · $2,848/yr
- Insurance
- −$79
- HOA
- −$229
- Vacancy / Maint / Mgmt
- −$292
- Net cashflow
- $-445
Break-even live
Sensitivity live
| Price | -10% $-313 | -5% $-379 | +0% $-445 | +5% $-510 | +10% $-576 |
|---|---|---|---|---|---|
| Rent | -10% $-554 | -5% $-499 | +0% $-445 | +5% $-390 | +10% $-335 |
| Rate | -1.0pp $-349 | -0.5pp $-396 | base $-445 | +0.5pp $-494 | +1.0pp $-544 |
UW: 25.0% down · 7.5% · 30yr · 1.5% tax · 5.0% vac · 8.0% maint · 8.0% mgmt
Financing live
Cash to close
- Down payment
- $47,475
- Closing costs
- $5,697
- Reserves months
- —
- Total cash needed
- —
Loan-product check · same deal, 3 products live
Conventional
25% down · 7.5% · 30yr
- Down + closing
- —
- Monthly P&I
- —
- Monthly cashflow
- —
- DSCR
- —
- Eligible?
- —
Personal DTI + credit; lowest rate.
DSCR
20% down · 8.5% · 30yr
- Down + closing
- —
- Monthly P&I
- —
- Monthly cashflow
- —
- DSCR
- —
- Eligible?
- —
No personal income docs; deal must DSCR.
Hard money
10% down · 12.0% · 12mo
- Down + closing
- —
- Monthly P&I
- —
- Monthly cashflow
- —
- DSCR
- —
- Eligible?
- —
Short-term bridge; refi at stabilization.
Rent comps 40 comps
| Address | Beds | Baths | Sqft | Rent | $/sqft | DOM | Units | Dist |
|---|---|---|---|---|---|---|---|---|
| 1085 Stones Throw Dr NW Unit 1 Huntsville, AL | 2.0 | 2.0 | 1400 | $1,225 | $0.88 | 45d | 1 | 0.07mi |
| 1002 Stones Throw Dr NW Unit 1 Huntsville, AL | 1.0 | 1.0 | 976 | $1,150 | $1.18 | 45d | 1 | 0.11mi |
| 1155 Old Monrovia Rd NW Unit I Huntsville, AL | 2.0 | 2.0 | 1075 | $1,295 | $1.20 | 15d | 1 | 0.18mi |
| 1060 Sandy Springs Rd NW Huntsville, AL | 3.0 | 2.0 | 1297 | $1,700 | $1.31 | 25d | 1 | 0.18mi |
| 100 Chawston Ave NW Huntsville, AL | 1.0–3.0 | 1.0–2.5 | 1133 | $1,757 | $1.55 | 15d | 31 | 0.20mi |
| 1155 Old Monrovia Rd NW Huntsville, AL | 2.0 | 2.0 | 1050 | $1,246 | $1.19 | 23d | 1 | 0.20mi |
| 1155 Old Monrovia Rd NW Huntsville, AL | 1.0–2.0 | 1.0–2.0 | 950 | $1,300 | $1.37 | 15d | 3 | 0.20mi |
| 925 Makers Way NW Huntsville, AL | 3.0 | 1.0–2.0 | 1072 | $1,967 | $1.83 | 25d | 52 | 0.41mi |
| 1100 Enterprise Way Huntsville, AL | 1.0–3.0 | 1.0–2.0 | 1059 | $1,599 | $1.51 | 15d | 35 | 0.43mi |
| 5810 Stax St NW Huntsville, AL | 3.0 | 1.0–2.0 | 1188 | $2,175 | $1.83 | 15d | 237 | 0.45mi |
| 6644 Willow Pointe Dr NW Unit A Huntsville, AL | 2.0 | 2.0 | 1044 | $1,025 | $0.98 | 15d | 1 | 0.45mi |
| 6170 Kitt Ln NW Huntsville, AL | 1.0–3.0 | 1.0–2.0 | 1031 | $1,360 | $1.32 | 15d | 31 | 0.49mi |
| 1325 Old Monrovia Rd NW Huntsville, AL | 1.0–4.0 | 1.0–2.0 | 1262 | $1,506 | $1.19 | 15d | 23 | 0.58mi |
| 5801 Sanderson St NW Huntsville, AL | 1.0–3.0 | 1.0–2.0 | 1088 | $1,564 | $1.44 | 15d | 14 | 0.62mi |
| 1908 Catchings Dr NW Huntsville, AL | 3.0 | 2.0 | 1196 | $1,295 | $1.08 | 15d | 1 | 0.62mi |
| 6200 Rime Village Dr NW Huntsville, AL | 3.0 | 1.0–2.0 | 1015 | $1,364 | $1.34 | 15d | 45 | 0.71mi |
| 1001 Cernan Dr NW Huntsville, AL | 1.0–3.0 | 1.0–2.5 | 1011 | $1,752 | $1.73 | 15d | 19 | 0.84mi |
| 930 Blue Mound Ln NW Huntsville, AL | 1.0–2.0 | 1.0–2.0 | 967 | $1,640 | $1.70 | 15d | 19 | 0.84mi |
| 4931 Cotton Row NW Unit C Huntsville, AL | 2.0 | 1.5 | 995 | $950 | $0.95 | 45d | 1 | 0.88mi |
| 650 Wynn Dr NW Huntsville, AL | 1.0–2.0 | 1.0–2.0 | 820 | $1,109 | $1.35 | 15d | 2 | 0.93mi |
| 335 Culbertson Dr Huntsville, AL | 1.0–3.0 | 1.0–3.0 | 1008 | $1,942 | $1.93 | 15d | 1 | 0.94mi |
| 5001 Galaxy Way NW Huntsville, AL | 1.0–2.0 | 1.0–2.0 | 796 | $1,099 | $1.38 | 25d | 6 | 0.97mi |
| 5001 7 Pine Cir Unit 1 Huntsville, AL | 2.0 | 2.0 | 1060 | $1,400 | $1.32 | 45d | 1 | 1.04mi |
| 1505 Sparkman Dr NW Huntsville, AL | 2.0–3.0 | 1.5–2.0 | 1150 | $1,069 | $0.93 | 23d | 4 | 1.05mi |
| 1535 Sparkman Dr NW Huntsville, AL | 2.0 | 1.0–1.5 | 940 | $1,169 | $1.24 | 45d | 1 | 1.14mi |
| 1725 Millican Pl NW Huntsville, AL | 3.0 | 2.0 | 1200 | $1,295 | $1.08 | 45d | 1 | 1.14mi |
| 1601 Sparkman Dr NW Unit 108 Huntsville, AL | 2.0 | 2.0 | 1072 | $950 | $0.89 | 45d | 1 | 1.16mi |
| 1589 Old Monrovia Rd NW Huntsville, AL | 2.0–3.0 | 2.5–3.5 | 1657 | $1,899 | $1.15 | 15d | 17 | 1.21mi |
| 1501 Old Monrovia Rd NW Huntsville, AL | 1.0–3.0 | 1.0–2.0 | 948 | $1,392 | $1.47 | 15d | 20 | 1.23mi |
| 1503 Halston Cir NW Unit D Huntsville, AL | 2.0 | 2.0 | 1030 | $850 | $0.83 | 45d | 1 | 1.23mi |
| 1510 Halston Cir NW Unit A Huntsville, AL | 2.0 | 2.0 | 1000 | $850 | $0.85 | 45d | 1 | 1.27mi |
| 4810 Bradford Dr NW Huntsville, AL | 2.0 | 1.0–2.0 | 898 | $2,204 | $2.45 | 15d | 16 | 1.28mi |
| 100 Rockcrest Dr NW Huntsville, AL | 1.0–2.0 | 1.0–2.0 | 1000 | $1,747 | $1.75 | 15d | 12 | 1.28mi |
| 1500 Sparkman Dr NW Huntsville, AL | 1.0–2.0 | 1.0 | 725 | $970 | $1.34 | 45d | 12 | 1.35mi |
| 1801 Carson Ln NW Huntsville, AL | 3.0 | 3.0 | 1405 | $2,000 | $1.42 | 15d | 1 | 1.36mi |
| 6500 Walden Run Huntsville, AL | 1.0–3.0 | 1.0–2.0 | 1060 | $1,385 | $1.31 | 15d | 104 | 1.37mi |
| 511 Delaney Rd NW Huntsville, AL | 3.0 | 2.0 | 1550 | $1,550 | $1.00 | 45d | 1 | 1.39mi |
| 4515 Bonnell Dr NW Huntsville, AL | 1.0–2.0 | 1.0–2.0 | 800 | $1,099 | $1.37 | 15d | 8 | 1.44mi |
| 1504 Ascent Trl NW Unit b Huntsville, AL | 2.0 | 2.0 | 900 | $895 | $0.99 | 25d | 1 | 1.47mi |
| 4706 Whitehall Dr NW Huntsville, AL | 3.0 | 2.0 | 1469 | $1,550 | $1.06 | 23d | 1 | 1.47mi |
HOA detail condo
- Monthly dues
- $229 · $2,748/yr
- Likely covers
- pool
- Assessments
- None detected in remarks — confirm with the listing agent.
Listing history 18 events
-
2026-06-22days on market $189,900 Active 112 DOM
-
2026-06-18days on market $189,900 Active 109 DOM
-
2026-06-17days on market $189,900 Active 108 DOM
-
2026-06-16days on market $189,900 Active 107 DOM
-
2026-06-15days on market $189,900 Active 106 DOM
-
2026-06-14pricedays on market $189,900 Active 104 DOM
-
2026-06-10days on market $200,000 Active 101 DOM
-
2026-06-09days on market $200,000 Active 100 DOM
-
2026-06-08days on market $200,000 Active 99 DOM
-
2026-06-07days on market $200,000 Active 98 DOM
-
2026-06-03days on market $200,000 Active 94 DOM
-
2026-06-02days on market $200,000 Active 93 DOM
-
2026-06-01days on market $200,000 Active 92 DOM
-
2026-05-31days on market $200,000 Active 91 DOM
-
2026-05-30days on market $200,000 Active 90 DOM
-
2026-04-15price $200,000 348-char remark
Show marketing remark (348 chars)
Welcome to 1039 Stones Throw Condo. Conveniently located to all that Mid City has to offer, Research Park and Bridge Street. Updated 2 Bedroom end Unit is waiting for you. Fresh paint, laminate flooring, Updated cabinets and counter tops. Master located on the main floor. Relax on your deck or around the community pool. Google Fiber is available.
-
2026-03-31price $214,900 348-char remark
Show marketing remark (348 chars)
Welcome to 1039 Stones Throw Condo. Conveniently located to all that Mid City has to offer, Research Park and Bridge Street. Updated 2 Bedroom end Unit is waiting for you. Fresh paint, laminate flooring, Updated cabinets and counter tops. Master located on the main floor. Relax on your deck or around the community pool. Google Fiber is available.
-
2026-03-01$219,900 Active 348-char remark
Show marketing remark (348 chars)
Welcome to 1039 Stones Throw Condo. Conveniently located to all that Mid City has to offer, Research Park and Bridge Street. Updated 2 Bedroom end Unit is waiting for you. Fresh paint, laminate flooring, Updated cabinets and counter tops. Master located on the main floor. Relax on your deck or around the community pool. Google Fiber is available.
ⓘ Source: listings_history table (triggers on properties + properties_extension) + one-shot
backfill from property_details.listing_events for pre-trigger history.
Climate risk First Street
- Flood 1/10 Low FEMA zone X (unshaded) · 0% chance over 30 yrs
- Wildfire 1/10 Low
- Heat 6/10 Major 7 d/yr ≥105°F today · 19 d/yr by 30 yrs out
- Wind 4/10 Moderate 16% chance of damaging wind over 30 yrs
- Air quality 2/10 Low 0 unhealthy d/yr today · 2 by 30 yrs out
Nearby sold comps map
Loading sold comps map…
Walkable amenities ~0.75 mi
Loading nearby amenities…
Taxation est. · year 1
- Rental income
- $16,660
- − Mortgage interest
- −$10,637
- − Property taxes
- −$2,848
- − Insurance
- −$950
- − Repairs & maintenance
- −$1,333
- − Management
- −$1,333
- − HOA
- −$2,748
- − Depreciation
- −$5,524
- Taxable loss
- −$8,714
- Est. tax savings @ 24.0%
- +$2,091
- After-tax cash flow
- $-3,244/yr
For passive investors: Depreciation is non-cash, so a rental often shows a tax loss while cash-flowing — sheltering income. Rental losses are passive: they offset passive income freely, and up to $25,000/yr can offset ordinary (W-2) income if you actively participate and your MAGI is under $100k (phasing out to $0 by $150k); unused losses carry forward. On sale, claimed depreciation is recaptured at up to 25%, and gains may owe capital-gains tax (a 1031 exchange can defer both). Figures are a year-1 estimate at your 24.0% rate — not tax advice; consult a CPA.
Schools (NCES district)
- District
- Huntsville City
- NCES district ID
- 0101800
- Math proficiency
- 21% ▼ -23.00%
- Reading proficiency
- 46% ▬ 0.00%
- Median HH income
- $48,264
- Composite
- 28.84/100
- National rank
- #6647
- State rank
- #48 of 129 in AL
Livability — Huntsville
- Score
- 82/100
- State rank
- #3
- US rank
- #1082
Category grades
Schools grade is shown separately in the Schools card above.
Census & demographics
- Census place
- Huntsville, AL
- County
- Madison County · 380,832 people
- City population
- 220,435
- Metro
- Huntsville, AL
- Population (ZIP)
- 29,161
- Household income
- $86,768
- Rent vs Own
- Severe rent burden
- 1249.0
Population outlook (Madison County) Hauer SSP2
- Today (2025)
- 392,086 people
- By 2030
- 409,788 · +4.5%
- By 2040
- 440,557 · +12.4%
- By 2050
- 460,990 · +17.6%
- By 2075
- 502,872 · +28.3%
- By 2100
- 513,623 · +31.0%
Race, ethnicity, and origin ACS 2023
- Neighborhood character
- Diverse neighborhood (Simpson 0.57)
- Race & ethnicity
- White 58% Black 30% Hispanic / Latino 5% Two or more races 5% Asian 4%
- Hispanic origin (detail)
- Mexican 2% Puerto Rican 2%
- Common ancestry
- Slovak 2% Italian 2% Serbian 2%
- Foreign-born
- 7% · Canada, Vietnam, China
- Languages at home
- 93% English-only · Spanish 2% Other Indo-European 1% Other Asian/Pacific 1%
Political lean MEDSL · Madison
- 2024 margin
- Lean R (+9.0) · D 44.7% · R 53.7% · Other 1.6%
- 2008→2024 swing
- +6.0pp toward D · 2008: -14.9pp · 2024: -9.0pp
- All cycles
- 2024: R+9.0 2020: R+8.0 2016: R+16.8 2012: R+18.7 2008: R+14.9
Not yet ingested
- Civics
- —
Market trends
- HPI YoY
- ▲ 71.67%
- Current HPI
- 430.5866
- Rent YoY
- ▲ 2.57%
- Metro
- Huntsville, AL
- State GDP YoY
- ▲ 2.94%
- F500 in state
- 4
Industry mix (Fortune 500 HQ in AL)
| Industry | F500 HQs | Revenue |
|---|---|---|
| Financial Services | 1 | $8B |
|
||
| Healthcare | 1 | $5B |
|
||
Price history
-9.0% since first listed3 events — show timeline
- 2026-04-15 Price Changed $200,000 VMLS
- 2026-03-31 Price Changed $214,900 VMLS
- 2026-03-01 Listed $219,900 VMLS
Cash-flow waterfall
monthlySold comps — $/sqft
last 12 mo · ≤1 miLoading sold comps…