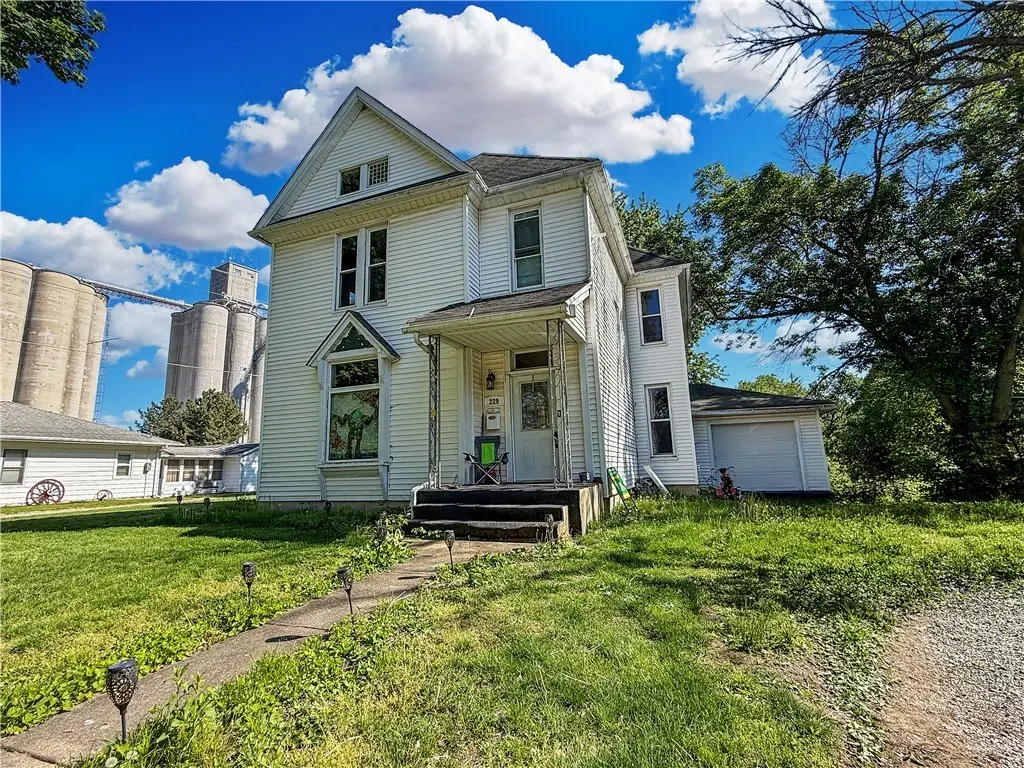
229 W Madison St · Moweaqua, IL
Flood risk 1/10 · Minimal
- FEMA flood zone
- X
- Chance of flooding over 30 yrs
- 0.0%
- Est. flood insurance / yr
- $507 – $1,088
Fire risk 1/10 · Minimal
- Est. fire insurance / yr
- $804 – $1,492
Heat risk 4/10 · Minor
- Hot days now (above 105°F)
- 7 days/yr
- Hot days in 30 yrs
- 19 days/yr
Wind risk 2/10 · Minimal
- Chance of severe wind over 30 yrs
- 2.0%
Air-quality risk 4/10 · Minor
- Unhealthy air days now
- 3 days/yr
- Unhealthy air days in 30 yrs
- 6 days/yr
Risk factors via First Street. Map © Google.
Why this score? — see what drove the C- grade
The composite is a weighted blend of 9 inputs, each scored 0–100. Each bar is that input's sub-score; the figure is the points it added to the 100-point composite (weight × sub-score).
- ARV discount +15.0/15.0
- Cash flow +11.6/30.0
- Appreciation +8.4/10.0
- DSCR +3.4/10.0
- 1% rule +3.3/10.0
- Livability +3.2/5.0
- Rent growth +2.5/5.0
- Condition / age +2.5/5.0
- Schools +1.5/10.0
$154,900
🖨 Deal sheet 📄 Offer letter ✓ Due diligence
Listing remarks MLS
Sitting on a quaint and quiet, tree-lined street, this historic home is looking to make new traditions! A classic bay window lets natural light shine through the large dining room to an updated kitchen with newer cabinets and flooring. The main floor also offers a handy bedroom and full bath with a walk-in shower, as well as a half bath in the laundry room. Upstairs you’ll find four more bedrooms and another full bath- bringing you to a whopping five bedrooms. Shady yard, Central A & M schools, and historic character- what more could you ask for!
Key facts
- Bay window
- Full bath
- Historic character
Tags
Neighborhood map
What this means for you Summary
Snapshot
- This is a 4-bed/1.0-bath single-family listed at $155k.
Deal economics
- At list price, monthly cash flow is $-47 ($-569/yr) — negative.
- To cash-flow at today's rent, offer at most $147k (5.4% below list).
- To meet the 1% rule (rent ≥ 1% of price), the offer needs to be $129k (16.6% below list).
- Recommended offer: $129k (16.6% below list) — sets the bar for 1% rule.
Location & tenants
- Location reads 65/100 on livability (#616 in IL) — a middle-class / working-renter tenant base. Strengths: cost of living A+, housing A+, crime A; Watch: schools F, amenities F, commute F.
- Central A & M CUD 21 (rural): math 13% / reading 20% proficiency, ranked #477 of 620 in IL (top 77%) — low school quality limits family demand, transient renter base, plan for 1-2y turnover.
- Market conditions: 19 active listings in the ZIP; 41 units permitted in Shelby County in 2024 (0 in 5+ unit buildings).
Forward outlook
- In year one you build about $11k of equity ($1k loan paydown + $10k appreciation (6.7% local appreciation)).
- Shelby County population projected at -22% by 2050 — secular population decline; favor cash flow + early exit over multi-decade hold.
- At projected returns (6.7% appreciation + 3.0% rent growth), your $43k cash investment doubles in ~4 years — after that, you're playing with house money.
- By year 4, paydown + projected appreciation supports a ~$39k cash-out refi (75% LTV) — recoverable capital for the next deal without selling this one.
Negotiation context
- It's been on market 187 days — a 12% lower offer ($136k) is reasonable based on typical stale-listing flexibility.
- 7 sale attempts since 20y ago; this cycle's ask has dropped $15k (9%) from the opening price — seller is motivated, your offer sets the floor, not the list.
- Current owner paid $50k; list at $155k implies a 213% gain — meaningful room to come down on a strong offer.
Risks & watch-outs
- Watch-outs: built in 1885 — expect roof / HVAC / electrical / plumbing capex.
Questions for the listing agent
- What do current leases actually rent for vs. the listed asking? Can we see a recent rent roll and the last 12 months of T-12 income?
- It's been on market 187 days. Have you received any prior offers? Is the seller open to a 17% concession, seller financing, or rate buy-down credit?
- Built in 1885 — when were the roof, HVAC, electrical panel, plumbing, and water heater last replaced?
- Why hasn't it sold? Are there any deal-killer items the seller is aware of (foundation, flood, title, zoning, code violations)?
- Is there a deadline driving the sale (1031 exchange, divorce, estate, relocation)? That informs how much negotiation room exists.
- Schools are F-rated, which usually means shorter tenancies and higher turnover. Who's the typical renter profile here, and what's been the actual vacancy rate?
- What's the average days-on-market for RENTAL listings here right now (not sales)? A rising rental-DOM trend means longer vacancies and softer asking-rent achievability than the comps imply.
- What's the recent tenant-quality profile in this submarket — average credit score on applications, eviction rate, late-payment / NSF rate, and stable-employment percentage? A property-management company in the area should have these aggregated.
- How much new for-sale + rental construction is in the pipeline within 1–3 miles? Heavy new supply typically softens prices + rents 12–24 months out; constrained supply supports both.
Investment metrics
- 1% rule
- 0.83% ✗
- Cap rate
- 5.93%
- Cash-on-cash
- -1.31%
- DSCR
- 0.94
- GRM
- 10.0
CMA / ARV
- ARV (median comp)
- $197,002
- List price
- $154,900
- Delta
- -21.37%
- Verdict
- UNDERPRICED
- Comps
- 6 within 1.0 mi
Show comp detail 8 sales within ~0.75 mi
| Address | Dist | Beds/Ba | Sqft | Sold | Price | $/sf | Match |
|---|---|---|---|---|---|---|---|
| 221 E Warren St | 0.40mi | 3/1.0 (-1) | 1,200 (-2%) | 5mo | $109,000 | $91 | 69 |
| 504 Putnam St | 0.47mi | 3/1.0 (-1) | 1,235 (+1%) | 10mo | $70,000 | $57 | 63 |
| 321 South St | 0.43mi | 3/1.0 (-1) | 1,316 (+7%) | 0mo | $137,500 | $104 | 62 |
| 119 W Madison St | 0.11mi | 3/1.5 (-1) | 1,332 (+9%) | 21mo | $88,400 | $66 | 56 |
| 209 W Wall St | 0.17mi | 3/1.0 (-1) | 1,078 (-12%) | 19mo | $85,000 | $79 | 51 |
| 317 E South St | 0.41mi | 3/2.0 (-1) | 1,296 (+6%) | 17mo | $140,000 | $108 | 48 |
| 329 Main St | 0.36mi | 4/2.0 | 1,070 (-13%) | 23mo | $95,000 | $89 | 39 |
| 222 N East St | 0.56mi | 3/1.0 (-1) | 1,400 (+14%) | 21mo | $90,000 | $64 | 28 |
Match score weights: distance 35% · size 25% · config 20% · recency 20%. Top-matched comps best support the ARV.
Projected returns pro-forma
6.72% appreciation · 3.0% rent growth · sell at horizon
- IRR
- 16.0%
- Equity multiple
- 2.12×
- Total profit
- $48,462
- Equity at exit
- $104,547
- IRR
- 15.8%
- Equity multiple
- 4.31×
- Total profit
- $143,470
- Equity at exit
- $196,111
Cash invested: $43,372 (down + closing). Projections, not guarantees.
Landlord ↔ Tenant lean methodology
- Overall (STATE)
- 43 Moderately Tenant-Leaning
- State Illinois
- 43 Moderately Tenant-Leaning · D+7
- County
- — inherits STATE
- City
- — inherits STATE
ZIP-level market 62550
- Home prices YoY
- 3.5%
- Active inventory
- 19
- Price-to-rent
- 10.0×
Monthly cashflow live
- Estimated rent
- $1,292 medium interval (Pro) →
- Mortgage (P&I)
- −$812
- Tax from tax record
- −$191 /mo · $2,298/yr
- Insurance
- −$65
- HOA
- −$0
- Vacancy / Maint / Mgmt
- −$271
- Net cashflow
- $-47
Break-even live
UW: 25.0% down · 7.5% · 30yr · 1.5% tax · 5.0% vac · 8.0% maint · 8.0% mgmt
Financing live
Cash to close
- Down payment
- $38,725
- Closing costs
- $4,647
- Reserves months
- —
- Total cash needed
- —
Loan-product check · same deal, 3 products live
Conventional
25% down · 7.5% · 30yr
- Down + closing
- —
- Monthly P&I
- —
- Monthly cashflow
- —
- DSCR
- —
- Eligible?
- —
Personal DTI + credit; lowest rate.
DSCR
20% down · 8.5% · 30yr
- Down + closing
- —
- Monthly P&I
- —
- Monthly cashflow
- —
- DSCR
- —
- Eligible?
- —
No personal income docs; deal must DSCR.
Hard money
10% down · 12.0% · 12mo
- Down + closing
- —
- Monthly P&I
- —
- Monthly cashflow
- —
- DSCR
- —
- Eligible?
- —
Short-term bridge; refi at stabilization.
Listing history 28 events
-
2026-06-19days on market $154,900 Active 187 DOM
-
2026-06-18days on market $154,900 Active 186 DOM
-
2026-06-17days on market $154,900 Active 185 DOM
-
2026-06-16days on market $154,900 Active 184 DOM
-
2026-06-15days on market $154,900 Active 183 DOM
-
2026-06-05days on market $154,900 Active 181 DOM
-
2026-06-02days on market $154,900 Active 179 DOM
-
2026-06-01days on market $154,900 Active 178 DOM
-
2026-05-31days on market $154,900 Active 177 DOM
-
2026-05-30days on market $154,900 Active 176 DOM
-
2026-02-02price $154,900 562-char remark
Show marketing remark (562 chars)
Sitting on a quaint and quiet, tree-lined street, this historic home is looking to make new traditions! A classic bay window lets natural light shine through the large dining room to an updated kitchen with newer cabinets and flooring. The main floor also offers a handy bedroom and full bath with a walk-in shower, as well as a half bath in the laundry room. Upstairs you’ll find four more bedrooms and another full bath- bringing you to a whopping five bedrooms. Shady yard, Central A & M schools, and historic character- what more could you ask for!
-
2025-12-05$169,900 Active 562-char remark
Show marketing remark (562 chars)
Sitting on a quaint and quiet, tree-lined street, this historic home is looking to make new traditions! A classic bay window lets natural light shine through the large dining room to an updated kitchen with newer cabinets and flooring. The main floor also offers a handy bedroom and full bath with a walk-in shower, as well as a half bath in the laundry room. Upstairs you’ll find four more bedrooms and another full bath- bringing you to a whopping five bedrooms. Shady yard, Central A & M schools, and historic character- what more could you ask for!
-
2025-05-02status Pending
-
2025-04-11historical Active Under Contract
-
2025-03-03status Active
-
2025-02-18historical Active Under Contract
-
2025-02-11$149,900 Active
-
2024-10-28status Active
-
2024-10-23status Pending
-
2024-10-13historical Active Under Contract
-
2024-09-24$164,000 Active
-
2022-08-25historical
-
2022-06-09Active
-
2012-11-30historical
-
2011-10-27soldstatus $49,500
-
2007-06-13soldstatus $85,000
-
2007-05-15soldstatus $85,000
-
2006-11-29$85,000
ⓘ Source: listings_history table (triggers on properties + properties_extension) + one-shot
backfill from property_details.listing_events for pre-trigger history.
Tax reassessment forecast IL · Partial reset (capped growth)
- Current annual tax
- $2,298 · $191/mo
- Projected year-2 tax
- $2,907 · $242/mo
- Expected delta
- +$609/yr (+$51/mo · 26.5%)
ⓘ Screening estimate from a state-policy table — verify with the county assessor before closing.
Climate risk First Street
- Flood 1/10 Low FEMA zone X · 0% chance over 30 yrs
- Wildfire 1/10 Low
- Heat 4/10 Moderate 7 d/yr ≥105°F today · 19 d/yr by 30 yrs out
- Wind 2/10 Low 2% chance of damaging wind over 30 yrs
- Air quality 4/10 Moderate 3 unhealthy d/yr today · 6 by 30 yrs out
Nearby sold comps map
Loading sold comps map…
Walkable amenities ~0.75 mi
Loading nearby amenities…
Taxation est. · year 1
- Rental income
- $15,508
- − Mortgage interest
- −$8,677
- − Property taxes
- −$2,298
- − Insurance
- −$774
- − Repairs & maintenance
- −$1,241
- − Management
- −$1,241
- − Depreciation
- −$4,506
- Taxable loss
- −$3,229
- Est. tax savings @ 24.0%
- +$775
- After-tax cash flow
- $206/yr
For passive investors: Depreciation is non-cash, so a rental often shows a tax loss while cash-flowing — sheltering income. Rental losses are passive: they offset passive income freely, and up to $25,000/yr can offset ordinary (W-2) income if you actively participate and your MAGI is under $100k (phasing out to $0 by $150k); unused losses carry forward. On sale, claimed depreciation is recaptured at up to 25%, and gains may owe capital-gains tax (a 1031 exchange can defer both). Figures are a year-1 estimate at your 24.0% rate — not tax advice; consult a CPA.
Schools (NCES district)
- District
- Central A & M CUD 21
- NCES district ID
- 1709100
- Math proficiency
- 13% ▼ -5.00%
- Reading proficiency
- 20% ▼ -7.00%
- Median HH income
- $50,388
- Composite
- 15.02/100
- National rank
- #9357
- State rank
- #477 of 620 in IL
Livability — Moweaqua
- Score
- 65/100
- State rank
- #616
- US rank
- #12660
Category grades
Schools grade is shown separately in the Schools card above.
Census & demographics
- Census place
- Moweaqua, IL
- Population (ZIP)
- 3,070
Population outlook (Shelby County) Hauer SSP2
- Today (2025)
- 20,512 people
- By 2030
- 19,675 · -4.1%
- By 2040
- 17,851 · -13.0%
- By 2050
- 15,973 · -22.1%
- By 2075
- 11,799 · -42.5%
- By 2100
- 8,030 · -60.9%
Race, ethnicity, and origin ACS 2023
- Neighborhood character
- Predominantly White (94%)
- Race & ethnicity
- White 94% Hispanic / Latino 3% Two or more races 2% Native American 1%
- Common ancestry
- Iranian 3% Slovak 3% Lithuanian 2%
- Foreign-born
- 0%
- Languages at home
- 98% English-only · Spanish 1%
Political lean MEDSL · Shelby
- 2024 margin
- Solid R (+60.2) · D 19.2% · R 79.5% · Other 1.4%
- 2008→2024 swing
- -40.5pp toward R · 2008: -19.8pp · 2024: -60.2pp
- All cycles
- 2024: R+60.2 2020: R+57.2 2016: R+54.3 2012: R+33.7 2008: R+19.8
Not yet ingested
- Civics
- —
Market trends
- HPI YoY
- ▲ 6.72%
- Current HPI
- 197.0448
- Rent YoY
- —
- Metro
- —
- State GDP YoY
- ▲ 1.59%
- F500 in state
- 60
Industry mix (Fortune 500 HQ in IL)
| Industry | F500 HQs | Revenue |
|---|---|---|
| Insurance | 4 | $201B |
|
||
| Consumer Goods | 4 | $87B |
|
||
| Industrial Machinery | 3 | $64B |
|
||
| Healthcare | 2 | $55B |
|
||
| Retail / Pharmacy | 1 | $148B |
|
||
| Agriculture / Food | 1 | $86B |
|
||
Price history
+82.2% since first listed18 events — show timeline
- 2026-02-02 Price Changed $154,900 CIBR
- 2025-12-05 Listed $169,900 CIBR
- 2025-05-02 Pending — CIBR
- 2025-04-11 Contingent — CIBR
- 2025-03-03 Relisted — CIBR
- 2025-02-18 Contingent — CIBR
- 2025-02-11 Listed $149,900 CIBR
- 2024-10-28 Relisted — CIBR
- 2024-10-23 Pending — CIBR
- 2024-10-13 Contingent — CIBR
- 2024-09-24 Listed $164,000 CIBR
- 2022-08-25 Listing Removed — MRED as Distributed by MLS Grid
- 2022-06-09 Listed — MRED as Distributed by MLS Grid
- 2012-11-30 Listing Removed — MRED as Distributed by MLS Grid
- 2011-10-27 Sold (Public Records) $49,500 Public Records
- 2007-06-13 Sold (Public Records) $85,000 Public Records
- 2007-05-15 Sold (MLS) $85,000 MRED as Distributed by MLS Grid
- 2006-11-29 Listed $85,000 MRED as Distributed by MLS Grid
Property tax history
+1.2%/yrLatest (2024): $2,298 · +9.8% YoY. Source: county tax records.
Cash-flow waterfall
monthlySold comps — $/sqft
last 12 mo · ≤1 miLoading sold comps…