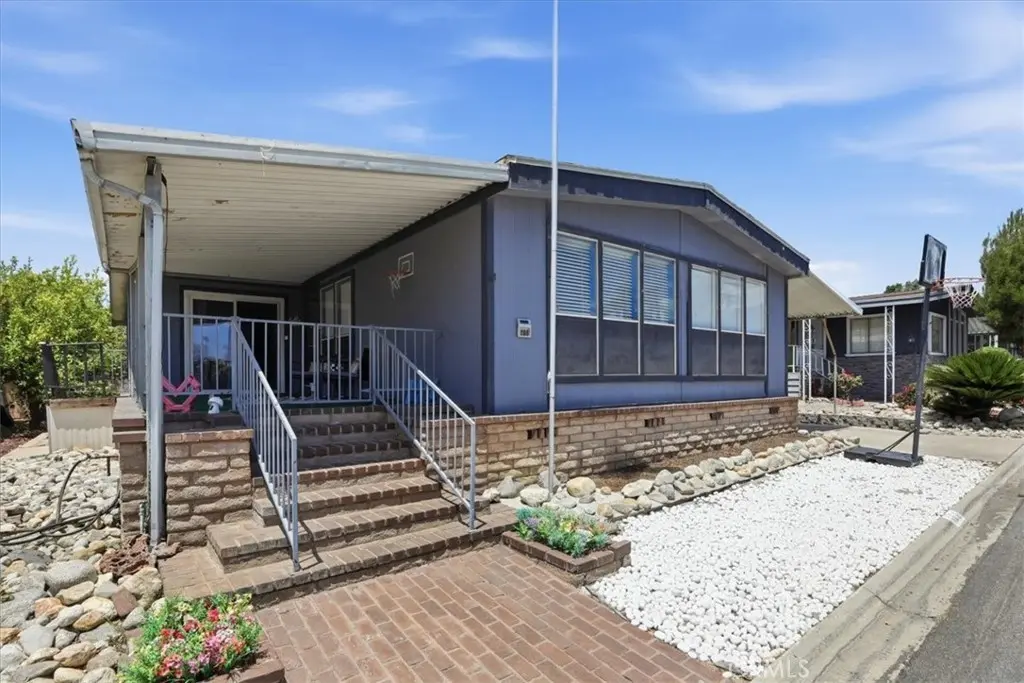
929 E Foothill #198 · Upland, CA
Flood risk 3/10 · Minor
- FEMA flood zone
- X (unshaded)
- Chance of flooding over 30 yrs
- 0.2%
- Est. flood insurance / yr
- $507 – $1,088
Fire risk 1/10 · Minimal
- Est. fire insurance / yr
- $659 – $1,223
Heat risk 7/10 · Major
- Hot days now (above 99°F)
- 7 days/yr
- Hot days in 30 yrs
- 18 days/yr
Wind risk 1/10 · Minimal
- Chance of severe wind over 30 yrs
- —
Air-quality risk 9/10 · Severe
- Unhealthy air days now
- 23 days/yr
- Unhealthy air days in 30 yrs
- 28 days/yr
Risk factors via First Street. Map © Google.
Why this score? — see what drove the C grade
The composite is a weighted blend of 9 inputs, each scored 0–100. Each bar is that input's sub-score; the figure is the points it added to the 100-point composite (weight × sub-score).
- Cash flow +27.6/30.0
- DSCR +9.7/10.0
- 1% rule +7.5/10.0
- Schools +4.3/10.0
- Livability +3.6/5.0
- Condition / age +2.5/5.0
- Rent growth +2.4/5.0
- ARV discount +0.0/15.0
- Appreciation +0.0/10.0
$250,000
🖨 Deal sheet (PDF) 📄 Offer letter ✓ Due diligence
Listing remarks MLS
PROPERTY HAS NEVER BEEN SHOWN! BEAUTIFUL PROPERTY! COME CHECK OUT THIS PROPERTY THAT FEATURES 3 BEDROOMS, 2 BATHS, HIGH CEILINGS, OPEN KITCHEN, LAUNDRY ROOM, COZY FIREPLACE IN LARGE LIVINGROOM & SO MUCH MORE. STOP RENTING - COME INVEST IN YOUR FUTURE. THIS LOVELY SPACIOUS HOME HAS A GREAT LAYOUT, WELL KEPT, AND PRICED TO SELL.
Key facts
- Relaxing spa
- Upgraded kitchen
- 1,248 sq ft lot
Tags
Property features AI
Finance
- Other: Manager approval required for residency
- Financial info: Rent includes trash, water, and sewer; Special assessments
- HOA & community: Land lease community (monthly land lease); Park name: Upland Meadows; Community features: curbs, biking paths, street lighting, sidewalks, park; Pets allowed (manager approval required)
Exterior
- Parking: Concrete driveway; Paved parking; Covered parking; Carport
- Security: Gated community; Carbon monoxide detector(s); Smoke detector
- Utilities: Public sewer; District/public water; Water connected and available; Sewer connected and available; Natural gas connected and available; Electricity connected and available; Cable available; Telephone available in street
- Home design: Single-story home; One level; Turnkey, updated/remodeled condition; Mobile home model: Lexington (12' x 60'); Mobile home remains on site; Two or more access exits; Entry with steps (entry level 7)
- Construction: Concrete slab foundation
- Exterior features: Covered front porch; Porch; Open patio; Patio (covered and open); Community pool; Close to clubhouse; Block wall fencing in good condition; Wrought iron fencing; Has view; Access via paved city streets
Interior
- Kitchen: Remodeled kitchen open to family room; Kitchen island; Gas cooktop; Gas oven; Microwave; Dishwasher; Water line to refrigerator; Water heater unit
- Bedrooms: Primary bedroom (main floor); Main floor bedroom
- Flooring: Laminated flooring
- Bathrooms: Two full bathrooms; Walk-in shower; Double sinks in primary bath; Closet in bathroom; Linen closet/storage; Remodeled bathrooms
- Heating & cooling: Central heating (furnace); Central cooling
- Interior features: Built-ins; Ceiling fan; Pantry; Recessed lighting; Open floor plan; Storage space; Sliding glass door(s); Mirrored closet doors; Double pane windows; Drapes/curtains; Window screens; Carbon monoxide detector(s); Smoke detector; Gated community; Community spa
- Laundry & utility: Laundry room inside (individual room)
Neighborhood map
What this means for you Summary
Snapshot
- This is a 2-bed/2.0-bath manufactured listed at $250k.
Deal economics
- At list price, monthly cash flow is $748 ($9k/yr) — positive.
- The deal already cash-flows at list — no discount required.
- Meets the 1% rule at list price ($3k rent vs $250k).
- Recommended offer: $246k (1.5% below list) — sets the bar for market timing.
- Cap rate 9.9% vs local median 2.7% in Upland — top-decile yield for the area; either an underpriced asset or a hidden risk that comps aren't pricing in. Stress-test before assuming the spread holds.
Location & tenants
- Location reads 72/100 on livability (#184 in CA) — a middle-class / working-renter tenant base. Strengths: amenities A+, commute A+, employment A; Watch: crime C-, health & safety C-, cost of living F.
- Upland Unified (suburban): math 39% / reading 53% proficiency, ranked #493 of 1,400 in CA (top 35%) — families likely to look elsewhere, expect single-tenant / working-renter base with shorter leases.
- Zoned schools: Sierra Vista Elementary (429 students, 76% FRL); Upland Junior High (667 students, 88% FRL); Upland High (3,070 students, 69% FRL) — zoned schools average 78% FRL vs 44% district-wide (34 pts higher); higher-poverty schools than district average — tighter screening recommended.
- Market conditions: Rents soft (-0.3%/yr); 84 active listings in the ZIP; 28 comparable units currently listed for rent nearby; rentals leasing fast (median 7d on market — plan ~1-2 weeks tenant-placement turnaround); solid renter incomes; 5,458 units permitted in San Bernardino County in 2024 (1,500 in 5+ unit buildings).
- This rent runs 41% of the median local income ($92k/yr) — at the standard rent-burdened threshold; future hikes will face affordability resistance.
Forward outlook
- Local home prices are declining (-3.0%/yr); year-one equity from $2k of loan paydown is wiped out by about $8k of value loss. Plan a longer hold.
- San Bernardino County population projected at +15% by 2050 — modest demand growth; plan on rents tracking national, not racing it.
Negotiation context
- It's been on market 22 days — a 2% lower offer ($246k) is reasonable based on typical stale-listing flexibility.
- 7 sale attempts since 10y ago with the ask held roughly flat each time — persistent listings suggest the price (not the market) is what's stuck; bring a comps-based counter.
- Current owner paid $140k; list at $250k implies a 79% gain — meaningful room to come down on a strong offer.
Risks & watch-outs
- Climate carrying-cost: extreme-heat days projected 7→18/yr by 2055 (HVAC capex compounding) — expect insurance premiums to compound above CPI over the hold.
Questions for the listing agent
- Built in 1979 — when were the roof, HVAC, electrical panel, plumbing, and water heater last replaced?
- Is there a deadline driving the sale (1031 exchange, divorce, estate, relocation)? That informs how much negotiation room exists.
- What's the average days-on-market for RENTAL listings here right now (not sales)? A rising rental-DOM trend means longer vacancies and softer asking-rent achievability than the comps imply.
- What's the recent tenant-quality profile in this submarket — average credit score on applications, eviction rate, late-payment / NSF rate, and stable-employment percentage? A property-management company in the area should have these aggregated.
- How much new for-sale + rental construction is in the pipeline within 1–3 miles? Heavy new supply typically softens prices + rents 12–24 months out; constrained supply supports both.
Investment metrics
- 1% rule
- 1.25% ✓
- Cap rate
- 9.89%
- Cash-on-cash
- 12.83%
- DSCR
- 1.57
- GRM
- 6.6
CMA / ARV
- ARV (on-the-fly)
- $213,256
- Comps found
- 12
Show comp detail 12 sales within ~0.75 mi
| Address | Dist | Beds/Ba | Sqft | Sold | Price | $/sf | Match |
|---|---|---|---|---|---|---|---|
| 929 E Foothill Blvd #15 | 0.00mi | 2/2.0 | 1,680 (-4%) | 2mo | $170 | — | 91 |
| 929 E Foothill Blvd Spc 74 | 0.00mi | 3/2.0 (+1) | 1,800 (+3%) | 2mo | $249,000 | $138 | 89 |
| 929 E Foothill Blvd #160 | 0.00mi | 3/2.0 (+1) | 1,800 (+3%) | 9mo | $231,000 | $128 | 82 |
| 929 E Foothill Blvd #30 | 0.00mi | 3/2.0 (+1) | 1,736 (-1%) | 18mo | $250,000 | $144 | 79 |
| 929 E Foothill Blvd #72 | 0.00mi | 2/2.0 | 1,856 (+6%) | 14mo | $210,000 | $113 | 78 |
| 929 E FOOTHILL Blvd #215 | 0.00mi | 3/2.0 (+1) | 1,775 (+2%) | 23mo | $215,000 | $121 | 73 |
| 929 E Foothill Blvd #172 | 0.00mi | 2/2.0 | 1,896 (+8%) | 23mo | $195,000 | $103 | 66 |
| 929 E Foothill Blvd #28 | 0.00mi | 3/2.0 (+1) | 1,536 (-12%) | 11mo | $170,000 | $111 | 65 |
| 1320 San Bernardino #34 | 0.70mi | 2/2.0 | 1,760 (+1%) | 5mo | $215,000 | $122 | 62 |
| 929 E Foothill Blvd #187 | 0.15mi | 3/2.0 (+1) | 1,512 (-14%) | 6mo | $339,900 | $225 | 60 |
| 929 E Foothill Blvd #44 | 0.00mi | 3/2.0 (+1) | 1,536 (-12%) | 21mo | $182,500 | $119 | 58 |
| 1320 San Bernardino Rd #66 | 0.70mi | 3/2.0 (+1) | 1,568 (-10%) | 20mo | $262,000 | $167 | 28 |
Match score weights: distance 35% · size 25% · config 20% · recency 20%. Top-matched comps best support the ARV.
Projected returns pro-forma
-3.0% appreciation · 0.0% rent growth · sell at horizon
- IRR
- -0.8%
- Equity multiple
- 0.97×
- Total profit
- $-1,978
- Equity at exit
- $37,276
- IRR
- 5.4%
- Equity multiple
- 1.35×
- Total profit
- $24,355
- Equity at exit
- $21,615
Cash invested: $70,000 (down + closing). Projections, not guarantees.
Landlord ↔ Tenant lean methodology
- Overall (STATE)
- 18 Strongly Tenant-Friendly
- State California
- 18 Strongly Tenant-Friendly · D+13
- County
- — inherits STATE
- City
- — inherits STATE
ZIP-level market 91786
- Rents YoY
- -0.3%
- Active inventory
- 84
- Price-to-rent
- 6.6×
Monthly cashflow live
- Estimated rent
- $3,134 high interval (Pro) →
- Mortgage (P&I)
- −$1,311
- Tax est. 1.5%
- −$312 /mo · $3,750/yr
- Insurance
- −$104
- HOA
- −$0
- Vacancy / Maint / Mgmt
- −$658
- Net cashflow
- $748
Break-even live
Sensitivity live
| Price | -10% $921 | -5% $835 | +0% $748 | +5% $662 | +10% $576 |
|---|---|---|---|---|---|
| Rent | -10% $501 | -5% $625 | +0% $748 | +5% $872 | +10% $996 |
| Rate | -1.0pp $874 | -0.5pp $812 | base $748 | +0.5pp $684 | +1.0pp $618 |
UW: 25.0% down · 7.5% · 30yr · 1.5% tax · 5.0% vac · 8.0% maint · 8.0% mgmt
Financing live
Cash to close
- Down payment
- $62,500
- Closing costs
- $7,500
- Reserves months
- —
- Total cash needed
- —
Loan-product check · same deal, 3 products live
Conventional
25% down · 7.5% · 30yr
- Down + closing
- —
- Monthly P&I
- —
- Monthly cashflow
- —
- DSCR
- —
- Eligible?
- —
Personal DTI + credit; lowest rate.
DSCR
20% down · 8.5% · 30yr
- Down + closing
- —
- Monthly P&I
- —
- Monthly cashflow
- —
- DSCR
- —
- Eligible?
- —
No personal income docs; deal must DSCR.
Hard money
10% down · 12.0% · 12mo
- Down + closing
- —
- Monthly P&I
- —
- Monthly cashflow
- —
- DSCR
- —
- Eligible?
- —
Short-term bridge; refi at stabilization.
Rent comps 28 comps
| Address | Beds | Baths | Sqft | Rent | $/sqft | DOM | Units | Dist |
|---|---|---|---|---|---|---|---|---|
| 863 N 9th Ave Upland, CA | 3.0 | 2.0 | 1507 | $3,600 | $2.39 | 0d | 1 | 0.31mi |
| 890 N Campus Ave Apt B Upland, CA | 3.0 | 1.5 | 1380 | $2,900 | $2.10 | 22d | 1 | 0.33mi |
| 1420 Felicita Ct Upland, CA | 3.0 | 2.0 | 1339 | $3,095 | $2.31 | 6d | 1 | 0.50mi |
| 1054 N Euclid Ave Upland, CA | 3.0 | 2.0 | 1544 | $3,600 | $2.33 | 45d | 1 | 0.73mi |
| 1405 E 15th St Upland, CA | 3.0 | 2.0 | 2212 | $3,900 | $1.76 | 0d | 1 | 0.75mi |
| 8210 Rancheria Dr Unit 8 Rancho Cucamonga, CA | 3.0 | 2.0 | 1200 | $2,895 | $2.41 | 0d | 1 | 0.76mi |
| 517 D St Upland, CA | 3.0 | 2.0 | 1464 | $2,950 | $2.02 | 45d | 1 | 0.78mi |
| 306 N 10th Ave Apt -3 Upland, CA | 3.0 | 2.0 | 1450 | $3,000 | $2.07 | 45d | 1 | 0.79mi |
| 329 N Campus Ave Upland, CA | 3.0 | 3.0 | 1982 | $3,750 | $1.89 | 13d | 1 | 0.81mi |
| 690 N 1st Ave Upland, CA | 2.0 | 2.0 | 2000 | $3,500 | $1.75 | 0d | 1 | 0.82mi |
| 1425 Cottonwood St Upland, CA | 3.0 | 2.5 | 1893 | $3,099 | $1.64 | 1d | 1 | 0.84mi |
| 595 N Euclid Ave Upland, CA | 3.0 | 2.0 | 1298 | $3,300 | $2.54 | 0d | 1 | 0.96mi |
| 8300 Gabriel Dr Unit B Rancho Cucamonga, CA | 3.0 | 2.0 | 1140 | $3,350 | $2.94 | 0d | 1 | 0.97mi |
| 744 Pebble Beach Dr Upland, CA | 3.0 | 2.0 | 1800 | $4,495 | $2.50 | 45d | 1 | 1.00mi |
| 8491 Gabrielino Ct Unit 69 Rancho Cucamonga, CA | 3.0 | 2.5 | 1417 | $3,850 | $2.72 | 0d | 1 | 1.01mi |
| 330 Amber Ct Upland, CA | 1.0–2.0 | 1.0–2.0 | 931 | $2,200 | $2.36 | 1d | 2 | 1.04mi |
| 158 Macintosh Way Upland, CA | 3.0 | 2.5 | 1325 | $3,300 | $2.49 | 25d | 1 | 1.14mi |
| 7522 Alta Cuesta Dr Rancho Cucamonga, CA | 2.0 | 2.0 | 1055 | $3,495 | $3.31 | 3d | 1 | 1.16mi |
| 111 N 1st Ave Upland, CA | 3.0 | 3.0 | 1480 | $3,750 | $2.53 | 0d | 1 | 1.19mi |
| 1501 Golf Club Dr Upland, CA | 2.0–3.0 | 1.5–2.5 | 1343 | $2,940 | $2.19 | 0d | 3 | 1.20mi |
| 8567 Cava Dr Rancho Cucamonga, CA | 3.0 | 2.5 | 1763 | $3,600 | $2.04 | 0d | 1 | 1.27mi |
| 702 Mitchell Way Upland, CA | 3.0 | 2.5 | 2047 | $3,480 | $1.70 | 26d | 1 | 1.35mi |
| 855 Madison Ct Upland, CA | 3.0 | 2.5 | 1826 | $3,500 | $1.92 | 45d | 1 | 1.36mi |
| 8650 Cava Dr Rancho Cucamonga, CA | 3.0 | 2.5 | 1763 | $3,200 | $1.82 | 16d | 1 | 1.37mi |
| 854 Orchid Ct Unit G Upland, CA | 2.0 | 2.0 | 1050 | $1,900 | $1.81 | 26d | 1 | 1.40mi |
| 8555 Sandalwood Ct Rancho Cucamonga, CA | 3.0 | 2.0 | 1400 | $3,375 | $2.41 | 0d | 1 | 1.41mi |
| 896 Altura Way Unit A Upland, CA | 3.0 | 2.0 | 1317 | $3,000 | $2.28 | 6d | 1 | 1.42mi |
| 8760 Church St Rancho Cucamonga, CA | 3.0 | 1.5 | 1151 | $3,395 | $2.95 | 11d | 1 | 1.43mi |
Listing history 11 events
-
2026-06-21days on market $250,000 Active 22 DOM
-
2026-06-18days on market $250,000 Active 19 DOM
-
2026-06-17days on market $250,000 Active 18 DOM
-
2026-06-16days on market $250,000 Active 17 DOM
-
2026-06-15days on market $250,000 Active 16 DOM
-
2026-06-13days on market $250,000 Active 14 DOM
-
2026-06-13days on market $250,000 Active 13 DOM
-
2026-06-09days on market $250,000 Active 10 DOM
-
2026-06-08days on market $250,000 Active 9 DOM
-
2026-06-07remarks 695-char remark
-
2026-06-07$250,000 Active 8 DOM
ⓘ Source: listings_history table (triggers on properties + properties_extension) + one-shot
backfill from property_details.listing_events for pre-trigger history.
Climate risk First Street
- Flood 3/10 Moderate FEMA zone X (unshaded) · 20% chance over 30 yrs
- Wildfire 1/10 Low
- Heat 7/10 Severe 7 d/yr ≥99°F today · 18 d/yr by 30 yrs out
- Wind 1/10 Low
- Air quality 9/10 Extreme 23 unhealthy d/yr today · 28 by 30 yrs out
Nearby sold comps map
Loading sold comps map…
Walkable amenities ~0.75 mi
Loading nearby amenities…
Taxation est. · year 1
- Rental income
- $37,613
- − Mortgage interest
- −$14,004
- − Property taxes
- −$3,750
- − Insurance
- −$1,250
- − Repairs & maintenance
- −$3,009
- − Management
- −$3,009
- − Depreciation
- −$7,273
- Taxable income
- $5,318
- Est. tax owed @ 24.0%
- −$1,276
- After-tax cash flow
- $7,705/yr
For passive investors: Depreciation is non-cash, so a rental often shows a tax loss while cash-flowing — sheltering income. Rental losses are passive: they offset passive income freely, and up to $25,000/yr can offset ordinary (W-2) income if you actively participate and your MAGI is under $100k (phasing out to $0 by $150k); unused losses carry forward. On sale, claimed depreciation is recaptured at up to 25%, and gains may owe capital-gains tax (a 1031 exchange can defer both). Figures are a year-1 estimate at your 24.0% rate — not tax advice; consult a CPA.
Schools (NCES district)
- District
- Upland Unified
- NCES district ID
- 0600016
- Math proficiency
- 39% ▲ 1.00%
- Reading proficiency
- 53% ▬ 0.00%
- Median HH income
- $66,267
- Composite
- 43.17/100
- National rank
- #6593
- State rank
- #493 of 1400 in CA
Livability — Upland
- Score
- 72/100
- State rank
- #184
- US rank
- #6041
Category grades
Schools grade is shown separately in the Schools card above.
Census & demographics
- Census place
- Upland, CA
- County
- San Bernardino County · 2,030,291 people
- City population
- 82,715
- Metro
- Riverside-San Bernardino-Ontario, CA
- Population (ZIP)
- 55,829
- Household income
- $92,458
- Rent vs Own
- Severe rent burden
- 2409.0
Population outlook (San Bernardino County) Hauer SSP2
- Today (2025)
- 2,300,329 people
- By 2030
- 2,378,907 · +3.4%
- By 2040
- 2,523,137 · +9.7%
- By 2050
- 2,642,388 · +14.9%
- By 2075
- 2,880,769 · +25.2%
- By 2100
- 2,909,436 · +26.5%
Race, ethnicity, and origin ACS 2023
- Neighborhood character
- Diverse neighborhood (Simpson 0.65)
- Race & ethnicity
- Hispanic / Latino 50% White 30% Two or more races 20% Asian 8% Black 7% Native American 1%
- Hispanic origin (detail)
- Mexican 40%
- Common ancestry
- Romanian 1% Lithuanian 1% Italian 1%
- Foreign-born
- 19% · Canada, China, South Korea
- Languages at home
- 66% English-only · Spanish 24% Chinese 2% Other Indo-European 2%
Political lean MEDSL · San Bernardino
- 2024 margin
- Toss-up / Even · D 47.5% · R 49.7% · Other 2.8%
- 2008→2024 swing
- -8.5pp toward R · 2008: 6.3pp · 2024: -2.1pp
- All cycles
- 2024: R+2.1 2020: D+10.7 2016: D+9.8 2012: D+5.4 2008: D+6.3
Not yet ingested
- Civics
- —
Market trends
- HPI YoY
- ▼ -771.58%
- Current HPI
- 379.2283
- Rent YoY
- ▼ -0.27%
- Metro
- Riverside-San Bernardino-Ontario, CA
- State GDP YoY
- ▲ 3.21%
- F500 in state
- 116
Industry mix (Fortune 500 HQ in CA)
| Industry | F500 HQs | Revenue |
|---|---|---|
| Technology | 27 | $1,492B |
|
||
| Financial Services | 3 | $174B |
|
||
| Retail | 3 | $44B |
|
||
| Insurance | 3 | $26B |
|
||
| Media / Entertainment | 2 | $115B |
|
||
| Pharmaceuticals / Biotech | 2 | $62B |
|
||
Price history
+93.8% since first listed15 events — show timeline
- 2026-05-30 Listed $250,000 CRMLS
- 2023-06-09 Sold (MLS) $140,000 CRMLS
- 2023-02-11 Pending — CRMLS
- 2023-01-23 Price Changed $165,999 CRMLS
- 2023-01-10 Relisted — CRMLS
- 2023-01-10 Price Changed $170,999 CRMLS
- 2022-12-17 Relisted — CRMLS
- 2022-10-23 Relisted — CRMLS
- 2022-09-22 Listed $170,000 CRMLS
- 2016-07-11 Listing Removed — CRMLS
- 2016-07-10 Relisted — CRMLS
- 2016-07-02 Contingent — CRMLS
- 2016-06-20 Pending — CRMLS
- 2016-06-06 Price Changed $109,000 CRMLS
- 2016-05-26 Listed $129,000 CRMLS
Property tax history
-0.2%/yrLatest (2025): $203 · +1.3% YoY. Source: county tax records.
Cash-flow waterfall
monthlySold comps — $/sqft
last 12 mo · ≤1 miLoading sold comps…