53 Short Ln · Concho, AZ
Flood risk 1/10 · Minimal
- FEMA flood zone
- D
- Chance of flooding over 30 yrs
- 0.0%
- Est. flood insurance / yr
- $615 – $945
Fire risk 2/10 · Minimal
- Est. fire insurance / yr
- $610 – $1,132
Heat risk 4/10 · Minor
- Hot days now (above threshold)
- 6 days/yr
- Hot days in 30 yrs
- 16 days/yr
Wind risk No data
- Chance of severe wind over 30 yrs
- —
Air-quality risk No data
- Unhealthy air days now
- —
- Unhealthy air days in 30 yrs
- —
Risk factors via First Street. Map © Google.
Why this score? — see what drove the B grade
The composite is a weighted blend of 9 inputs, each scored 0–100. Each bar is that input's sub-score; the figure is the points it added to the 100-point composite (weight × sub-score).
- Cash flow +30.0/30.0
- 1% rule +10.0/10.0
- DSCR +10.0/10.0
- ARV discount +7.5/15.0
- Appreciation +5.5/10.0
- Rent growth +2.5/5.0
- Condition / age +2.5/5.0
- Schools +2.4/10.0
- Livability +1.8/5.0
$36,500
🖨 Deal sheet (PDF) 📄 Offer letter ✓ Due diligence
Listing remarks
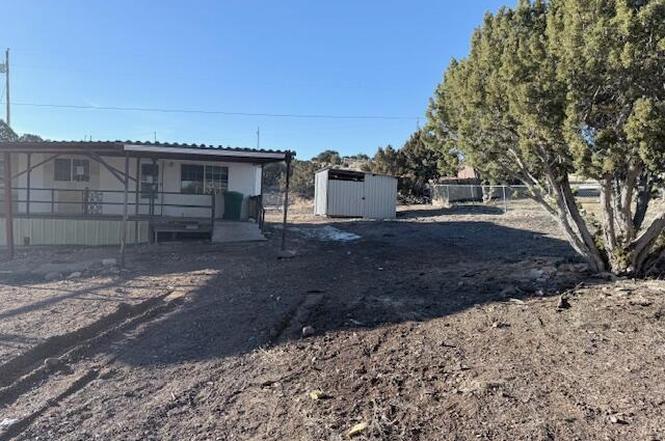
Fully fenced yard This property is waiting for new owners! If your looking for peace and quiet look no further! this one is for you. 1 bedroom 1 bath.
Key facts
- Fully fenced yard
- 0.34 acre lot
- Built 1985
Tags
Property features AI
Finance
- Other: Approximately 0.34 acre lot; County road maintenance; Zoned residential; Lease land: No
- HOA & community: No HOA; Not a 55+ community
Exterior
- Utilities: Individual metered electric; Metered water; Navopache water service; Septic tank; Power available
- Home design: Manufactured/mobile home; Single wide; One story; Property faces private land
- Construction: Manufactured construction
- Exterior features: Deck; Chain link fence; Trees on property
Interior
- Heating & cooling: Electric heating; Electric water heater
- Interior features: No fireplace; Tub/shower
Neighborhood map
What this means for you Summary
Snapshot
- This is a 1-bed/1.0-bath manufactured listed at $36k.
Deal economics
- At list price, monthly cash flow is $457 ($5k/yr) — positive.
- The deal already cash-flows at list — no discount required.
- Meets the 1% rule at list price ($898 rent vs $36k).
- Recommended offer: $32k (12.0% below list) — sets the bar for market timing.
- Cap rate 21.3% vs local median 2.6% in Concho — top-decile yield for the area; either an underpriced asset or a hidden risk that comps aren't pricing in. Stress-test before assuming the spread holds.
Location & tenants
- Location reads 36/100 on livability (#419 in AZ) — a limited-amenity area; tenant pool skews transient or value-seeking. Strengths: cost of living A+, crime A; Watch: schools F, amenities F, commute F.
- Concho Elementary District (4160) (rural): math 15% / reading 35% proficiency, ranked #340 of 501 in AZ (top 68%) — low school quality limits family demand, transient renter base, plan for 1-2y turnover; 71% free/reduced lunch — lower-income household profile, screen leases tightly.
- Market conditions: 437 active listings in the ZIP; 99 units permitted in Apache County in 2024 (0 in 5+ unit buildings).
Forward outlook
- In year one you build about $604 of equity ($252 loan paydown + $352 appreciation (1.0% local appreciation)).
- Apache County population projected at -12% by 2050 — secular population decline; favor cash flow + early exit over multi-decade hold.
- At projected returns (1.0% appreciation + 3.0% rent growth), your $10k cash investment doubles in ~2 years — after that, you're playing with house money.
Negotiation context
- It's been on market 145 days — a 12% lower offer ($32k) is reasonable based on typical stale-listing flexibility.
- Current owner paid $30k; 22% above their basis — modest negotiation headroom, anchor on the comps not their cost.
Questions for the listing agent
- It's been on market 145 days. Have you received any prior offers? Is the seller open to a 12% concession, seller financing, or rate buy-down credit?
- Why hasn't it sold? Are there any deal-killer items the seller is aware of (foundation, flood, title, zoning, code violations)?
- Is there a deadline driving the sale (1031 exchange, divorce, estate, relocation)? That informs how much negotiation room exists.
- Schools are F-rated, which usually means shorter tenancies and higher turnover. Who's the typical renter profile here, and what's been the actual vacancy rate?
- What's the average days-on-market for RENTAL listings here right now (not sales)? A rising rental-DOM trend means longer vacancies and softer asking-rent achievability than the comps imply.
- What's the recent tenant-quality profile in this submarket — average credit score on applications, eviction rate, late-payment / NSF rate, and stable-employment percentage? A property-management company in the area should have these aggregated.
- How much new for-sale + rental construction is in the pipeline within 1–3 miles? Heavy new supply typically softens prices + rents 12–24 months out; constrained supply supports both.
Investment metrics
- 1% rule
- 2.46% ✓
- Cap rate
- 21.33%
- Cash-on-cash
- 53.69%
- DSCR
- 3.39
- GRM
- 3.4
CMA / ARV
No comps found within radius.
Projected returns pro-forma
0.96% appreciation · 3.0% rent growth · sell at horizon
- IRR
- 56.4%
- Equity multiple
- 3.91×
- Total profit
- $29,752
- Equity at exit
- $12,391
- IRR
- 57.9%
- Equity multiple
- 7.87×
- Total profit
- $70,235
- Equity at exit
- $16,412
Cash invested: $10,220 (down + closing). Projections, not guarantees.
Landlord ↔ Tenant lean methodology
- Overall (STATE)
- 87 Strongly Landlord-Friendly
- State Arizona
- 87 Strongly Landlord-Friendly · R+3
- County
- — inherits STATE
- City
- — inherits STATE
ZIP-level market 85924
- Home prices YoY
- 0.5%
- Active inventory
- 437
- Price-to-rent
- 3.4×
Monthly cashflow live
- Estimated rent
- $898 medium interval (Pro) →
- Mortgage (P&I)
- −$191
- Tax est. 1.5%
- −$46 /mo · $548/yr
- Insurance
- −$15
- HOA
- −$0
- Vacancy / Maint / Mgmt
- −$189
- Net cashflow
- $457
Break-even live
Sensitivity live
| Price | -10% $482 | -5% $470 | +0% $457 | +5% $445 | +10% $432 |
|---|---|---|---|---|---|
| Rent | -10% $386 | -5% $422 | +0% $457 | +5% $493 | +10% $528 |
| Rate | -1.0pp $476 | -0.5pp $467 | base $457 | +0.5pp $448 | +1.0pp $438 |
UW: 25.0% down · 7.5% · 30yr · 1.5% tax · 5.0% vac · 8.0% maint · 8.0% mgmt
Financing live
Cash to close
- Down payment
- $9,125
- Closing costs
- $1,095
- Reserves months
- —
- Total cash needed
- —
Loan-product check · same deal, 3 products live
Conventional
25% down · 7.5% · 30yr
- Down + closing
- —
- Monthly P&I
- —
- Monthly cashflow
- —
- DSCR
- —
- Eligible?
- —
Personal DTI + credit; lowest rate.
DSCR
20% down · 8.5% · 30yr
- Down + closing
- —
- Monthly P&I
- —
- Monthly cashflow
- —
- DSCR
- —
- Eligible?
- —
No personal income docs; deal must DSCR.
Hard money
10% down · 12.0% · 12mo
- Down + closing
- —
- Monthly P&I
- —
- Monthly cashflow
- —
- DSCR
- —
- Eligible?
- —
Short-term bridge; refi at stabilization.
Listing history 21 events
-
2026-06-19days on market $36,500 Active 145 DOM
-
2026-06-18days on market $36,500 Active 144 DOM
-
2026-06-17days on market $36,500 Active 143 DOM
-
2026-06-16pricedays on market $36,500 Active 142 DOM
-
2026-06-15days on market $38,475 Active 141 DOM
-
2026-06-14days on market $38,475 Active 139 DOM
-
2026-06-12days on market $38,475 Active 138 DOM
-
2026-06-09days on market $38,475 Active 135 DOM
-
2026-06-08days on market $38,475 Active 134 DOM
-
2026-06-07days on market $38,475 Active 133 DOM
-
2026-06-07days on market $38,475 Active 132 DOM
-
2026-06-04days on market $38,475 Active 129 DOM
-
2026-06-02days on market $38,475 Active 128 DOM
-
2026-06-01days on market $38,475 Active 127 DOM
-
2026-05-31days on market $38,475 Active 126 DOM
-
2026-05-31days on market $38,475 Active 125 DOM
-
2026-05-04price $38,475
-
2026-04-02price $42,500
-
2026-03-01price $42,750
-
2026-01-26$45,000 Active
-
2002-05-28soldstatus $29,950
ⓘ Source: listings_history table (triggers on properties + properties_extension) + one-shot
backfill from property_details.listing_events for pre-trigger history.
Climate risk First Street
- Flood 1/10 Low FEMA zone D · 0% chance over 30 yrs
- Wildfire 2/10 Low
- Heat 4/10 Moderate
Nearby sold comps map
Loading sold comps map…
Walkable amenities ~0.75 mi
Loading nearby amenities…
Taxation est. · year 1
- Rental income
- $10,777
- − Mortgage interest
- −$2,045
- − Property taxes
- −$548
- − Insurance
- −$182
- − Repairs & maintenance
- −$862
- − Management
- −$862
- − Depreciation
- −$1,062
- Taxable income
- $5,216
- Est. tax owed @ 24.0%
- −$1,252
- After-tax cash flow
- $4,235/yr
For passive investors: Depreciation is non-cash, so a rental often shows a tax loss while cash-flowing — sheltering income. Rental losses are passive: they offset passive income freely, and up to $25,000/yr can offset ordinary (W-2) income if you actively participate and your MAGI is under $100k (phasing out to $0 by $150k); unused losses carry forward. On sale, claimed depreciation is recaptured at up to 25%, and gains may owe capital-gains tax (a 1031 exchange can defer both). Figures are a year-1 estimate at your 24.0% rate — not tax advice; consult a CPA.
Schools (NCES district)
- District
- Concho Elementary District (4160)
- NCES district ID
- 0402190
- Math proficiency
- 15% ▼ -15.00%
- Reading proficiency
- 35% ▬ 0.00%
- Median HH income
- $35,563
- Composite
- 23.68/100
- National rank
- #13246
- State rank
- #340 of 501 in AZ
Livability — Concho
- Score
- 36/100
- State rank
- #419
- US rank
- #27645
Category grades
Schools grade is shown separately in the Schools card above.
Census & demographics
- Population (ZIP)
- 2,336
Population outlook (Apache County) Hauer SSP2
- Today (2025)
- 70,338 people
- By 2030
- 69,279 · -1.5%
- By 2040
- 66,449 · -5.5%
- By 2050
- 61,904 · -12.0%
- By 2075
- 47,639 · -32.3%
- By 2100
- 30,279 · -57.0%
Race, ethnicity, and origin ACS 2023
- Neighborhood character
- Diverse neighborhood (Simpson 0.58)
- Race & ethnicity
- White 62% Hispanic / Latino 16% Two or more races 13% Native American 11%
- Hispanic origin (detail)
- Mexican 16%
- Common ancestry
- Slovak 4% Portuguese 3% Lithuanian 2%
- Foreign-born
- 0% · Canada
- Languages at home
- 95% English-only · Spanish 5%
Political lean MEDSL · Apache
- 2024 margin
- D (+19.0) · D 58.9% · R 40.0% · Other 1.1%
- 2008→2024 swing
- -9.2pp toward R · 2008: 28.2pp · 2024: 19.0pp
- All cycles
- 2024: D+19.0 2020: D+33.7 2016: D+36.9 2012: D+33.9 2008: D+28.2
Not yet ingested
- Civics
- —
Market trends
- HPI YoY
- ▲ 0.96%
- Current HPI
- 212.6221
- Rent YoY
- —
- Metro
- —
- State GDP YoY
- ▲ 4.54%
- F500 in state
- 20
Industry mix (Fortune 500 HQ in AZ)
| Industry | F500 HQs | Revenue |
|---|---|---|
| Technology | 2 | $13B |
|
||
| Mining / Metals | 1 | $23B |
|
||
| Environmental Services | 1 | $16B |
|
||
| Metals / Steel | 1 | $14B |
|
||
| Technology Distribution | 1 | $9B |
|
||
| Homebuilding | 1 | $8B |
|
||
Price history
+28.5% since first listed5 events — show timeline
- 2026-05-04 Price Changed $38,475 WMMLS
- 2026-04-02 Price Changed $42,500 WMMLS
- 2026-03-01 Price Changed $42,750 WMMLS
- 2026-01-26 Listed $45,000 WMMLS
- 2002-05-28 Sold (Public Records) $29,950 Public Records
Property tax history
-1.7%/yrLatest (2025): $43 · +7.1% YoY. Source: county tax records.
Cash-flow waterfall
monthlySold comps — $/sqft
last 12 mo · ≤1 miLoading sold comps…