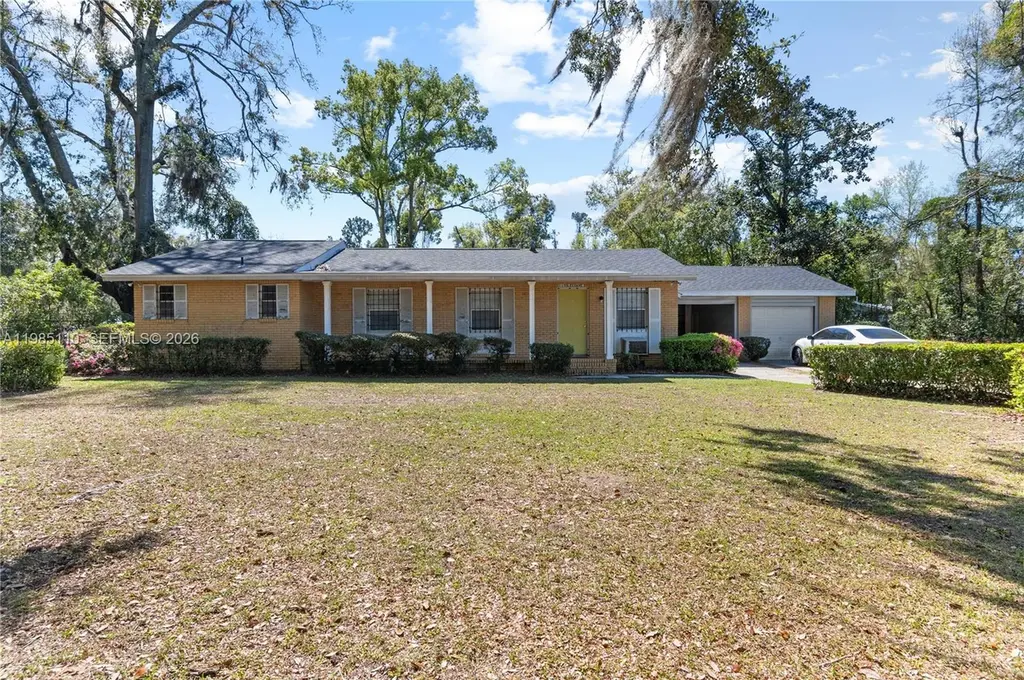
115 SW Lee Ave · Madison, FL
Flood risk 1/10 · Minimal
- FEMA flood zone
- X (unshaded)
- Chance of flooding over 30 yrs
- 0.0%
- Est. flood insurance / yr
- $507 – $1,088
Fire risk 5/10 · Moderate
- Est. fire insurance / yr
- $947 – $1,759
Heat risk 8/10 · Major
- Hot days now (above 108°F)
- 7 days/yr
- Hot days in 30 yrs
- 20 days/yr
Wind risk 9/10 · Severe
- Chance of severe wind over 30 yrs
- 99.0%
Air-quality risk 6/10 · Moderate
- Unhealthy air days now
- 11 days/yr
- Unhealthy air days in 30 yrs
- 12 days/yr
Risk factors via First Street. Map © Google.
Why this score? — see what drove the D grade
The composite is a weighted blend of 9 inputs, each scored 0–100. Each bar is that input's sub-score; the figure is the points it added to the 100-point composite (weight × sub-score).
- Cash flow +12.3/30.0
- Appreciation +10.0/10.0
- 1% rule +4.2/10.0
- DSCR +3.6/10.0
- Livability +3.5/5.0
- Schools +3.3/10.0
- Rent growth +2.5/5.0
- Condition / age +2.5/5.0
- ARV discount +0.0/15.0
$115,000
🖨 Deal sheet 📄 Offer letter ✓ Due diligence
Listing remarks
This single-family home in Madison FL offers solid bones and a functional layout, making it the perfect canvas for a fix-and-flip, rental, or long-term hold. The existing structure provides a strong foundation to reimagine and transform into the home of your dreams—whether that means creating an open-concept living space, designing a modern kitchen, upgrading finishes throughout, or adding personalized touches that truly make it your own. With plenty of room to renovate, expand, and enhance both the interior and exterior, the possibilities are endless. Situated on a spacious lot, there's ample space to create an inviting outdoor area for entertaining or relaxation. Bring your vision a
Key facts
- Strong foundation
- Functional layout
- Upgrading finishes
Tags
Property features AI
Exterior
- Parking: Attached garage; Driveway; 1 covered garage space
- Utilities: Public water; Public sewer
- Home design: Single-story home
- Construction: Brick construction; Shingle roof; Year built: Unknown
- Exterior features: Fenced yard; Quarter- to half-acre lot; Northwest-facing
Interior
- Kitchen: Built-in oven; Electric range; Refrigerator
- Bedrooms: At least one bedroom on the main level
- Flooring: Hardwood; Vinyl; Wood
- Bathrooms: 1 full bathroom; 1 half bathroom
- Heating & cooling: Central heating; Central air; Wall/window unit(s) for cooling
- Interior features: First-floor entry; Bedroom on main level; Florida room
Neighborhood map
What this means for you Summary
Snapshot
- This is a 3-bed/2.0-bath single-family listed at $115k.
Deal economics
- At list price, monthly cash flow is $-22 ($-260/yr) — negative.
- To cash-flow at today's rent, offer at most $111k (3.3% below list).
- To meet the 1% rule (rent ≥ 1% of price), the offer needs to be $106k (7.8% below list).
- Recommended offer: $105k (9.0% below list) — sets the bar for market timing.
- Cap rate 6.1% vs local median 2.6% in Madison — top-decile yield for the area; either an underpriced asset or a hidden risk that comps aren't pricing in. Stress-test before assuming the spread holds.
Location & tenants
- Location reads 70/100 on livability (#437 in FL) — a middle-class / working-renter tenant base. Strengths: cost of living A+, health & safety A+, crime A; Watch: schools C-, housing D+, amenities F.
- Madison (rural): math 39% / reading 40% proficiency, ranked #64 of 73 in FL (top 88%) — families likely to look elsewhere, expect single-tenant / working-renter base with shorter leases; 75% free/reduced lunch — lower-income household profile, screen leases tightly.
- Market conditions: 97 active listings in the ZIP; 31 units permitted in Madison County in 2024 (0 in 5+ unit buildings).
Forward outlook
- In year one you build about $12k of equity ($795 loan paydown + $12k appreciation (10.0% local appreciation)).
- Madison County population projected at -29% by 2050 — secular population decline; favor cash flow + early exit over multi-decade hold.
- At projected returns (10.0% appreciation + 3.0% rent growth), your $32k cash investment doubles in ~3 years — after that, you're playing with house money.
- By year 3, paydown + projected appreciation supports a ~$31k cash-out refi (75% LTV) — recoverable capital for the next deal without selling this one.
Negotiation context
- It's been on market 92 days — a 9% lower offer ($105k) is reasonable based on typical stale-listing flexibility.
Risks & watch-outs
- Watch-outs: built in 1950 — expect roof / HVAC / electrical / plumbing capex.
- Climate carrying-cost: severe wind risk, 99% chance of damaging wind over 30y; moderate wildfire risk; extreme-heat days projected 7→20/yr by 2055 (HVAC capex compounding) — expect insurance premiums to compound above CPI over the hold.
Questions for the listing agent
- What do current leases actually rent for vs. the listed asking? Can we see a recent rent roll and the last 12 months of T-12 income?
- It's been on market 92 days. Have you received any prior offers? Is the seller open to a 9% concession, seller financing, or rate buy-down credit?
- Built in 1950 — when were the roof, HVAC, electrical panel, plumbing, and water heater last replaced?
- Why hasn't it sold? Are there any deal-killer items the seller is aware of (foundation, flood, title, zoning, code violations)?
- Is there a deadline driving the sale (1031 exchange, divorce, estate, relocation)? That informs how much negotiation room exists.
- The area grade is low — what's the realistic commute time and amenity access for the typical tenant pool here? Any planned neighborhood developments (good or bad) we should know about?
- What's the average days-on-market for RENTAL listings here right now (not sales)? A rising rental-DOM trend means longer vacancies and softer asking-rent achievability than the comps imply.
- What's the recent tenant-quality profile in this submarket — average credit score on applications, eviction rate, late-payment / NSF rate, and stable-employment percentage? A property-management company in the area should have these aggregated.
- How much new for-sale + rental construction is in the pipeline within 1–3 miles? Heavy new supply typically softens prices + rents 12–24 months out; constrained supply supports both.
Investment metrics
- 1% rule
- 0.92% ✗
- Cap rate
- 6.07%
- Cash-on-cash
- -0.81%
- DSCR
- 0.96
- GRM
- 9.0
CMA / ARV
- ARV (on-the-fly)
- $93,264
- Comps found
- 5
Show comp detail 5 sales within ~0.75 mi
| Address | Dist | Beds/Ba | Sqft | Sold | Price | $/sf | Match |
|---|---|---|---|---|---|---|---|
| 191 SW Crosby Ave | 0.20mi | 3/1.5 | 1,062 (-1%) | 4mo | $70,000 | $66 | 84 |
| 546 SW Range Ave | 0.45mi | 3/1.0 | 1,021 (-5%) | 6mo | $124,900 | $122 | 62 |
| 125 SW Miller St | 0.25mi | 2/2.0 (-1) | 1,216 (+13%) | 7mo | $40,000 | $33 | 55 |
| 201 SE Pride St | 0.75mi | 4/1.0 (+1) | 1,050 (-2%) | 4mo | $90,937 | $87 | 50 |
| 159 SE Seminole St | 0.70mi | 2/1.0 (-1) | 981 (-8%) | 11mo | $119,000 | $121 | 35 |
Match score weights: distance 35% · size 25% · config 20% · recency 20%. Top-matched comps best support the ARV.
Projected returns pro-forma
10.0% appreciation · 3.0% rent growth · sell at horizon
- IRR
- 23.7%
- Equity multiple
- 2.90×
- Total profit
- $61,307
- Equity at exit
- $103,601
- IRR
- 21.1%
- Equity multiple
- 6.64×
- Total profit
- $181,735
- Equity at exit
- $223,420
Cash invested: $32,200 (down + closing). Projections, not guarantees.
Landlord ↔ Tenant lean methodology
- Overall (STATE)
- 87 Strongly Landlord-Friendly
- State Florida
- 87 Strongly Landlord-Friendly · R+3
- County
- — inherits STATE
- City
- — inherits STATE
ZIP-level market 32340
- Home prices YoY
- 32.0%
- Active inventory
- 97
- Price-to-rent
- 9.0×
Monthly cashflow live
- Estimated rent
- $1,060 medium interval (Pro) →
- Mortgage (P&I)
- −$603
- Tax from tax record
- −$208 /mo · $2,502/yr
- Insurance
- −$48
- HOA
- −$0
- Vacancy / Maint / Mgmt
- −$223
- Net cashflow
- $-22
Break-even live
UW: 25.0% down · 7.5% · 30yr · 1.5% tax · 5.0% vac · 8.0% maint · 8.0% mgmt
Financing live
Cash to close
- Down payment
- $28,750
- Closing costs
- $3,450
- Reserves months
- —
- Total cash needed
- —
Loan-product check · same deal, 3 products live
Conventional
25% down · 7.5% · 30yr
- Down + closing
- —
- Monthly P&I
- —
- Monthly cashflow
- —
- DSCR
- —
- Eligible?
- —
Personal DTI + credit; lowest rate.
DSCR
20% down · 8.5% · 30yr
- Down + closing
- —
- Monthly P&I
- —
- Monthly cashflow
- —
- DSCR
- —
- Eligible?
- —
No personal income docs; deal must DSCR.
Hard money
10% down · 12.0% · 12mo
- Down + closing
- —
- Monthly P&I
- —
- Monthly cashflow
- —
- DSCR
- —
- Eligible?
- —
Short-term bridge; refi at stabilization.
Listing history 20 events
-
2026-06-19days on market $115,000 Active 92 DOM
-
2026-06-17days on market $115,000 Active 91 DOM
-
2026-06-16days on market $115,000 Active 90 DOM
-
2026-06-15days on market $115,000 Active 89 DOM
-
2026-06-14days on market $115,000 Active 87 DOM
-
2026-06-13days on market $115,000 Active 86 DOM
-
2026-06-10days on market $115,000 Active 84 DOM
-
2026-06-09days on market $115,000 Active 83 DOM
-
2026-06-08days on market $115,000 Active 82 DOM
-
2026-06-07days on market $115,000 Active 81 DOM
-
2026-06-05days on market $115,000 Active 78 DOM
-
2026-06-03days on market $115,000 Active 77 DOM
-
2026-06-02days on market $115,000 Active 76 DOM
-
2026-06-01days on market $115,000 Active 75 DOM
-
2026-05-31days on market $115,000 Active 74 DOM
-
2026-05-30days on market $115,000 Active 73 DOM
-
2026-04-29price $120,000
-
2026-04-14price $125,000
-
2026-04-01price $135,000
-
2026-03-18$145,000 Active
ⓘ Source: listings_history table (triggers on properties + properties_extension) + one-shot
backfill from property_details.listing_events for pre-trigger history.
Tax reassessment forecast FL · Resets to sale price
- Current annual tax
- $2,502 · $208/mo
- Projected year-2 tax
- $2,502 · $208/mo
- Expected delta
- $0/yr ($0/mo · 0.0%)
ⓘ Screening estimate from a state-policy table — verify with the county assessor before closing.
Climate risk First Street
- Flood 1/10 Low FEMA zone X (unshaded) · 0% chance over 30 yrs
- Wildfire 5/10 Major
- Heat 8/10 Severe 7 d/yr ≥108°F today · 20 d/yr by 30 yrs out
- Wind 9/10 Extreme 99% chance of damaging wind over 30 yrs
- Air quality 6/10 Major 11 unhealthy d/yr today · 12 by 30 yrs out
Nearby sold comps map
Loading sold comps map…
Walkable amenities ~0.75 mi
Loading nearby amenities…
Taxation est. · year 1
- Rental income
- $12,726
- − Mortgage interest
- −$6,442
- − Property taxes
- −$2,502
- − Insurance
- −$575
- − Repairs & maintenance
- −$1,018
- − Management
- −$1,018
- − Depreciation
- −$3,345
- Taxable loss
- −$2,174
- Est. tax savings @ 24.0%
- +$522
- After-tax cash flow
- $262/yr
For passive investors: Depreciation is non-cash, so a rental often shows a tax loss while cash-flowing — sheltering income. Rental losses are passive: they offset passive income freely, and up to $25,000/yr can offset ordinary (W-2) income if you actively participate and your MAGI is under $100k (phasing out to $0 by $150k); unused losses carry forward. On sale, claimed depreciation is recaptured at up to 25%, and gains may owe capital-gains tax (a 1031 exchange can defer both). Figures are a year-1 estimate at your 24.0% rate — not tax advice; consult a CPA.
Schools (NCES district)
- District
- Madison
- NCES district ID
- 1201200
- Math proficiency
- 39% ▼ -5.00%
- Reading proficiency
- 40% ▼ -2.00%
- Median HH income
- $33,925
- Composite
- 32.54/100
- National rank
- #5693
- State rank
- #64 of 73 in FL
Livability — Madison
- Score
- 70/100
- State rank
- #437
- US rank
- #7819
Category grades
Schools grade is shown separately in the Schools card above.
Census & demographics
- Census place
- Madison, FL
- Population (ZIP)
- 10,424
Population outlook (Madison County) Hauer SSP2
- Today (2025)
- 16,849 people
- By 2030
- 15,883 · -5.7%
- By 2040
- 13,861 · -17.7%
- By 2050
- 11,918 · -29.3%
- By 2075
- 7,810 · -53.6%
- By 2100
- 4,684 · -72.2%
Race, ethnicity, and origin ACS 2023
- Neighborhood character
- Diverse neighborhood (Simpson 0.56)
- Race & ethnicity
- White 50% Black 43% Two or more races 5% Hispanic / Latino 3%
- Common ancestry
- Slovak 1% Iranian 1% Serbian 1%
- Foreign-born
- 2% · Canada
- Languages at home
- 97% English-only · Spanish 2%
Political lean MEDSL · Madison
- 2024 margin
- Strong R (+28.9) · D 35.3% · R 64.2%
- 2008→2024 swing
- -25.8pp toward R · 2008: -3.1pp · 2024: -28.9pp
- All cycles
- 2024: R+28.9 2020: R+19.5 2016: R+15.6 2012: R+3.4 2008: R+3.1
Not yet ingested
- Civics
- —
Market trends
- HPI YoY
- ▲ 65.13%
- Current HPI
- 268.8459
- Rent YoY
- —
- Metro
- —
- State GDP YoY
- ▲ 3.28%
- F500 in state
- 36
Industry mix (Fortune 500 HQ in FL)
| Industry | F500 HQs | Revenue |
|---|---|---|
| Industrial Technology | 2 | $29B |
|
||
| Insurance | 2 | $17B |
|
||
| Retail | 1 | $60B |
|
||
| Technology Distribution | 1 | $58B |
|
||
| Homebuilding | 1 | $35B |
|
||
| Technology Manufacturing | 1 | $35B |
|
||
Price history
-17.2% since first listed4 events — show timeline
- 2026-04-29 Price Changed $120,000 MARMLS
- 2026-04-14 Price Changed $125,000 MARMLS
- 2026-04-01 Price Changed $135,000 MARMLS
- 2026-03-18 Listed $145,000 MARMLS
Property tax history
+15.7%/yrLatest (2025): $2,502 · +4.7% YoY. Source: county tax records.
Cash-flow waterfall
monthlySold comps — $/sqft
last 12 mo · ≤1 miLoading sold comps…