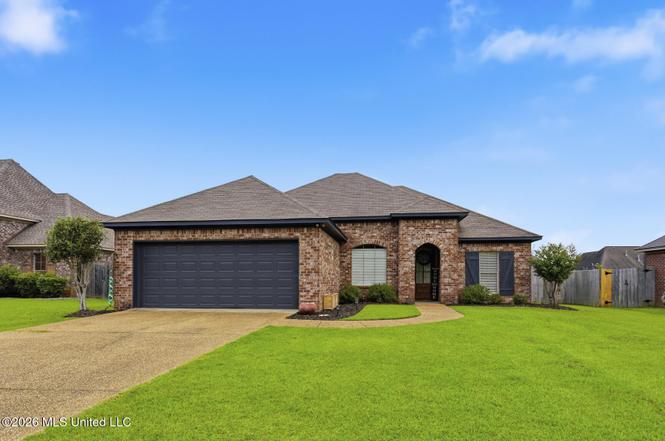
179 Beechwood Cir · Pearl, MS
Flood risk 1/10 · Minimal
- FEMA flood zone
- X (unshaded)
- Chance of flooding over 30 yrs
- 0.0%
- Est. flood insurance / yr
- $507 – $1,088
Fire risk 4/10 · Minor
- Est. fire insurance / yr
- $1,241 – $2,305
Heat risk 7/10 · Major
- Hot days now (above 109°F)
- 7 days/yr
- Hot days in 30 yrs
- 20 days/yr
Wind risk 8/10 · Major
- Chance of severe wind over 30 yrs
- 80.0%
Air-quality risk 2/10 · Minimal
- Unhealthy air days now
- 0 days/yr
- Unhealthy air days in 30 yrs
- 1 days/yr
Risk factors via First Street. Map © Google.
Why this score? — see what drove the D+ grade
The composite is a weighted blend of 9 inputs, each scored 0–100. Each bar is that input's sub-score; the figure is the points it added to the 100-point composite (weight × sub-score).
- Cash flow +16.1/30.0
- ARV discount +7.2/15.0
- DSCR +5.0/10.0
- Schools +4.6/10.0
- Rent growth +4.1/5.0
- Livability +3.7/5.0
- 1% rule +3.3/10.0
- Condition / age +2.5/5.0
- Appreciation +0.0/10.0
$265,000
🖨 Deal sheet (PDF) 📄 Offer letter ✓ Due diligence
Listing remarks MLS
Don't snooze on this adorable home in Live Oaks! New to the market, all the features you'd expect in a custom home but at an affordable price. House shows very well. Hardwood flooring in the family room, ceramic in kitchen and baths. Currently one bedroom is being used as a game room. Home has been well maintained. Master bath has double sinks, double walk-in closets, whirlpool tub with separate shower. Large master. Kitchen has a pantry and there's a convenient coat rack/cubbie by the garage door entrance. Linen storage, coat storage, fully fenced yard. Move in ready! Seller will even leave the above ground pool, just in time for summer fun. Call today for an appointment. Pearl address but Brandon schools.
Key facts
- Hardwood flooring
- Whirlpool tub
- Ceramic tile
Tags
Property features AI
Finance
- HOA & community: Homeowners association with fees covering accounting/legal, grounds maintenance, and management
Exterior
- Parking: 2-car garage
- Utilities: Public water; Public sewer; Electricity connected; Water connected; Sewer connected
- Home design: Single-family house; One story; Living area about 1,520 (per appraiser)
- Construction: Brick construction; Slab foundation; Year built from public records
- Exterior features: Architectural shingle roof; Lot approximately 0.25 acre
Interior
- Kitchen: Dishwasher; Disposal; Microwave; Water heater
- Bathrooms: 2 full bathrooms
- Heating & cooling: Central heating; Fireplace heating; Central air conditioning; Ceiling fans
- Interior features: Fireplace with gas log in den; Move-in ready condition
Neighborhood map
What this means for you Summary
Snapshot
- This is a 3-bed/2.0-bath single-family listed at $265k.
Deal economics
- At list price, monthly cash flow is $137 ($2k/yr) — positive.
- The deal already cash-flows at list — no discount required.
- To meet the 1% rule (rent ≥ 1% of price), the offer needs to be $220k (16.8% below list).
- Recommended offer: $220k (16.8% below list) — sets the bar for 1% rule.
- Cap rate 6.9% vs local median 5.5% in Pearl — meaningfully above typical; check what's discounted (condition, days-on-market, listing class) to confirm the premium yield is real.
Location & tenants
- Location reads 73/100 on livability (#19 in MS) — a middle-class / working-renter tenant base. Strengths: cost of living A+, housing A+, health & safety A+; Watch: amenities F, commute F, employment D-.
- Rankin County School District (rural): math 56% / reading 48% proficiency, ranked #6 of 130 in MS (top 5%) — acceptable for families but not a draw, mixed tenant base, ~2y average lease.
- Zoned schools: Rouse Elementary (797 students, 100% FRL); Brandon Middle School (math 67% / reading 49%, grade B, #11 of 179 statewide, top 6%, 1,193 students, 100% FRL); Brandon High School (math 47% / reading 49%, grade D, #27 of 197 statewide, top 13%, 1,648 students, 100% FRL) — zoned schools average 100% FRL vs 35% district-wide (65 pts higher); higher-poverty schools than district average — tighter screening recommended.
- Market conditions: Rents rising fast (+6.3%/yr); 277 active listings in the ZIP; 5 comparable units currently listed for rent nearby; rentals at typical pace (median 16d on market — plan ~3-4 weeks tenant-placement turnaround); 343 units permitted in Rankin County in 2024 (0 in 5+ unit buildings).
- This rent runs 40% of the median local income ($65k/yr) — at the standard rent-burdened threshold; future hikes will face affordability resistance.
Forward outlook
- Local home prices are declining (-3.0%/yr); year-one equity from $2k of loan paydown is wiped out by about $8k of value loss. Plan a longer hold.
- Rankin County population projected at +17% by 2050 — long-run rental-demand tailwind backs the buy-and-hold thesis.
Negotiation context
- Only 3 days on market — expect competitive offers; lowballing is unlikely to land.
- 4 sale attempts since 15y ago with the ask held roughly flat each time — persistent listings suggest the price (not the market) is what's stuck; bring a comps-based counter.
Risks & watch-outs
- Climate carrying-cost: severe wind risk, 80% chance of damaging wind over 30y; extreme-heat days projected 7→20/yr by 2055 (HVAC capex compounding) — expect insurance premiums to compound above CPI over the hold.
Questions for the listing agent
- Is there a deadline driving the sale (1031 exchange, divorce, estate, relocation)? That informs how much negotiation room exists.
- Schools are D-rated, which usually means shorter tenancies and higher turnover. Who's the typical renter profile here, and what's been the actual vacancy rate?
- The area grade is low — what's the realistic commute time and amenity access for the typical tenant pool here? Any planned neighborhood developments (good or bad) we should know about?
- What's the average days-on-market for RENTAL listings here right now (not sales)? A rising rental-DOM trend means longer vacancies and softer asking-rent achievability than the comps imply.
- What's the recent tenant-quality profile in this submarket — average credit score on applications, eviction rate, late-payment / NSF rate, and stable-employment percentage? A property-management company in the area should have these aggregated.
- How much new for-sale + rental construction is in the pipeline within 1–3 miles? Heavy new supply typically softens prices + rents 12–24 months out; constrained supply supports both.
Investment metrics
- 1% rule
- 0.83% ✗
- Cap rate
- 6.91%
- Cash-on-cash
- 2.22%
- DSCR
- 1.10
- GRM
- 10.0
CMA / ARV
- ARV (on-the-fly)
- $263,306
- Comps found
- 12
Show comp detail 12 sales within ~0.75 mi
| Address | Dist | Beds/Ba | Sqft | Sold | Price | $/sf | Match |
|---|---|---|---|---|---|---|---|
| 154 Beechwood Cir | 0.18mi | 3/2.0 | 1,558 (+2%) | 5mo | $259,900 | $167 | 83 |
| 104 Oak Grove Ct | 0.31mi | 3/2.5 | 1,513 (-1%) | 2mo | $248,000 | $164 | 81 |
| 106 Ash Ridge Pl | 0.13mi | 3/2.0 | 1,386 (-9%) | 3mo | $249,900 | $180 | 76 |
| 1108 Spanish Oak Dr | 0.15mi | 3/2.0 | 1,356 (-11%) | 2mo | $235,000 | $173 | 73 |
| 220 White Oak Pl | 0.34mi | 3/2.0 | 1,410 (-7%) | 1mo | $242,300 | $172 | 71 |
| 628 Oak Ridge Way | 0.27mi | 3/2.0 | 1,364 (-10%) | 3mo | $249,900 | $183 | 68 |
| 1076 Spanish Oak Dr | 0.21mi | 4/2.0 (+1) | 1,661 (+9%) | 4mo | $279,000 | $168 | 67 |
| 336 Willow Run | 0.33mi | 3/2.0 | 1,343 (-12%) | 0mo | $219,900 | $164 | 65 |
| 316 London Way | 0.66mi | 3/2.0 | 1,503 (-1%) | 4mo | $260,000 | $173 | 64 |
| 577 Oak Ridge Way | 0.43mi | 3/2.0 | 1,350 (-11%) | 2mo | $240,000 | $178 | 59 |
| 217 White Oak Pl | 0.38mi | 3/2.0 | 1,312 (-14%) | 5mo | $232,000 | $177 | 55 |
| 308 London Way | 0.71mi | 3/2.0 | 1,627 (+7%) | 4mo | $265,000 | $163 | 52 |
Match score weights: distance 35% · size 25% · config 20% · recency 20%. Top-matched comps best support the ARV.
Projected returns pro-forma
-3.0% appreciation · 6.34% rent growth · sell at horizon
- IRR
- -9.5%
- Equity multiple
- 0.64×
- Total profit
- $-26,647
- Equity at exit
- $39,512
- IRR
- 3.5%
- Equity multiple
- 1.29×
- Total profit
- $21,274
- Equity at exit
- $22,912
Cash invested: $74,200 (down + closing). Projections, not guarantees.
Landlord ↔ Tenant lean methodology
- Overall (STATE)
- 90 Strongly Landlord-Friendly
- State Mississippi
- 90 Strongly Landlord-Friendly · R+11
- County
- — inherits STATE
- City
- — inherits STATE
ZIP-level market 39208
- Home prices YoY
- -20.3%
- Rents YoY
- 6.3%
- Active inventory
- 277
- Price-to-rent
- 10.0×
Monthly cashflow live
- Estimated rent
- $2,204 medium interval (Pro) →
- Mortgage (P&I)
- −$1,390
- Tax from tax record
- −$104 /mo · $1,247/yr
- Insurance
- −$110
- HOA
- −$0
- Vacancy / Maint / Mgmt
- −$463
- Net cashflow
- $137
Break-even live
Sensitivity live
| Price | -10% $287 | -5% $212 | +0% $137 | +5% $62 | +10% $-13 |
|---|---|---|---|---|---|
| Rent | -10% $-37 | -5% $50 | +0% $137 | +5% $224 | +10% $311 |
| Rate | -1.0pp $271 | -0.5pp $205 | base $137 | +0.5pp $69 | +1.0pp $-1 |
UW: 25.0% down · 7.5% · 30yr · 1.5% tax · 5.0% vac · 8.0% maint · 8.0% mgmt
Financing live
Cash to close
- Down payment
- $66,250
- Closing costs
- $7,950
- Reserves months
- —
- Total cash needed
- —
Loan-product check · same deal, 3 products live
Conventional
25% down · 7.5% · 30yr
- Down + closing
- —
- Monthly P&I
- —
- Monthly cashflow
- —
- DSCR
- —
- Eligible?
- —
Personal DTI + credit; lowest rate.
DSCR
20% down · 8.5% · 30yr
- Down + closing
- —
- Monthly P&I
- —
- Monthly cashflow
- —
- DSCR
- —
- Eligible?
- —
No personal income docs; deal must DSCR.
Hard money
10% down · 12.0% · 12mo
- Down + closing
- —
- Monthly P&I
- —
- Monthly cashflow
- —
- DSCR
- —
- Eligible?
- —
Short-term bridge; refi at stabilization.
Rent comps 5 comps
| Address | Beds | Baths | Sqft | Rent | $/sqft | DOM | Units | Dist |
|---|---|---|---|---|---|---|---|---|
| 102 Red Oak Cv Pearl, MS | 3.0 | 2.0 | 1414 | $2,031 | $1.44 | 16d | 1 | 0.55mi |
| 103 Cedar Ridge Blvd Pearl, MS | 3.0 | 2.0 | 1792 | $1,000 | $0.56 | 23d | 1 | 0.94mi |
| 573 Patrick Farms Dr Pearl, MS | 3.0 | 2.0 | 1910 | $2,700 | $1.41 | 16d | 1 | 1.21mi |
| 548 Patrick Farms Dr Pearl, MS | 4.0 | 2.0 | 1850 | $2,800 | $1.51 | 16d | 1 | 1.23mi |
| 563 Patrick Farms Dr Pearl, MS | 3.0 | 2.0 | 1810 | $2,387 | $1.32 | 16d | 1 | 1.49mi |
Listing history 3 events
-
2026-06-22days on market $265,000 Active 3 DOM
-
2026-06-18remarks 699-char remark
-
2026-06-18$265,000 Active 1 DOM
ⓘ Source: listings_history table (triggers on properties + properties_extension) + one-shot
backfill from property_details.listing_events for pre-trigger history.
Tax reassessment forecast MS · Resets to sale price
- Current annual tax
- $1,247 · $104/mo
- Projected year-2 tax
- $2,094 · $174/mo
- Expected delta
- +$847/yr (+$71/mo · 67.9%)
ⓘ Screening estimate from a state-policy table — verify with the county assessor before closing.
Climate risk First Street
- Flood 1/10 Low FEMA zone X (unshaded) · 0% chance over 30 yrs
- Wildfire 4/10 Moderate
- Heat 7/10 Severe 7 d/yr ≥109°F today · 20 d/yr by 30 yrs out
- Wind 8/10 Severe 80% chance of damaging wind over 30 yrs
- Air quality 2/10 Low 0 unhealthy d/yr today · 1 by 30 yrs out
Nearby sold comps map
Loading sold comps map…
Walkable amenities ~0.75 mi
Loading nearby amenities…
Taxation est. · year 1
- Rental income
- $26,450
- − Mortgage interest
- −$14,844
- − Property taxes
- −$1,247
- − Insurance
- −$1,325
- − Repairs & maintenance
- −$2,116
- − Management
- −$2,116
- − Depreciation
- −$7,709
- Taxable loss
- −$2,907
- Est. tax savings @ 24.0%
- +$698
- After-tax cash flow
- $2,345/yr
For passive investors: Depreciation is non-cash, so a rental often shows a tax loss while cash-flowing — sheltering income. Rental losses are passive: they offset passive income freely, and up to $25,000/yr can offset ordinary (W-2) income if you actively participate and your MAGI is under $100k (phasing out to $0 by $150k); unused losses carry forward. On sale, claimed depreciation is recaptured at up to 25%, and gains may owe capital-gains tax (a 1031 exchange can defer both). Figures are a year-1 estimate at your 24.0% rate — not tax advice; consult a CPA.
Schools (NCES district)
- District
- Rankin County School District
- NCES district ID
- 2803830
- Math proficiency
- 56% ▼ -4.00%
- Reading proficiency
- 48% ▼ -6.00%
- Median HH income
- $61,867
- Composite
- 45.62/100
- National rank
- #2587
- State rank
- #6 of 130 in MS
Livability — Pearl
- Score
- 73/100
- State rank
- #19
- US rank
- #5662
Category grades
Schools grade is shown separately in the Schools card above.
Census & demographics
- County
- Rankin County · 123,614 people
- City population
- 34,442
- Metro
- Jackson, MS
- Population (ZIP)
- 34,442
- Household income
- $65,480
- Rent vs Own
- Severe rent burden
- 1235.0
Population outlook (Rankin County) Hauer SSP2
- Today (2025)
- 164,317 people
- By 2030
- 171,013 · +4.1%
- By 2040
- 182,723 · +11.2%
- By 2050
- 192,376 · +17.1%
- By 2075
- 209,535 · +27.5%
- By 2100
- 209,534 · +27.5%
Race, ethnicity, and origin ACS 2023
- Neighborhood character
- Majority White (60%)
- Race & ethnicity
- White 60% Black 31% Hispanic / Latino 5% Two or more races 3% Asian 2%
- Common ancestry
- Italian 5% Slovak 1% Serbian 1%
- Foreign-born
- 3% · Canada, China
- Languages at home
- 93% English-only · Spanish 4% Other Indo-European 1% Other Asian/Pacific 1%
Political lean MEDSL · Rankin
- 2024 margin
- Solid R (+47.1) · D 25.9% · R 73.0% · Other 1.0%
- 2008→2024 swing
- +6.4pp toward D · 2008: -53.5pp · 2024: -47.1pp
- All cycles
- 2024: R+47.1 2020: R+45.4 2016: R+52.9 2012: R+51.9 2008: R+53.5
Not yet ingested
- Civics
- —
Market trends
- HPI YoY
- ▼ -49.11%
- Current HPI
- 193.0609
- Rent YoY
- ▲ 6.34%
- Metro
- Jackson, MS
- State GDP YoY
- —
- F500 in state
- 0
Price history
+65.7% since first listed8 events — show timeline
- 2026-06-18 Listed $265,000 MLSU
- 2021-10-08 Listing Removed — MLSU
- 2020-06-29 Sold (Public Records) — Public Records
- 2020-06-29 Sold (MLS) — MLSU
- 2020-05-21 Listed $183,000 MLSU
- 2013-10-24 Sold (MLS) — MLSU
- 2013-08-20 Listed $158,500 MLSU
- 2011-02-28 Listed $159,900 MLSU
Property tax history
-3.0%/yrLatest (2025): $1,247 · +2.3% YoY. Source: county tax records.
Cash-flow waterfall
monthlySold comps — $/sqft
last 12 mo · ≤1 miLoading sold comps…