 🏷️ Likely Rental
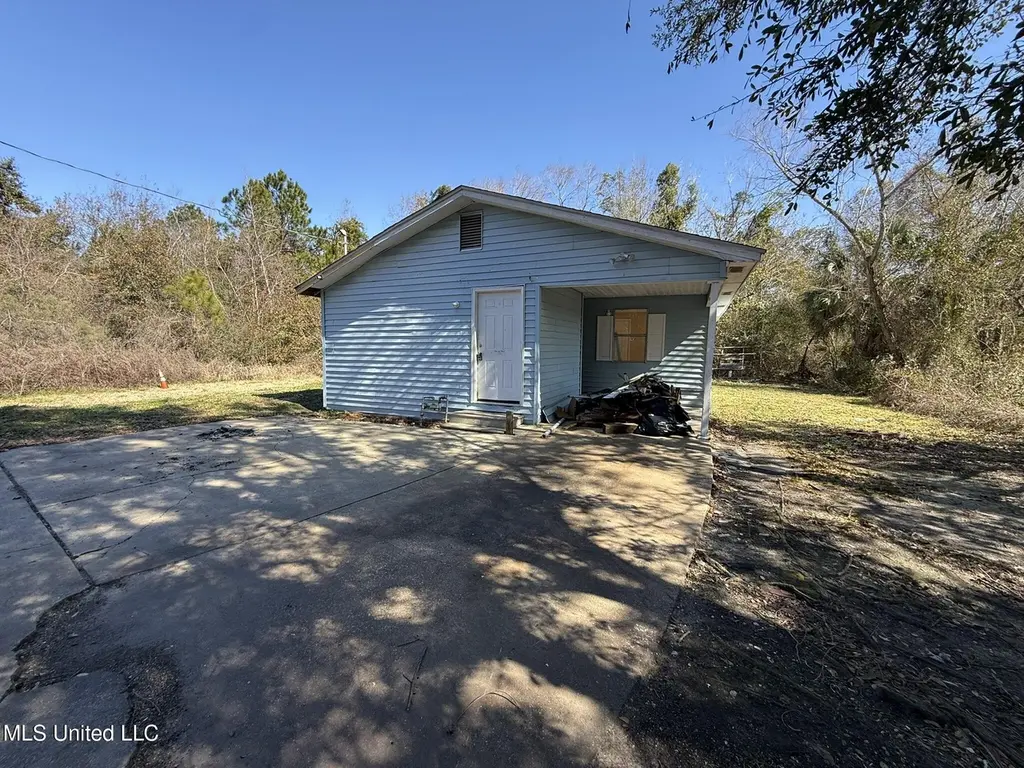
2519 29th Ave · Gulfport, MS
Flood risk 4/10 · Minor
- FEMA flood zone
- X (unshaded)
- Chance of flooding over 30 yrs
- 0.13%
- Est. flood insurance / yr
- $507 – $1,088
Fire risk 2/10 · Minimal
- Est. fire insurance / yr
- $1,241 – $2,305
Heat risk 10/10 · Severe
- Hot days now (above 106°F)
- 7 days/yr
- Hot days in 30 yrs
- 23 days/yr
Wind risk 9/10 · Severe
- Chance of severe wind over 30 yrs
- 99.0%
Air-quality risk 1/10 · Minimal
- Unhealthy air days now
- 0 days/yr
- Unhealthy air days in 30 yrs
- 0 days/yr
Risk factors via First Street. Map © Google.
Why this score? — see what drove the B+ grade
The composite is a weighted blend of 9 inputs, each scored 0–100. Each bar is that input's sub-score; the figure is the points it added to the 100-point composite (weight × sub-score).
- Cash flow +30.0/30.0
- ARV discount +15.0/15.0
- 1% rule +10.0/10.0
- DSCR +10.0/10.0
- Rent growth +5.0/5.0
- Livability +3.7/5.0
- Schools +3.4/10.0
- Condition / age +2.5/5.0
- Appreciation +0.0/10.0
$75,000
🖨 Deal sheet (PDF) 📄 Offer letter ✓ Due diligence
Listing remarks MLS
Great investment opportunity in a prime location near the Seabee Base, just north of Pass Road in Gulfport. Currently leased at $1100 per month. Part of a portfolio of 4 homes for which the seller would entertain a package deal. Don't let this one get away!
Key facts
- Covered carport
- Prime location
- Outdoor living space
Tags
Neighborhood map
What this means for you Summary
Snapshot
- This is a 2-bed/1.0-bath single-family listed at $75k.
Deal economics
- At list price, monthly cash flow is $473 ($6k/yr) — positive.
- The deal already cash-flows at list — no discount required.
- Meets the 1% rule at list price ($1k rent vs $75k).
- Recommended offer: $68k (9.0% below list) — sets the bar for market timing.
- Cap rate 13.9% vs local median 4.9% in Gulfport — top-decile yield for the area; either an underpriced asset or a hidden risk that comps aren't pricing in. Stress-test before assuming the spread holds.
Location & tenants
- Location reads 73/100 on livability (#15 in MS) — a middle-class / working-renter tenant base. Strengths: cost of living A+, housing A+, health & safety A+; Watch: schools D, amenities F, commute F.
- Gulfport School District (urban): math 41% / reading 42% proficiency, ranked #37 of 130 in MS (top 28%) — families likely to look elsewhere, expect single-tenant / working-renter base with shorter leases; 67% free/reduced lunch — lower-income household profile, screen leases tightly.
- Market conditions: Rents rising fast (+10.5%/yr); 252 active listings in the ZIP; 23 comparable units currently listed for rent nearby; rentals lingering (median 45d on market — plan ~5-8 weeks vacancy on turnover, expect pricing pressure); 57% of comp listings sitting > 30 days — soft ceiling on asking rent; lower-income renter base — watch delinquency; 2,194 units permitted in Harrison County in 2024 (0 in 5+ unit buildings).
- This rent runs 42% of the median local income ($35k/yr) — at the standard rent-burdened threshold; future hikes will face affordability resistance.
Forward outlook
- Local home prices are declining (-3.0%/yr); year-one equity from $519 of loan paydown is wiped out by about $2k of value loss. Plan a longer hold.
- Harrison County population projected at +27% by 2050 — long-run rental-demand tailwind backs the buy-and-hold thesis.
- At projected returns (-3.0% appreciation + 8.0% rent growth), your $21k cash investment doubles in ~4 years — after that, you're playing with house money.
Negotiation context
- It's been on market 94 days — a 9% lower offer ($68k) is reasonable based on typical stale-listing flexibility.
- 5 sale attempts since 10y ago with the ask held roughly flat each time — persistent listings suggest the price (not the market) is what's stuck; bring a comps-based counter.
- Current owner paid $24k; list at $75k implies a 212% gain — meaningful room to come down on a strong offer.
Risks & watch-outs
- Watch-outs: built in 1948 — expect roof / HVAC / electrical / plumbing capex.
- Climate carrying-cost: severe wind risk, 99% chance of damaging wind over 30y; extreme-heat days projected 7→23/yr by 2055 (HVAC capex compounding) — expect insurance premiums to compound above CPI over the hold.
Questions for the listing agent
- It's been on market 94 days. Have you received any prior offers? Is the seller open to a 9% concession, seller financing, or rate buy-down credit?
- Built in 1948 — when were the roof, HVAC, electrical panel, plumbing, and water heater last replaced?
- Why hasn't it sold? Are there any deal-killer items the seller is aware of (foundation, flood, title, zoning, code violations)?
- Is there a deadline driving the sale (1031 exchange, divorce, estate, relocation)? That informs how much negotiation room exists.
- Schools are D-rated, which usually means shorter tenancies and higher turnover. Who's the typical renter profile here, and what's been the actual vacancy rate?
- What's the average days-on-market for RENTAL listings here right now (not sales)? A rising rental-DOM trend means longer vacancies and softer asking-rent achievability than the comps imply.
- What's the recent tenant-quality profile in this submarket — average credit score on applications, eviction rate, late-payment / NSF rate, and stable-employment percentage? A property-management company in the area should have these aggregated.
- How much new for-sale + rental construction is in the pipeline within 1–3 miles? Heavy new supply typically softens prices + rents 12–24 months out; constrained supply supports both.
Investment metrics
- 1% rule
- 1.63% ✓
- Cap rate
- 13.87%
- Cash-on-cash
- 27.05%
- DSCR
- 2.20
- GRM
- 5.1
CMA / ARV
- ARV (median comp)
- $98,802
- List price
- $75,000
- Delta
- -24.09%
- Verdict
- UNDERPRICED
- Comps
- 20 within 1.0 mi
Show comp detail 12 sales within ~0.75 mi
| Address | Dist | Beds/Ba | Sqft | Sold | Price | $/sf | Match |
|---|---|---|---|---|---|---|---|
| 3307 20th St | 0.55mi | 2/1.0 | 1,052 (-1%) | 1mo | $35,000 | $33 | 72 |
| 3617 22nd St | 0.63mi | 3/1.0 (+1) | 1,051 (-1%) | 10mo | $74,900 | $71 | 55 |
| 2308 24th Ave | 0.39mi | 1/1.0 (-1) | 1,107 (+4%) | 21mo | $92,000 | $83 | 52 |
| 1915 21st Ave | 0.74mi | 2/1.0 | 1,027 (-3%) | 12mo | $69,000 | $67 | 50 |
| 2222 29th St | 0.52mi | 2/1.0 | 1,000 (-6%) | 19mo | $120,000 | $120 | 50 |
| 2317 30th St | 0.50mi | 2/1.0 | 1,164 (+10%) | 16mo | $120,000 | $103 | 47 |
| 2206 33rd Ave | 0.38mi | 3/1.0 (+1) | 962 (-9%) | 19mo | $89,000 | $93 | 46 |
| 2200 32nd St | 0.74mi | 3/1.0 (+1) | 1,023 (-4%) | 18mo | $115,000 | $112 | 40 |
| 2114 19th St | 0.74mi | 3/1.0 (+1) | 1,155 (+9%) | 9mo | $165,000 | $143 | 39 |
| 2412 19th St | 0.59mi | 2/1.0 | 910 (-14%) | 13mo | $99,900 | $110 | 38 |
| 2915 23rd Ave | 0.49mi | 3/2.0 (+1) | 1,200 (+13%) | 14mo | $149,900 | $125 | 34 |
| 2601 19th Ave | 0.72mi | 2/1.0 | 1,216 (+14%) | 11mo | $88,800 | $73 | 33 |
Match score weights: distance 35% · size 25% · config 20% · recency 20%. Top-matched comps best support the ARV.
Projected returns pro-forma
-3.0% appreciation · 8.0% rent growth · sell at horizon
- IRR
- 26.4%
- Equity multiple
- 2.17×
- Total profit
- $24,467
- Equity at exit
- $11,183
- IRR
- 36.9%
- Equity multiple
- 5.27×
- Total profit
- $89,585
- Equity at exit
- $6,485
Cash invested: $21,000 (down + closing). Projections, not guarantees.
Landlord ↔ Tenant lean methodology
- Overall (STATE)
- 90 Strongly Landlord-Friendly
- State Mississippi
- 90 Strongly Landlord-Friendly · R+11
- County
- — inherits STATE
- City
- — inherits STATE
ZIP-level market 39501
- Home prices YoY
- -34.5%
- Rents YoY
- 10.5%
- Active inventory
- 252
- Price-to-rent
- 5.1×
Monthly cashflow live
- Estimated rent
- $1,224 high interval (Pro) →
- Mortgage (P&I)
- −$393
- Tax from tax record
- −$69 /mo · $831/yr
- Insurance
- −$31
- HOA
- −$0
- Vacancy / Maint / Mgmt
- −$257
- Net cashflow
- $473
Break-even live
Sensitivity live
| Price | -10% $516 | -5% $495 | +0% $473 | +5% $452 | +10% $431 |
|---|---|---|---|---|---|
| Rent | -10% $377 | -5% $425 | +0% $473 | +5% $522 | +10% $570 |
| Rate | -1.0pp $511 | -0.5pp $492 | base $473 | +0.5pp $454 | +1.0pp $434 |
UW: 25.0% down · 7.5% · 30yr · 1.5% tax · 5.0% vac · 8.0% maint · 8.0% mgmt
Financing live
Cash to close
- Down payment
- $18,750
- Closing costs
- $2,250
- Reserves months
- —
- Total cash needed
- —
Loan-product check · same deal, 3 products live
Conventional
25% down · 7.5% · 30yr
- Down + closing
- —
- Monthly P&I
- —
- Monthly cashflow
- —
- DSCR
- —
- Eligible?
- —
Personal DTI + credit; lowest rate.
DSCR
20% down · 8.5% · 30yr
- Down + closing
- —
- Monthly P&I
- —
- Monthly cashflow
- —
- DSCR
- —
- Eligible?
- —
No personal income docs; deal must DSCR.
Hard money
10% down · 12.0% · 12mo
- Down + closing
- —
- Monthly P&I
- —
- Monthly cashflow
- —
- DSCR
- —
- Eligible?
- —
Short-term bridge; refi at stabilization.
Rent comps 23 comps
| Address | Beds | Baths | Sqft | Rent | $/sqft | DOM | Units | Dist |
|---|---|---|---|---|---|---|---|---|
| 2414 34th Ave Gulfport, MS | 2.0 | 1.0 | 912 | $1,125 | $1.23 | 22d | 1 | 0.35mi |
| 2317 30th St Gulfport, MS | 2.0 | 1.0 | 1164 | $2,150 | $1.85 | 22d | 1 | 0.51mi |
| 2125 22nd Ave Unit A & B A Gulfport, MS | 1.0 | 1.0 | 795 | $800 | $1.01 | 44d | 1 | 0.63mi |
| 2110 30th St Gulfport, MS | 2.0 | 2.0 | 950 | $950 | $1.00 | 22d | 1 | 0.68mi |
| 1513 34th Ave Gulfport, MS | 2.0 | 2.0 | 884 | $1,250 | $1.41 | 44d | 1 | 0.84mi |
| 2227 17th Ave Gulfport, MS | 2.0 | 1.0 | 1000 | $850 | $0.85 | 44d | 1 | 0.88mi |
| 2207 16th Ave Gulfport, MS | 2.0 | 1.0 | 1325 | $1,425 | $1.08 | 14d | 1 | 0.96mi |
| 3633 Southward Dr Gulfport, MS | 2.0 | 2.0 | 900 | $1,000 | $1.11 | 44d | 1 | 0.97mi |
| 2414 15th Ave Gulfport, MS | 2.0 | 1.0 | 818 | $1,000 | $1.22 | 44d | 1 | 1.03mi |
| 1822 15th St Gulfport, MS | 2.0 | 2.0 | 1100 | $1,900 | $1.73 | 44d | 1 | 1.08mi |
| 1605 20th St Gulfport, MS | 3.0 | 3.0 | 1350 | $1,095 | $0.81 | 44d | 1 | 1.08mi |
| 3305 12th St Gulfport, MS | 2.0 | 1.5 | 1100 | $1,295 | $1.18 | 44d | 1 | 1.09mi |
| 1106 32nd Ave Gulfport, MS | 3.0 | 2.0 | 1200 | $1,300 | $1.08 | 44d | 1 | 1.09mi |
| 3712 37th Ave Gulfport, MS | 3.0 | 2.0 | 1144 | $1,175 | $1.03 | 14d | 1 | 1.10mi |
| 2068 W Beach Blvd Biloxi, MS | 1.0–3.0 | 1.0–2.0 | 998 | $1,400 | $1.40 | 14d | 1 | 1.11mi |
| 1400 28th St Gulfport, MS | 2.0–3.0 | 2.0 | 1101 | $943 | $0.86 | 14d | 1 | 1.11mi |
| 1511 2nd St Gulfport, MS | 3.0 | 1.5 | 1030 | $2,000 | $1.94 | 44d | 1 | 1.28mi |
| 3625 Meadowlark Dr Gulfport, MS | 3.0 | 1.0 | 1315 | $1,200 | $0.91 | 14d | 1 | 1.33mi |
| 1221 42nd Ave Gulfport, MS | 3.0 | 1.0 | 1000 | $1,400 | $1.40 | 44d | 1 | 1.33mi |
| 3333 12th Ave Gulfport, MS | 2.0 | 2.0 | 1000 | $899 | $0.90 | 44d | 1 | 1.42mi |
| 3333 12th Ave Unit 6 Gulfport, MS | 2.0 | 2.5 | 1000 | $899 | $0.90 | 44d | 1 | 1.42mi |
| 1224 29th St Gulfport, MS | 2.0 | 2.0 | 1050 | $1,155 | $1.10 | 14d | 1 | 1.46mi |
| 3008 50th Ave Gulfport, MS | 3.0 | 2.0 | 1054 | $1,050 | $1.00 | 14d | 1 | 1.47mi |
Listing history 28 events
-
2026-06-18remarks 338-char remark
-
2026-06-18days on market $75,000 Active 94 DOM
-
2026-06-17days on market $75,000 Active 93 DOM
-
2026-06-16days on market $75,000 Active 92 DOM
-
2026-06-15days on market $75,000 Active 91 DOM
-
2026-06-14days on market $75,000 Active 89 DOM
-
2026-06-13days on market $75,000 Active 88 DOM
-
2026-06-10days on market $75,000 Active 86 DOM
-
2026-06-09days on market $75,000 Active 85 DOM
-
2026-06-08days on market $75,000 Active 84 DOM
-
2026-06-07days on market $75,000 Active 83 DOM
-
2026-06-05days on market $75,000 Active 80 DOM
-
2026-06-02days on market $75,000 Active 78 DOM
-
2026-06-01days on market $75,000 Active 77 DOM
-
2026-05-31days on market $75,000 Active 76 DOM
-
2026-05-30days on market $75,000 Active 75 DOM
-
2026-04-22status Active 257-char remark
Show marketing remark (257 chars)
Great investment opportunity in a prime location near the Seabee Base, just north of Pass Road in Gulfport. Currently leased at $1100 per month. Part of a portfolio of 4 homes for which the seller would entertain a package deal. Don't let this one get away!
-
2026-04-01status Pending 257-char remark
Show marketing remark (257 chars)
Great investment opportunity in a prime location near the Seabee Base, just north of Pass Road in Gulfport. Currently leased at $1100 per month. Part of a portfolio of 4 homes for which the seller would entertain a package deal. Don't let this one get away!
-
2026-03-24price $75,000 257-char remark
Show marketing remark (257 chars)
Great investment opportunity in a prime location near the Seabee Base, just north of Pass Road in Gulfport. Currently leased at $1100 per month. Part of a portfolio of 4 homes for which the seller would entertain a package deal. Don't let this one get away!
-
2026-02-23$78,000 Active 257-char remark
Show marketing remark (257 chars)
Great investment opportunity in a prime location near the Seabee Base, just north of Pass Road in Gulfport. Currently leased at $1100 per month. Part of a portfolio of 4 homes for which the seller would entertain a package deal. Don't let this one get away!
-
2024-11-26historical
-
2024-10-24price $79,999
-
2024-07-05status Active
-
2024-06-22status Pending
-
2024-05-25$95,000 Active
-
2016-07-21soldstatus $24,000
-
2016-07-13soldstatus
-
2016-05-05$23,000
ⓘ Source: listings_history table (triggers on properties + properties_extension) + one-shot
backfill from property_details.listing_events for pre-trigger history.
Tax reassessment forecast MS · Resets to sale price
- Current annual tax
- $831 · $69/mo
- Projected year-2 tax
- $831 · $69/mo
- Expected delta
- $0/yr ($0/mo · 0.0%)
ⓘ Screening estimate from a state-policy table — verify with the county assessor before closing.
Climate risk First Street
- Flood 4/10 Moderate FEMA zone X (unshaded) · 13% chance over 30 yrs
- Wildfire 2/10 Low
- Heat 10/10 Extreme 7 d/yr ≥106°F today · 23 d/yr by 30 yrs out
- Wind 9/10 Extreme 99% chance of damaging wind over 30 yrs
- Air quality 1/10 Low 0 unhealthy d/yr today · 0 by 30 yrs out
Nearby sold comps map
Loading sold comps map…
Walkable amenities ~0.75 mi
Loading nearby amenities…
Taxation est. · year 1
- Rental income
- $14,691
- − Mortgage interest
- −$4,201
- − Property taxes
- −$831
- − Insurance
- −$375
- − Repairs & maintenance
- −$1,175
- − Management
- −$1,175
- − Depreciation
- −$2,182
- Taxable income
- $4,751
- Est. tax owed @ 24.0%
- −$1,140
- After-tax cash flow
- $4,540/yr
For passive investors: Depreciation is non-cash, so a rental often shows a tax loss while cash-flowing — sheltering income. Rental losses are passive: they offset passive income freely, and up to $25,000/yr can offset ordinary (W-2) income if you actively participate and your MAGI is under $100k (phasing out to $0 by $150k); unused losses carry forward. On sale, claimed depreciation is recaptured at up to 25%, and gains may owe capital-gains tax (a 1031 exchange can defer both). Figures are a year-1 estimate at your 24.0% rate — not tax advice; consult a CPA.
Schools (NCES district)
- District
- Gulfport School District
- NCES district ID
- 2801710
- Math proficiency
- 41% ▼ -15.00%
- Reading proficiency
- 42% ▼ -6.00%
- Median HH income
- $35,712
- Composite
- 34.38/100
- National rank
- #5213
- State rank
- #37 of 130 in MS
Livability — Gulfport
- Score
- 73/100
- State rank
- #15
- US rank
- #5010
Category grades
Schools grade is shown separately in the Schools card above.
Census & demographics
- Census place
- Gulfport, MS
- County
- Harrison County · 178,171 people
- City population
- 96,188
- Metro
- Gulfport-Biloxi, MS
- Population (ZIP)
- 22,565
- Household income
- $34,758
- Rent vs Own
- Severe rent burden
- 1516.0
Population outlook (Harrison County) Hauer SSP2
- Today (2025)
- 228,444 people
- By 2030
- 241,942 · +5.9%
- By 2040
- 267,531 · +17.1%
- By 2050
- 291,062 · +27.4%
- By 2075
- 346,711 · +51.8%
- By 2100
- 378,165 · +65.5%
Race, ethnicity, and origin ACS 2023
- Neighborhood character
- Diverse neighborhood (Simpson 0.56)
- Race & ethnicity
- Black 59% White 29% Two or more races 7% Hispanic / Latino 5%
- Hispanic origin (detail)
- Mexican 2%
- Common ancestry
- Lithuanian 2% Serbian 1% Slovak 1%
- Foreign-born
- 2% · Canada
- Languages at home
- 95% English-only · Spanish 4%
Political lean MEDSL · Harrison
- 2024 margin
- Strong R (+28.9) · D 35.0% · R 63.9% · Other 1.1%
- 2008→2024 swing
- -2.9pp toward R · 2008: -26.0pp · 2024: -28.9pp
- All cycles
- 2024: R+28.9 2020: R+25.2 2016: R+30.7 2012: R+26.6 2008: R+26.0
Not yet ingested
- Civics
- —
Market trends
- HPI YoY
- ▼ -110.16%
- Current HPI
- 208.998
- Rent YoY
- ▲ 10.49%
- Metro
- Gulfport-Biloxi, MS
- State GDP YoY
- —
- F500 in state
- 0
Price history
+226.1% since first listed12 events — show timeline
- 2026-04-22 Relisted — MLSU
- 2026-04-01 Pending — MLSU
- 2026-03-24 Price Changed $75,000 MLSU
- 2026-02-23 Listed $78,000 MLSU
- 2024-11-26 Listing Removed — MLSU
- 2024-10-24 Price Changed $79,999 MLSU
- 2024-07-05 Relisted — MLSU
- 2024-06-22 Pending — MLSU
- 2024-05-25 Listed $95,000 MLSU
- 2016-07-21 Sold (Public Records) $24,000 Public Records
- 2016-07-13 Sold (MLS) — MLSU
- 2016-05-05 Listed $23,000 MLSU
Property tax history
+5.3%/yrLatest (2025): $831 · +5.3% YoY. Source: county tax records.
Cash-flow waterfall
monthlySold comps — $/sqft
last 12 mo · ≤1 miLoading sold comps…