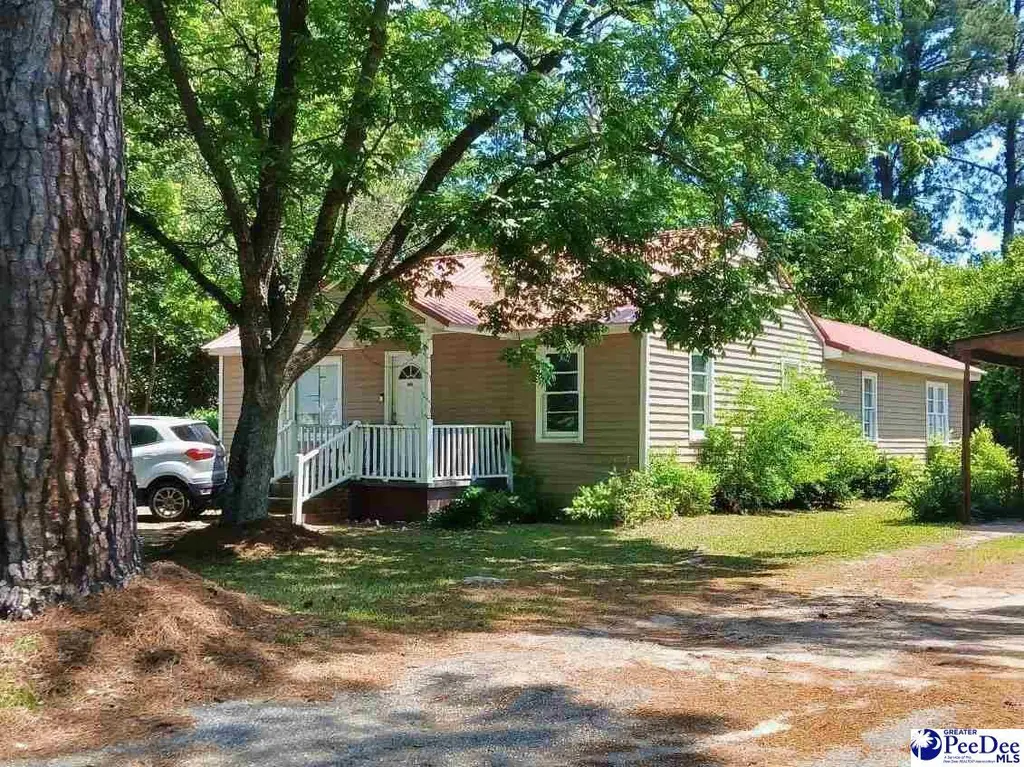
314 Hodges Ave · Bennettsville, SC
Flood risk 1/10 · Minimal
- FEMA flood zone
- X (unshaded)
- Chance of flooding over 30 yrs
- 0.0%
- Est. flood insurance / yr
- $507 – $1,088
Fire risk 5/10 · Moderate
- Est. fire insurance / yr
- $783 – $1,453
Heat risk 7/10 · Major
- Hot days now (above 108°F)
- 7 days/yr
- Hot days in 30 yrs
- 16 days/yr
Wind risk 8/10 · Major
- Chance of severe wind over 30 yrs
- 80.0%
Air-quality risk 1/10 · Minimal
- Unhealthy air days now
- 0 days/yr
- Unhealthy air days in 30 yrs
- 0 days/yr
Risk factors via First Street. Map © Google.
Why this score? — see what drove the D+ grade
The composite is a weighted blend of 9 inputs, each scored 0–100. Each bar is that input's sub-score; the figure is the points it added to the 100-point composite (weight × sub-score).
- Cash flow +19.3/30.0
- ARV discount +7.5/15.0
- DSCR +6.1/10.0
- 1% rule +4.3/10.0
- Livability +2.6/5.0
- Rent growth +2.5/5.0
- Condition / age +2.5/5.0
- Schools +1.6/10.0
- Appreciation +0.0/10.0
$149,000
🖨 Deal sheet (PDF) 📄 Offer letter ✓ Due diligence
Listing remarks
314 Hodges Ave in Bennettsville, SC gives you a clear path toward a practical 4-bedroom, 2-bath home in the Sunnybrook Heights neighborhood of Marlboro County. This cottage/bungalow style single family residence includes approximately 1,380 square feet and sits on a 0.22-acre lot. Built in 1960, the home has the kind of simple, established character many buyers appreciate, with vinyl siding, a crawl space foundation, and a covered front porch that creates an inviting first impression before you ever step inside. Step inside and you will find a layout designed around everyday usefulness. With 4 bedrooms and 2 bathrooms, the home gives you options without overcomplicating the space. Whether y
Key facts
- Covered front porch
- Fresh paint
- Newer roof
Tags
Property features AI
Finance
- Other: Lot size approximately 0.22 acres; Subdivision: CITY
Exterior
- Utilities: Public water; Public sewer
- Home design: Single family residence; Residential property
- Construction: Vinyl siding; 1,380 above-grade finished area
- Exterior features: Porch; Metal roof
Interior
- Kitchen: Range; Refrigerator
- Bathrooms: 2 full bathrooms
- Heating & cooling: Heat pump heating
- Interior features: Range; Refrigerator; Crawl space basement
Neighborhood map
What this means for you Summary
Snapshot
- This is a 4-bed/2.0-bath single-family listed at $149k.
Deal economics
- At list price, monthly cash flow is $165 ($2k/yr) — positive.
- The deal already cash-flows at list — no discount required.
- To meet the 1% rule (rent ≥ 1% of price), the offer needs to be $139k (6.7% below list).
- Recommended offer: $139k (6.7% below list) — sets the bar for 1% rule.
- Cap rate 7.6% vs local median 5.6% in Bennettsville — top-decile yield for the area; either an underpriced asset or a hidden risk that comps aren't pricing in. Stress-test before assuming the spread holds.
Location & tenants
- Location reads 52/100 on livability (#345 in SC) — a working-class tenant base; expect higher turnover. Strengths: cost of living A+, housing A-; Watch: crime F, amenities F, commute F.
- Marlboro 01 (town): math 16% / reading 25% proficiency, ranked #71 of 80 in SC (top 89%) — low school quality limits family demand, transient renter base, plan for 1-2y turnover; 76% free/reduced lunch — lower-income household profile, screen leases tightly.
- Zoned schools: Blenheim Middle School of Discovery (math 4% / reading 13%, grade F, #225 of 229 statewide, top 98%, 444 students, 100% FRL); Marlboro County High (math 22% / reading 77%, grade D, #151 of 196 statewide, top 79%, 1,047 students, 100% FRL) — zoned schools average 100% FRL vs 76% district-wide (24 pts higher); higher-poverty schools than district average — tighter screening recommended.
- Market conditions: 54 active listings in the ZIP; 6 units permitted in Marlboro County in 2024 (0 in 5+ unit buildings).
Forward outlook
- Local home prices are declining (-3.0%/yr); year-one equity from $1k of loan paydown is wiped out by about $4k of value loss. Plan a longer hold.
- Marlboro County population projected at -23% by 2050 — secular population decline; favor cash flow + early exit over multi-decade hold.
Negotiation context
- Only 3 days on market — expect competitive offers; lowballing is unlikely to land.
- 2 sale attempts since 7y ago with the ask held roughly flat each time — persistent listings suggest the price (not the market) is what's stuck; bring a comps-based counter.
- Current owner paid $40k; list at $149k implies a 272% gain — meaningful room to come down on a strong offer.
Risks & watch-outs
- Climate carrying-cost: severe wind risk, 80% chance of damaging wind over 30y; moderate wildfire risk; extreme-heat days projected 7→16/yr by 2055 (HVAC capex compounding) — expect insurance premiums to compound above CPI over the hold.
Questions for the listing agent
- Built in 1960 — when were the roof, HVAC, electrical panel, plumbing, and water heater last replaced?
- Is there a deadline driving the sale (1031 exchange, divorce, estate, relocation)? That informs how much negotiation room exists.
- Schools are F-rated, which usually means shorter tenancies and higher turnover. Who's the typical renter profile here, and what's been the actual vacancy rate?
- Crime grade is F in this area — have there been break-ins, vandalism, or insurance claims at this property in the last 3 years? What carrier currently insures it and at what premium?
- The area grade is low — what's the realistic commute time and amenity access for the typical tenant pool here? Any planned neighborhood developments (good or bad) we should know about?
- What's the average days-on-market for RENTAL listings here right now (not sales)? A rising rental-DOM trend means longer vacancies and softer asking-rent achievability than the comps imply.
- What's the recent tenant-quality profile in this submarket — average credit score on applications, eviction rate, late-payment / NSF rate, and stable-employment percentage? A property-management company in the area should have these aggregated.
- How much new for-sale + rental construction is in the pipeline within 1–3 miles? Heavy new supply typically softens prices + rents 12–24 months out; constrained supply supports both.
Investment metrics
- 1% rule
- 0.93% ✗
- Cap rate
- 7.62%
- Cash-on-cash
- 4.74%
- DSCR
- 1.21
- GRM
- 8.9
CMA / ARV
No comps found within radius.
Projected returns pro-forma
-3.0% appreciation · 3.0% rent growth · sell at horizon
- IRR
- -8.9%
- Equity multiple
- 0.67×
- Total profit
- $-13,685
- Equity at exit
- $22,216
- IRR
- 0.5%
- Equity multiple
- 1.03×
- Total profit
- $1,446
- Equity at exit
- $12,883
Cash invested: $41,720 (down + closing). Projections, not guarantees.
Landlord ↔ Tenant lean methodology
- Overall (STATE)
- 90 Strongly Landlord-Friendly
- State South Carolina
- 90 Strongly Landlord-Friendly · R+6
- County
- — inherits STATE
- City
- — inherits STATE
ZIP-level market 29512
- Active inventory
- 54
- Price-to-rent
- 8.9×
Monthly cashflow live
- Estimated rent
- $1,390 medium interval (Pro) →
- Mortgage (P&I)
- −$781
- Tax from tax record
- −$90 /mo · $1,080/yr
- Insurance
- −$62
- HOA
- −$0
- Vacancy / Maint / Mgmt
- −$292
- Net cashflow
- $165
Break-even live
Sensitivity live
| Price | -10% $249 | -5% $207 | +0% $165 | +5% $123 | +10% $80 |
|---|---|---|---|---|---|
| Rent | -10% $55 | -5% $110 | +0% $165 | +5% $220 | +10% $275 |
| Rate | -1.0pp $240 | -0.5pp $203 | base $165 | +0.5pp $126 | +1.0pp $87 |
UW: 25.0% down · 7.5% · 30yr · 1.5% tax · 5.0% vac · 8.0% maint · 8.0% mgmt
Financing live
Cash to close
- Down payment
- $37,250
- Closing costs
- $4,470
- Reserves months
- —
- Total cash needed
- —
Loan-product check · same deal, 3 products live
Conventional
25% down · 7.5% · 30yr
- Down + closing
- —
- Monthly P&I
- —
- Monthly cashflow
- —
- DSCR
- —
- Eligible?
- —
Personal DTI + credit; lowest rate.
DSCR
20% down · 8.5% · 30yr
- Down + closing
- —
- Monthly P&I
- —
- Monthly cashflow
- —
- DSCR
- —
- Eligible?
- —
No personal income docs; deal must DSCR.
Hard money
10% down · 12.0% · 12mo
- Down + closing
- —
- Monthly P&I
- —
- Monthly cashflow
- —
- DSCR
- —
- Eligible?
- —
Short-term bridge; refi at stabilization.
Listing history 3 events
-
2026-06-22days on market $149,000 Active 3 DOM
-
2026-06-18remarks 699-char remark
-
2026-06-18$149,000 Active 1 DOM
ⓘ Source: listings_history table (triggers on properties + properties_extension) + one-shot
backfill from property_details.listing_events for pre-trigger history.
Tax reassessment forecast SC · Resets to sale price
- Current annual tax
- $1,080 · $90/mo
- Projected year-2 tax
- $1,080 · $90/mo
- Expected delta
- $0/yr ($0/mo · 0.0%)
ⓘ Screening estimate from a state-policy table — verify with the county assessor before closing.
Climate risk First Street
- Flood 1/10 Low FEMA zone X (unshaded) · 0% chance over 30 yrs
- Wildfire 5/10 Major
- Heat 7/10 Severe 7 d/yr ≥108°F today · 16 d/yr by 30 yrs out
- Wind 8/10 Severe 80% chance of damaging wind over 30 yrs
- Air quality 1/10 Low 0 unhealthy d/yr today · 0 by 30 yrs out
Nearby sold comps map
Loading sold comps map…
Walkable amenities ~0.75 mi
Loading nearby amenities…
Taxation est. · year 1
- Rental income
- $16,683
- − Mortgage interest
- −$8,346
- − Property taxes
- −$1,080
- − Insurance
- −$745
- − Repairs & maintenance
- −$1,335
- − Management
- −$1,335
- − Depreciation
- −$4,335
- Taxable loss
- −$492
- Est. tax savings @ 24.0%
- +$118
- After-tax cash flow
- $2,096/yr
For passive investors: Depreciation is non-cash, so a rental often shows a tax loss while cash-flowing — sheltering income. Rental losses are passive: they offset passive income freely, and up to $25,000/yr can offset ordinary (W-2) income if you actively participate and your MAGI is under $100k (phasing out to $0 by $150k); unused losses carry forward. On sale, claimed depreciation is recaptured at up to 25%, and gains may owe capital-gains tax (a 1031 exchange can defer both). Figures are a year-1 estimate at your 24.0% rate — not tax advice; consult a CPA.
Schools (NCES district)
- District
- Marlboro 01
- NCES district ID
- 4502970
- Math proficiency
- 16% ▼ -9.00%
- Reading proficiency
- 25% ▼ -2.00%
- Median HH income
- $29,865
- Composite
- 16.37/100
- National rank
- #9201
- State rank
- #71 of 80 in SC
Livability — Bennettsville
- Score
- 52/100
- State rank
- #345
- US rank
- #24772
Category grades
Schools grade is shown separately in the Schools card above.
Census & demographics
- Population (ZIP)
- 17,408
Population outlook (Marlboro County) Hauer SSP2
- Today (2025)
- 25,477 people
- By 2030
- 24,266 · -4.8%
- By 2040
- 21,862 · -14.2%
- By 2050
- 19,665 · -22.8%
- By 2075
- 15,673 · -38.5%
- By 2100
- 12,390 · -51.4%
Race, ethnicity, and origin ACS 2023
- Neighborhood character
- Diverse neighborhood (Simpson 0.57)
- Race & ethnicity
- Black 57% White 32% Two or more races 5% Hispanic / Latino 3% Native American 2%
- Common ancestry
- Slovak 1% Serbian 1%
- Foreign-born
- 2% · Canada, South Korea
- Languages at home
- 98% English-only · Spanish 2%
Political lean MEDSL · Marlboro
- 2024 margin
- Toss-up / Even · D 50.6% · R 48.2% · Other 1.2%
- 2008→2024 swing
- -3.7pp toward R · 2008: 6.1pp · 2024: 2.4pp
- All cycles
- 2024: D+2.4 2020: D+10.9 2016: D+16.1 2012: D+30.4 2008: D+6.1
Not yet ingested
- Civics
- —
Market trends
- HPI YoY
- ▼ -80.61%
- Current HPI
- 108.4261
- Rent YoY
- —
- Metro
- —
- State GDP YoY
- ▲ 4.51%
- F500 in state
- 2
Industry mix (Fortune 500 HQ in SC)
| Industry | F500 HQs | Revenue |
|---|---|---|
| Packaging | 1 | $7B |
|
||
Price history
+396.7% since first listed5 events — show timeline
- 2026-06-17 Listed $149,000 RAGPD
- 2021-01-19 Sold (Public Records) $40,000 Public Records
- 2021-01-13 Sold (MLS) — RAGPD
- 2019-02-08 Listed $27,900 RAGPD
- 2005-01-28 Sold (Public Records) $30,000 Public Records
Property tax history
+3.8%/yrLatest (2025): $1,080 · +10.5% YoY. Source: county tax records.
Cash-flow waterfall
monthlySold comps — $/sqft
last 12 mo · ≤1 miLoading sold comps…