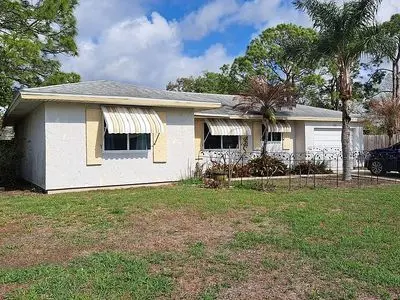
1020 Colonial Ave SE · Palm Bay, FL
Flood risk 1/10 · Minimal
- FEMA flood zone
- X (unshaded)
- Chance of flooding over 30 yrs
- 0.0%
- Est. flood insurance / yr
- $507 – $1,088
Fire risk 1/10 · Minimal
- Est. fire insurance / yr
- $947 – $1,759
Heat risk 9/10 · Severe
- Hot days now (above 106°F)
- 5 days/yr
- Hot days in 30 yrs
- 14 days/yr
Wind risk 10/10 · Severe
- Chance of severe wind over 30 yrs
- 99.0%
Air-quality risk 1/10 · Minimal
- Unhealthy air days now
- 0 days/yr
- Unhealthy air days in 30 yrs
- 0 days/yr
Risk factors via First Street. Map © Google.
Why this score? — see what drove the C+ grade
The composite is a weighted blend of 9 inputs, each scored 0–100. Each bar is that input's sub-score; the figure is the points it added to the 100-point composite (weight × sub-score).
- Cash flow +20.3/30.0
- Appreciation +10.0/10.0
- ARV discount +7.5/15.0
- DSCR +6.4/10.0
- 1% rule +5.2/10.0
- Schools +4.7/10.0
- Livability +3.6/5.0
- Rent growth +3.4/5.0
- Condition / age +2.5/5.0
$185,000
🖨 Deal sheet (PDF) 📄 Offer letter ✓ Due diligence
Listing remarks MLS
This homes needs some love and care but can easily shine! If you are looking for a solid home you can give at a great price look no further. Purchase this home for as little as 3% down using homepath financing. www. homepath.com. Incentives may apply.
Key facts
- Built 2008
Neighborhood map
What this means for you Summary
Snapshot
- This is a 2-bed/1.0-bath single-family listed at $185k.
Deal economics
- At list price, monthly cash flow is $237 ($3k/yr) — positive.
- The deal already cash-flows at list — no discount required.
- Meets the 1% rule at list price ($2k rent vs $185k).
Location & tenants
- Location reads 72/100 on livability (#366 in FL) — a middle-class / working-renter tenant base. Strengths: cost of living A+, housing A+; Watch: employment D+, amenities F, health & safety D-.
- Brevard (suburban): math 53% / reading 57% proficiency, ranked #19 of 73 in FL (top 26%) — acceptable for families but not a draw, mixed tenant base, ~2y average lease.
- Zoned schools: W. Melbourne Elementary School For Science (math 88% / reading 86%, grade A+, #24 of 2,144 statewide, top 1%, 549 students, 18% FRL); Southwest Middle School (math 40% / reading 39%, grade F, #373 of 571 statewide, top 66%, 920 students, 58% FRL); Bayside High School (math 27% / reading 40%, grade F, #400 of 667 statewide, top 61%, 1,854 students, 51% FRL) — zoned schools at 42% FRL track the district average.
- Market conditions: Rents rising (+3.7%/yr); 1123 active listings in the ZIP; 5 comparable units currently listed for rent nearby; rentals at typical pace (median 26d on market — plan ~3-4 weeks tenant-placement turnaround); solid renter incomes; 4,602 units permitted in Brevard County in 2024 (702 in 5+ unit buildings).
Forward outlook
- In year one you build about $20k of equity ($1k loan paydown + $18k appreciation (10.0% local appreciation)).
- Brevard County population projected at +15% by 2050 — modest demand growth; plan on rents tracking national, not racing it.
- At projected returns (10.0% appreciation + 3.7% rent growth), your $52k cash investment doubles in ~3 years — after that, you're playing with house money.
- By year 2, paydown + projected appreciation supports a ~$32k cash-out refi (75% LTV) — recoverable capital for the next deal without selling this one.
Negotiation context
- Only 0 days on market — expect competitive offers; lowballing is unlikely to land.
- 2 sale attempts since 16y ago with the ask held roughly flat each time — persistent listings suggest the price (not the market) is what's stuck; bring a comps-based counter.
- Current owner paid $145k; 28% above their basis — modest negotiation headroom, anchor on the comps not their cost.
Risks & watch-outs
- Climate carrying-cost: severe wind risk, 99% chance of damaging wind over 30y; extreme-heat days projected 5→14/yr by 2055 (HVAC capex compounding) — expect insurance premiums to compound above CPI over the hold.
Questions for the listing agent
- Is there a deadline driving the sale (1031 exchange, divorce, estate, relocation)? That informs how much negotiation room exists.
- What's the average days-on-market for RENTAL listings here right now (not sales)? A rising rental-DOM trend means longer vacancies and softer asking-rent achievability than the comps imply.
- What's the recent tenant-quality profile in this submarket — average credit score on applications, eviction rate, late-payment / NSF rate, and stable-employment percentage? A property-management company in the area should have these aggregated.
- How much new for-sale + rental construction is in the pipeline within 1–3 miles? Heavy new supply typically softens prices + rents 12–24 months out; constrained supply supports both.
Investment metrics
- 1% rule
- 1.02% ✓
- Cap rate
- 7.83%
- Cash-on-cash
- 5.50%
- DSCR
- 1.24
- GRM
- 8.2
CMA / ARV
No comps found within radius.
Projected returns pro-forma
10.0% appreciation · 3.67% rent growth · sell at horizon
- IRR
- 28.5%
- Equity multiple
- 3.26×
- Total profit
- $117,168
- Equity at exit
- $166,663
- IRR
- 25.0%
- Equity multiple
- 7.48×
- Total profit
- $335,827
- Equity at exit
- $359,414
Cash invested: $51,800 (down + closing). Projections, not guarantees.
Landlord ↔ Tenant lean methodology
- Overall (STATE)
- 87 Strongly Landlord-Friendly
- State Florida
- 87 Strongly Landlord-Friendly · R+3
- County
- — inherits STATE
- City
- — inherits STATE
ZIP-level market 32909
- Home prices YoY
- 6.0%
- Rents YoY
- 3.7%
- Active inventory
- 1123
- Price-to-rent
- 8.2×
Monthly cashflow live
- Estimated rent
- $1,881 high interval (Pro) →
- Mortgage (P&I)
- −$970
- Tax from tax record
- −$201 /mo · $2,416/yr
- Insurance
- −$77
- HOA
- −$0
- Lot rent
- −$0
- Vacancy / Maint / Mgmt
- −$395
- Net cashflow
- $237
Break-even live
Sensitivity live
| Price | -10% $342 | -5% $290 | +0% $237 | +5% $185 | +10% $133 |
|---|---|---|---|---|---|
| Rent | -10% $89 | -5% $163 | +0% $237 | +5% $312 | +10% $386 |
| Rate | -1.0pp $331 | -0.5pp $285 | base $237 | +0.5pp $190 | +1.0pp $141 |
UW: 25.0% down · 7.5% · 30yr · 1.5% tax · 5.0% vac · 8.0% maint · 8.0% mgmt
Financing live
Cash to close
- Down payment
- $46,250
- Closing costs
- $5,550
- Reserves months
- —
- Total cash needed
- —
Loan-product check · same deal, 3 products live
Conventional
25% down · 7.5% · 30yr
- Down + closing
- —
- Monthly P&I
- —
- Monthly cashflow
- —
- DSCR
- —
- Eligible?
- —
Personal DTI + credit; lowest rate.
DSCR
20% down · 8.5% · 30yr
- Down + closing
- —
- Monthly P&I
- —
- Monthly cashflow
- —
- DSCR
- —
- Eligible?
- —
No personal income docs; deal must DSCR.
Hard money
10% down · 12.0% · 12mo
- Down + closing
- —
- Monthly P&I
- —
- Monthly cashflow
- —
- DSCR
- —
- Eligible?
- —
Short-term bridge; refi at stabilization.
Rent comps 5 comps
| Address | Beds | Baths | Sqft | Rent | $/sqft | DOM | Units | Dist |
|---|---|---|---|---|---|---|---|---|
| 800 Starland St SE Palm Bay, FL | 2.0 | 1.0 | 904 | $1,650 | $1.83 | 25d | 1 | 0.39mi |
| 931 Commerce Rd SE Palm Bay, FL | 3.0 | 2.0 | 1068 | $2,300 | $2.15 | 25d | 1 | 0.61mi |
| 1072 Genesee Ave SE Palm Bay, FL | 3.0 | 2.0 | 1004 | $1,855 | $1.85 | 25d | 1 | 0.67mi |
| 461 Ellington Ave SE Palm Bay, FL | 2.0 | 2.0 | 1040 | $1,595 | $1.53 | 25d | 1 | 1.10mi |
| 1205 Jaslo St SE Palm Bay, FL | 1.0–3.0 | 1.0–2.0 | 992 | $1,888 | $1.90 | 16d | 8 | 1.24mi |
Listing history 6 events
-
2026-05-26$185,000
-
2026-03-30soldstatus $145,000
-
2010-04-16soldstatus $28,000 251-char remark
Show marketing remark (251 chars)
This homes needs some love and care but can easily shine! If you are looking for a solid home you can give at a great price look no further. Purchase this home for as little as 3% down using homepath financing. www. homepath.com. Incentives may apply.
-
2010-03-24$26,500 251-char remark
Show marketing remark (251 chars)
This homes needs some love and care but can easily shine! If you are looking for a solid home you can give at a great price look no further. Purchase this home for as little as 3% down using homepath financing. www. homepath.com. Incentives may apply.
-
1993-12-17soldstatus $35,000
-
1984-04-01soldstatus $64,000
ⓘ Source: listings_history table (triggers on properties + properties_extension) + one-shot
backfill from property_details.listing_events for pre-trigger history.
Tax reassessment forecast FL · Resets to sale price
- Current annual tax
- $2,416 · $201/mo
- Projected year-2 tax
- $2,416 · $201/mo
- Expected delta
- $0/yr ($0/mo · 0.0%)
ⓘ Screening estimate from a state-policy table — verify with the county assessor before closing.
Climate risk First Street
- Flood 1/10 Low FEMA zone X (unshaded) · 0% chance over 30 yrs
- Wildfire 1/10 Low
- Heat 9/10 Extreme 5 d/yr ≥106°F today · 14 d/yr by 30 yrs out
- Wind 10/10 Extreme 99% chance of damaging wind over 30 yrs
- Air quality 1/10 Low 0 unhealthy d/yr today · 0 by 30 yrs out
Nearby sold comps map
Loading sold comps map…
Walkable amenities ~0.75 mi
Loading nearby amenities…
Taxation est. · year 1
- Rental income
- $22,573
- − Mortgage interest
- −$10,363
- − Property taxes
- −$2,416
- − Insurance
- −$925
- − Repairs & maintenance
- −$1,806
- − Management
- −$1,806
- − Depreciation
- −$5,382
- Taxable loss
- −$124
- Est. tax savings @ 24.0%
- +$30
- After-tax cash flow
- $2,880/yr
For passive investors: Depreciation is non-cash, so a rental often shows a tax loss while cash-flowing — sheltering income. Rental losses are passive: they offset passive income freely, and up to $25,000/yr can offset ordinary (W-2) income if you actively participate and your MAGI is under $100k (phasing out to $0 by $150k); unused losses carry forward. On sale, claimed depreciation is recaptured at up to 25%, and gains may owe capital-gains tax (a 1031 exchange can defer both). Figures are a year-1 estimate at your 24.0% rate — not tax advice; consult a CPA.
Schools (NCES district)
- District
- Brevard
- NCES district ID
- 1200150
- Math proficiency
- 53% ▼ -9.00%
- Reading proficiency
- 57% ▼ -4.00%
- Median HH income
- $49,426
- Composite
- 46.86/100
- National rank
- #2370
- State rank
- #19 of 73 in FL
Livability — Palm Bay
- Score
- 72/100
- State rank
- #366
- US rank
- #6458
Category grades
Schools grade is shown separately in the Schools card above.
Census & demographics
- Census place
- Palm Bay, FL
- County
- Brevard County · 602,871 people
- City population
- 132,211
- Metro
- Palm Bay-Melbourne-Titusville, FL
- Population (ZIP)
- 41,804
- Household income
- $79,977
- Rent vs Own
- Severe rent burden
- 697.0
Population outlook (Brevard County) Hauer SSP2
- Today (2025)
- 623,254 people
- By 2030
- 648,420 · +4.0%
- By 2040
- 690,009 · +10.7%
- By 2050
- 715,669 · +14.8%
- By 2075
- 775,744 · +24.5%
- By 2100
- 776,687 · +24.6%
Race, ethnicity, and origin ACS 2023
- Neighborhood character
- Diverse neighborhood (Simpson 0.70)
- Race & ethnicity
- White 46% Black 21% Hispanic / Latino 20% Two or more races 16% Asian 4%
- Hispanic origin (detail)
- Mexican 2% Puerto Rican 8% Cuban 5%
- Common ancestry
- Hispanic 3% Slovak 2% Lithuanian 2%
- Foreign-born
- 17% · Canada, China, Jamaica
- Languages at home
- 84% English-only · Spanish 9% French/Haitian/Cajun 4% Chinese 1%
Political lean MEDSL · Brevard
- 2024 margin
- Strong R (+20.8) · D 39.1% · R 59.9% · Other 1.0%
- 2008→2024 swing
- -10.4pp toward R · 2008: -10.4pp · 2024: -20.8pp
- All cycles
- 2024: R+20.8 2020: R+16.4 2016: R+19.8 2012: R+12.7 2008: R+10.4
Not yet ingested
- Civics
- —
Market trends
- HPI YoY
- ▲ 18.81%
- Current HPI
- 330.8595
- Rent YoY
- ▲ 3.67%
- Metro
- Palm Bay-Melbourne-Titusville, FL
- State GDP YoY
- ▲ 3.28%
- F500 in state
- 36
Industry mix (Fortune 500 HQ in FL)
| Industry | F500 HQs | Revenue |
|---|---|---|
| Industrial Technology | 2 | $29B |
|
||
| Insurance | 2 | $17B |
|
||
| Retail | 1 | $60B |
|
||
| Technology Distribution | 1 | $58B |
|
||
| Homebuilding | 1 | $35B |
|
||
| Technology Manufacturing | 1 | $35B |
|
||
Price history
+189.1% since first listed6 events — show timeline
- 2026-05-26 Listed $185,000 FSBO.com
- 2026-03-30 Sold (Public Records) $145,000 Public Records
- 2010-04-16 Sold (MLS) $28,000 SCMLS
- 2010-03-24 Listed $26,500 SCMLS
- 1993-12-17 Sold (Public Records) $35,000 Public Records
- 1984-04-01 Sold (Public Records) $64,000 Public Records
Property tax history
+8.8%/yrLatest (2025): $2,416 · +7.4% YoY. Source: county tax records.
Cash-flow waterfall
monthlySold comps — $/sqft
last 12 mo · ≤1 miLoading sold comps…