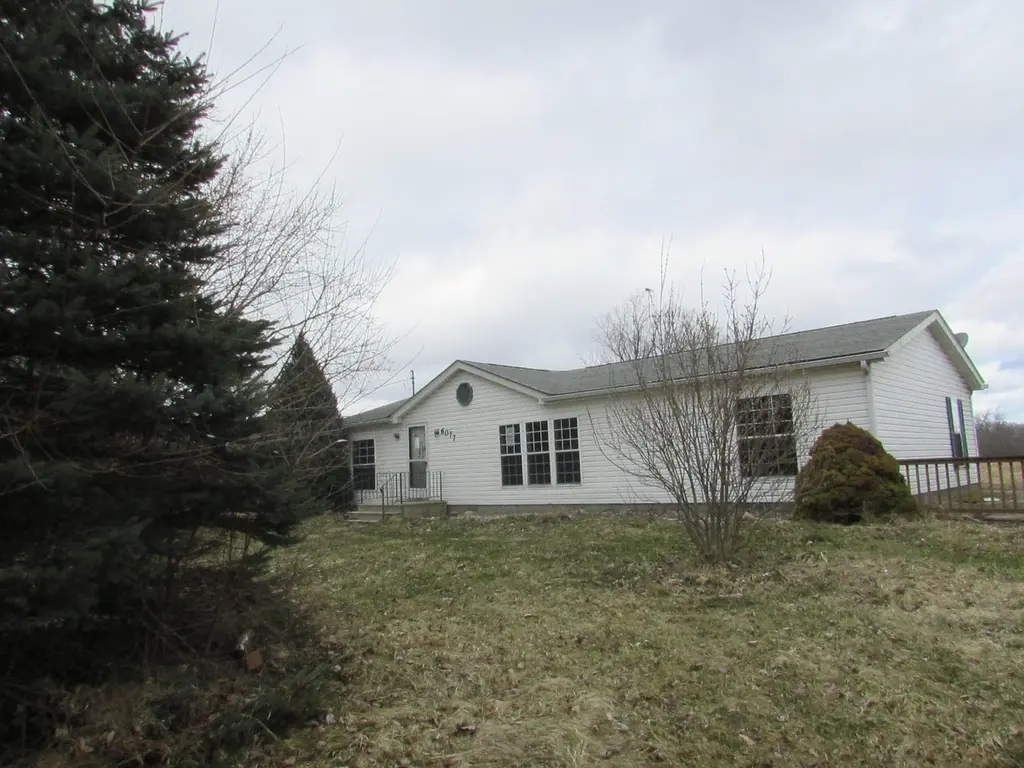
6077 Hibbard Rd · Vernon, MI
Flood risk No data
- FEMA flood zone
- —
- Chance of flooding over 30 yrs
- —
- Est. flood insurance / yr
- —
Fire risk No data
- Est. fire insurance / yr
- —
Heat risk No data
- Hot days now (above threshold)
- —
- Hot days in 30 yrs
- —
Wind risk No data
- Chance of severe wind over 30 yrs
- —
Air-quality risk No data
- Unhealthy air days now
- —
- Unhealthy air days in 30 yrs
- —
Risk factors via First Street. Map © Google.
Why this score? — see what drove the D grade
The composite is a weighted blend of 9 inputs, each scored 0–100. Each bar is that input's sub-score; the figure is the points it added to the 100-point composite (weight × sub-score).
- Cash flow +15.0/30.0
- ARV discount +7.0/15.0
- DSCR +4.6/10.0
- Livability +3.4/5.0
- 1% rule +3.3/10.0
- Schools +2.8/10.0
- Rent growth +2.5/5.0
- Condition / age +2.5/5.0
- Appreciation +0.0/10.0
$135,000
🖨 Deal sheet (PDF) 📄 Offer letter ✓ Due diligence
Listing remarks MLS
Looking for space, privacy, and workshop potential? This 1991 Ranch-style manufactured home offers the perfect blend of comfort and country living on a spacious 1.60-acre lot. Home needs work throughout
Key facts
- 1.6 acre lot
- 2 garage spots
- Built 1991
Tags
Property features AI
Finance
- HOA & community: Homeowners association present
Exterior
- Parking: Detached 2-car garage
- Utilities: Private well water; Septic tank sewer
- Home design: Single-family residence; One level
- Construction: Vinyl siding
- Exterior features: Lot dimensions approximately 181 x 249 x 181 x 249; Approximately 1.6-acre lot
Interior
- Bathrooms: 2 full bathrooms
- Heating & cooling: Forced air heating; Propane heating; No central cooling
- Interior features: Crawl space basement; Total of 6 rooms
Neighborhood map
What this means for you Summary
Snapshot
- This is a 3-bed/2.0-bath single-family listed at $135k.
Deal economics
- At list price, monthly cash flow is $42 ($509/yr) — positive.
- The deal already cash-flows at list — no discount required.
- To meet the 1% rule (rent ≥ 1% of price), the offer needs to be $112k (16.8% below list).
- Recommended offer: $112k (16.8% below list) — sets the bar for 1% rule.
Location & tenants
- Location reads 67/100 on livability (#401 in MI) — a middle-class / working-renter tenant base. Strengths: cost of living A+, housing A+, crime A-; Watch: amenities F, commute F, health & safety F.
- Corunna Public Schools (town): math 24% / reading 40% proficiency, ranked #330 of 540 in MI (top 61%) — families likely to look elsewhere, expect single-tenant / working-renter base with shorter leases.
- Zoned schools: Elsa Meyer Elementary School (math 47% / reading 42%, grade F, #484 of 1,397 statewide, top 38%, 337 students, 60% FRL); Corunna Middle School (math 18% / reading 31%, grade F, #388 of 493 statewide, top 80%, 452 students, 58% FRL); Corunna High School (math 25% / reading 56%, grade F, #297 of 713 statewide, top 42%, 666 students, 50% FRL).
- Market conditions: 52 active listings in the ZIP; 74 units permitted in Shiawassee County in 2024 (0 in 5+ unit buildings).
Forward outlook
- Local home prices are declining (-3.0%/yr); year-one equity from $933 of loan paydown is wiped out by about $4k of value loss. Plan a longer hold.
- Shiawassee County population projected at -25% by 2050 — secular population decline; favor cash flow + early exit over multi-decade hold.
Negotiation context
- It's been on market 18 days — a 2% lower offer ($133k) is reasonable based on typical stale-listing flexibility.
- 8 sale attempts since 7y ago with the ask held roughly flat each time — persistent listings suggest the price (not the market) is what's stuck; bring a comps-based counter.
Questions for the listing agent
- Is there a deadline driving the sale (1031 exchange, divorce, estate, relocation)? That informs how much negotiation room exists.
- Schools are D-rated, which usually means shorter tenancies and higher turnover. Who's the typical renter profile here, and what's been the actual vacancy rate?
- The area grade is low — what's the realistic commute time and amenity access for the typical tenant pool here? Any planned neighborhood developments (good or bad) we should know about?
- What's the average days-on-market for RENTAL listings here right now (not sales)? A rising rental-DOM trend means longer vacancies and softer asking-rent achievability than the comps imply.
- What's the recent tenant-quality profile in this submarket — average credit score on applications, eviction rate, late-payment / NSF rate, and stable-employment percentage? A property-management company in the area should have these aggregated.
- How much new for-sale + rental construction is in the pipeline within 1–3 miles? Heavy new supply typically softens prices + rents 12–24 months out; constrained supply supports both.
Investment metrics
- 1% rule
- 0.83% ✗
- Cap rate
- 6.67%
- Cash-on-cash
- 1.35%
- DSCR
- 1.06
- GRM
- 10.0
CMA / ARV
- ARV (on-the-fly)
- $133,440
- Comps found
- 1
Show comp detail 1 sale within ~0.75 mi
| Address | Dist | Beds/Ba | Sqft | Sold | Price | $/sf | Match |
|---|---|---|---|---|---|---|---|
| 6077 Hibbard Rd | 0.00mi | 3/2.0 | 1,390 (0%) | 1mo | $134,000 | $96 | 99 |
Match score weights: distance 35% · size 25% · config 20% · recency 20%. Top-matched comps best support the ARV.
Projected returns pro-forma
-3.0% appreciation · 3.0% rent growth · sell at horizon
- IRR
- -14.2%
- Equity multiple
- 0.49×
- Total profit
- $-19,212
- Equity at exit
- $20,129
- IRR
- -5.5%
- Equity multiple
- 0.65×
- Total profit
- $-13,403
- Equity at exit
- $11,672
Cash invested: $37,800 (down + closing). Projections, not guarantees.
Landlord ↔ Tenant lean methodology
- Overall (STATE)
- 62 Landlord-Friendly
- State Michigan
- 62 Landlord-Friendly · EVEN
- County
- — inherits STATE
- City
- — inherits STATE
ZIP-level market 48817
- Home prices YoY
- -26.9%
- Active inventory
- 52
- Price-to-rent
- 10.0×
Monthly cashflow live
- Estimated rent
- $1,123 medium interval (Pro) →
- Mortgage (P&I)
- −$708
- Tax from tax record
- −$80 /mo · $963/yr
- Insurance
- −$56
- HOA
- −$0
- Vacancy / Maint / Mgmt
- −$236
- Net cashflow
- $42
Break-even live
Sensitivity live
| Price | -10% $119 | -5% $81 | +0% $42 | +5% $4 | +10% $-34 |
|---|---|---|---|---|---|
| Rent | -10% $-46 | -5% $-2 | +0% $42 | +5% $87 | +10% $131 |
| Rate | -1.0pp $110 | -0.5pp $77 | base $42 | +0.5pp $7 | +1.0pp $-28 |
UW: 25.0% down · 7.5% · 30yr · 1.5% tax · 5.0% vac · 8.0% maint · 8.0% mgmt
Financing live
Cash to close
- Down payment
- $33,750
- Closing costs
- $4,050
- Reserves months
- —
- Total cash needed
- —
Loan-product check · same deal, 3 products live
Conventional
25% down · 7.5% · 30yr
- Down + closing
- —
- Monthly P&I
- —
- Monthly cashflow
- —
- DSCR
- —
- Eligible?
- —
Personal DTI + credit; lowest rate.
DSCR
20% down · 8.5% · 30yr
- Down + closing
- —
- Monthly P&I
- —
- Monthly cashflow
- —
- DSCR
- —
- Eligible?
- —
No personal income docs; deal must DSCR.
Hard money
10% down · 12.0% · 12mo
- Down + closing
- —
- Monthly P&I
- —
- Monthly cashflow
- —
- DSCR
- —
- Eligible?
- —
Short-term bridge; refi at stabilization.
Listing history 21 events
-
2026-04-30status Pending
Show marketing remark (203 chars)
Looking for space, privacy, and workshop potential? This 1991 Ranch-style manufactured home offers the perfect blend of comfort and country living on a spacious 1.60-acre lot. Home needs work throughout
-
2026-04-30status Pending 203-char remark
Show marketing remark (203 chars)
Looking for space, privacy, and workshop potential? This 1991 Ranch-style manufactured home offers the perfect blend of comfort and country living on a spacious 1.60-acre lot. Home needs work throughout
-
2026-04-12$135,000 Active
Show marketing remark (203 chars)
Looking for space, privacy, and workshop potential? This 1991 Ranch-style manufactured home offers the perfect blend of comfort and country living on a spacious 1.60-acre lot. Home needs work throughout
-
2026-04-12$135,000 Active 203-char remark
Show marketing remark (203 chars)
Looking for space, privacy, and workshop potential? This 1991 Ranch-style manufactured home offers the perfect blend of comfort and country living on a spacious 1.60-acre lot. Home needs work throughout
-
2025-10-17historical
-
2025-10-17historical
-
2025-10-13price $170,000
-
2025-10-13price $170,000
-
2025-10-03price $215,000
-
2025-10-02price $215,000
-
2025-09-16$235,000 Active
-
2025-09-16$235,000 Active
-
2025-05-07historical
-
2025-04-21$250,000 Active
-
2025-04-21$250,000 Active
-
2025-04-14historical
-
2019-06-24soldstatus $146,000
-
2019-06-03soldstatus $146,000
-
2019-06-03soldstatus $146,000
-
2019-03-29$144,900
-
2019-03-29$144,900
ⓘ Source: listings_history table (triggers on properties + properties_extension) + one-shot
backfill from property_details.listing_events for pre-trigger history.
Tax reassessment forecast MI · Partial reset (capped growth)
- Current annual tax
- $963 · $80/mo
- Projected year-2 tax
- $1,521 · $127/mo
- Expected delta
- +$558/yr (+$46/mo · 57.9%)
ⓘ Screening estimate from a state-policy table — verify with the county assessor before closing.
Nearby sold comps map
Loading sold comps map…
Walkable amenities ~0.75 mi
Loading nearby amenities…
Taxation est. · year 1
- Rental income
- $13,471
- − Mortgage interest
- −$7,562
- − Property taxes
- −$963
- − Insurance
- −$675
- − Repairs & maintenance
- −$1,078
- − Management
- −$1,078
- − Depreciation
- −$3,927
- Taxable loss
- −$1,811
- Est. tax savings @ 24.0%
- +$435
- After-tax cash flow
- $944/yr
For passive investors: Depreciation is non-cash, so a rental often shows a tax loss while cash-flowing — sheltering income. Rental losses are passive: they offset passive income freely, and up to $25,000/yr can offset ordinary (W-2) income if you actively participate and your MAGI is under $100k (phasing out to $0 by $150k); unused losses carry forward. On sale, claimed depreciation is recaptured at up to 25%, and gains may owe capital-gains tax (a 1031 exchange can defer both). Figures are a year-1 estimate at your 24.0% rate — not tax advice; consult a CPA.
Schools (NCES district)
- District
- Corunna Public Schools
- NCES district ID
- 2610860
- Math proficiency
- 24% ▲ 1.00%
- Reading proficiency
- 40% ▬ 0.00%
- Median HH income
- $47,801
- Composite
- 27.59/100
- National rank
- #6935
- State rank
- #330 of 540 in MI
Livability — Vernon
- Score
- 67/100
- State rank
- #401
- US rank
- #10838
Category grades
Schools grade is shown separately in the Schools card above.
Census & demographics
- City population
- 609
- Population (ZIP)
- 5,451
Population outlook (Shiawassee County) Hauer SSP2
- Today (2025)
- 64,238 people
- By 2030
- 61,434 · -4.4%
- By 2040
- 55,054 · -14.3%
- By 2050
- 48,426 · -24.6%
- By 2075
- 35,995 · -44.0%
- By 2100
- 26,678 · -58.5%
Race, ethnicity, and origin ACS 2023
- Neighborhood character
- Predominantly White (92%)
- Race & ethnicity
- White 92% Hispanic / Latino 3% Asian 2% Two or more races 2%
- Common ancestry
- Lithuanian 5% Romanian 5% Iranian 4%
- Foreign-born
- 1% · Philippines, Canada
- Languages at home
- 98% English-only · Spanish 1% Arabic 1%
Political lean MEDSL · Shiawassee
- 2024 margin
- Strong R (+23.1) · D 37.7% · R 60.8% · Other 1.6%
- 2008→2024 swing
- -31.7pp toward R · 2008: 8.6pp · 2024: -23.1pp
- All cycles
- 2024: R+23.1 2020: R+19.9 2016: R+19.6 2012: D+3.7 2008: D+8.6
Not yet ingested
- Civics
- —
Market trends
- HPI YoY
- ▼ -91.76%
- Current HPI
- 249.693
- Rent YoY
- —
- Metro
- —
- State GDP YoY
- ▲ 1.37%
- F500 in state
- 28
Industry mix (Fortune 500 HQ in MI)
| Industry | F500 HQs | Revenue |
|---|---|---|
| Automotive Parts | 3 | $48B |
|
||
| Automotive | 2 | $372B |
|
||
| Chemicals | 1 | $45B |
|
||
| Automotive Retail | 1 | $29B |
|
||
| Healthcare / Medical Devices | 1 | $23B |
|
||
| Automotive Technology | 1 | $20B |
|
||
Price history
-6.8% since first listed21 events — show timeline
- 2026-04-30 Pending — REALCOMP
- 2026-04-30 Pending — MiRealSource-MiMLS
- 2026-04-12 Listed $135,000 REALCOMP
- 2026-04-12 Listed $135,000 MiRealSource-MiMLS
- 2025-10-17 Listing Removed — MiRealSource-MiMLS
- 2025-10-17 Listing Removed — REALCOMP
- 2025-10-13 Price Changed $170,000 MiRealSource-MiMLS
- 2025-10-13 Price Changed $170,000 REALCOMP
- 2025-10-03 Price Changed $215,000 MiRealSource-MiMLS
- 2025-10-02 Price Changed $215,000 REALCOMP
- 2025-09-16 Listed $235,000 REALCOMP
- 2025-09-16 Listed $235,000 MiRealSource-MiMLS
- 2025-05-07 Listing Removed — MiRealSource-MiMLS
- 2025-04-21 Listed $250,000 MiRealSource-MiMLS
- 2025-04-21 Listed $250,000 REALCOMP
- 2025-04-14 Coming Soon — MiRealSource-MiMLS
- 2019-06-24 Sold (Public Records) $146,000 Public Records
- 2019-06-03 Sold (MLS) $146,000 MiRealSource-MiMLS
- 2019-06-03 Sold (MLS) $146,000 REALCOMP
- 2019-03-29 Listed $144,900 MiRealSource-MiMLS
- 2019-03-29 Listed $144,900 REALCOMP
Property tax history
-0.8%/yrLatest (2025): $963 · -56.0% YoY. Source: county tax records.
Cash-flow waterfall
monthlySold comps — $/sqft
last 12 mo · ≤1 miLoading sold comps…