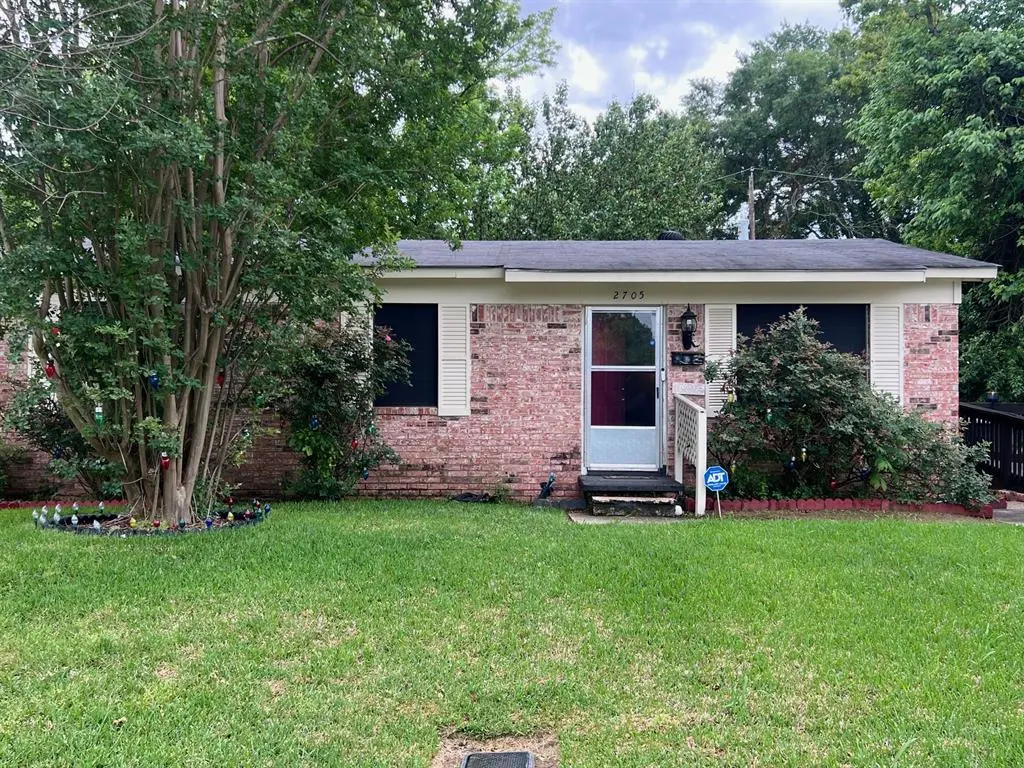
2705 Dorian Ter · Shreveport, LA
Flood risk 1/10 · Minimal
- FEMA flood zone
- X (unshaded)
- Chance of flooding over 30 yrs
- 0.0%
- Est. flood insurance / yr
- $507 – $1,088
Fire risk 1/10 · Minimal
- Est. fire insurance / yr
- $1,269 – $2,357
Heat risk 7/10 · Major
- Hot days now (above 110°F)
- 7 days/yr
- Hot days in 30 yrs
- 22 days/yr
Wind risk 6/10 · Moderate
- Chance of severe wind over 30 yrs
- 68.0%
Air-quality risk 2/10 · Minimal
- Unhealthy air days now
- 1 days/yr
- Unhealthy air days in 30 yrs
- 1 days/yr
Risk factors via First Street. Map © Google.
Why this score? — see what drove the C grade
The composite is a weighted blend of 9 inputs, each scored 0–100. Each bar is that input's sub-score; the figure is the points it added to the 100-point composite (weight × sub-score).
- Cash flow +23.6/30.0
- DSCR +7.6/10.0
- ARV discount +7.5/15.0
- 1% rule +5.1/10.0
- Appreciation +4.9/10.0
- Livability +3.0/5.0
- Rent growth +2.5/5.0
- Condition / age +2.5/5.0
- Schools +2.2/10.0
$75,000
🖨 Deal sheet 📄 Offer letter ✓ Due diligence
Listing remarks
Great Home Located on a Cul-de-sac. This home has had many updates and upgrades. Roof and HVAC are newer. New flooring in the living room and bedrooms. Flooring has been purchased for the kitchen area. This home is great for a first time home buyer or someone who is looking for an affordable home. This home qualifies for multiple down payment assistance programs. Accessibility ramp and a large fenced backyard.
Key facts
- New flooring
- Cul-de-sac
- 7,492 sq ft lot
Tags
Property features AI
Finance
- Other: Subdivision: Dorian Terrace; County: Caddo; Property listed with NWLA Realty LLC
- Financial info: Treat as clear loan type; No second mortgage
- HOA & community: No homeowners association
Exterior
- Parking: Driveway
- Utilities: City water; City sewer; No municipal utility district
- Home design: Single-family residence; Residential property; One story; Built in 1985; Not attached to other units
- Construction: Pillar/post/pier foundation
- Exterior features: Accessible approach with ramp; Lot less than 0.5 acre
Interior
- Kitchen: Gas range
- Bedrooms: 3 bedrooms (all on main level)
- Bathrooms: 1 full bathroom
- Heating & cooling: Central heating; Central air conditioning
- Interior features: Eat-in kitchen; One living area; One dining area; Total room count: 4
- Laundry & utility: Laundry located in kitchen
Neighborhood map
What this means for you Summary
Snapshot
- This is a 3-bed/1.0-bath single-family listed at $75k.
Deal economics
- At list price, monthly cash flow is $142 ($2k/yr) — positive.
- The deal already cash-flows at list — no discount required.
- Meets the 1% rule at list price ($758 rent vs $75k).
- Recommended offer: $74k (1.5% below list) — sets the bar for market timing.
- Cap rate 8.6% vs local median 5.7% in Shreveport — top-decile yield for the area; either an underpriced asset or a hidden risk that comps aren't pricing in. Stress-test before assuming the spread holds.
Location & tenants
- Location reads 59/100 on livability (#270 in LA) — a working-class tenant base; expect higher turnover. Strengths: cost of living A+, housing A; Watch: schools D+, crime F, amenities F.
- Caddo Parish (urban): math 21% / reading 32% proficiency, ranked #53 of 98 in LA (top 54%) — low school quality limits family demand, transient renter base, plan for 1-2y turnover; 64% free/reduced lunch — lower-income household profile, screen leases tightly.
- Market conditions: 69 active listings in the ZIP; 11 comparable units currently listed for rent nearby; rentals lingering (median 44d on market — plan ~5-8 weeks vacancy on turnover, expect pricing pressure); 55% of comp listings sitting > 30 days — soft ceiling on asking rent; 221 units permitted in Caddo Parish in 2024 (0 in 5+ unit buildings).
Forward outlook
- In year one you build about $395 of equity ($519 loan paydown + $-124 appreciation (-0.2% local appreciation)).
- Caddo County population projected at -15% by 2050 — secular population decline; favor cash flow + early exit over multi-decade hold.
- At projected returns (-0.2% appreciation + 3.0% rent growth), your $21k cash investment doubles in ~8 years — after that, you're playing with house money.
Negotiation context
- It's been on market 18 days — a 2% lower offer ($74k) is reasonable based on typical stale-listing flexibility.
- 2 sale attempts with the ask held roughly flat each time — persistent listings suggest the price (not the market) is what's stuck; bring a comps-based counter.
Risks & watch-outs
- Climate carrying-cost: major wind risk, 68% chance of damaging wind over 30y; extreme-heat days projected 7→22/yr by 2055 (HVAC capex compounding) — expect insurance premiums to compound above CPI over the hold.
Questions for the listing agent
- Is there a deadline driving the sale (1031 exchange, divorce, estate, relocation)? That informs how much negotiation room exists.
- Schools are D-rated, which usually means shorter tenancies and higher turnover. Who's the typical renter profile here, and what's been the actual vacancy rate?
- Crime grade is F in this area — have there been break-ins, vandalism, or insurance claims at this property in the last 3 years? What carrier currently insures it and at what premium?
- What's the average days-on-market for RENTAL listings here right now (not sales)? A rising rental-DOM trend means longer vacancies and softer asking-rent achievability than the comps imply.
- What's the recent tenant-quality profile in this submarket — average credit score on applications, eviction rate, late-payment / NSF rate, and stable-employment percentage? A property-management company in the area should have these aggregated.
- How much new for-sale + rental construction is in the pipeline within 1–3 miles? Heavy new supply typically softens prices + rents 12–24 months out; constrained supply supports both.
Investment metrics
- 1% rule
- 1.01% ✓
- Cap rate
- 8.56%
- Cash-on-cash
- 8.09%
- DSCR
- 1.36
- GRM
- 8.2
CMA / ARV
- ARV (on-the-fly)
- $31,775
- Comps found
- 7
Show comp detail 7 sales within ~0.75 mi
| Address | Dist | Beds/Ba | Sqft | Sold | Price | $/sf | Match |
|---|---|---|---|---|---|---|---|
| 2935 Poland St | 0.41mi | 3/1.0 | 1,030 (+0%) | 19mo | $17,000 | $17 | 64 |
| 3121 Ashton St | 0.62mi | 2/1.0 (-1) | 1,016 (-1%) | 1mo | $31,000 | $31 | 64 |
| 2314 Utah Dr | 0.28mi | 3/1.0 | 883 (-14%) | 0mo | $82,500 | $93 | 64 |
| 2609 Ashton St | 0.49mi | 3/1.0 | 1,144 (+12%) | 1mo | $55,000 | $48 | 57 |
| 2937 Looney St | 0.51mi | 3/1.0 | 1,017 (-1%) | 23mo | $21,000 | $21 | 56 |
| 1903 Abbie St | 0.70mi | 2/1.0 (-1) | 1,034 (+1%) | 14mo | $25,000 | $24 | 50 |
| 3137 Looney St | 0.59mi | 2/1.0 (-1) | 1,134 (+11%) | 2mo | $60,000 | $53 | 48 |
Match score weights: distance 35% · size 25% · config 20% · recency 20%. Top-matched comps best support the ARV.
Projected returns pro-forma
-0.17% appreciation · 3.0% rent growth · sell at horizon
- IRR
- 6.3%
- Equity multiple
- 1.30×
- Total profit
- $6,218
- Equity at exit
- $21,159
- IRR
- 11.6%
- Equity multiple
- 2.24×
- Total profit
- $26,111
- Equity at exit
- $24,946
Cash invested: $21,000 (down + closing). Projections, not guarantees.
Landlord ↔ Tenant lean methodology
- Overall (STATE)
- 90 Strongly Landlord-Friendly
- State Louisiana
- 90 Strongly Landlord-Friendly · R+12
- County
- — inherits STATE
- City
- — inherits STATE
ZIP-level market 71103
- Home prices YoY
- -0.6%
- Active inventory
- 69
- Price-to-rent
- 8.2×
Monthly cashflow live
- Estimated rent
- $758 high interval (Pro) →
- Mortgage (P&I)
- −$393
- Tax from tax record
- −$33 /mo · $395/yr
- Insurance
- −$31
- HOA
- −$0
- Vacancy / Maint / Mgmt
- −$159
- Net cashflow
- $142
Break-even live
UW: 25.0% down · 7.5% · 30yr · 1.5% tax · 5.0% vac · 8.0% maint · 8.0% mgmt
Financing live
Cash to close
- Down payment
- $18,750
- Closing costs
- $2,250
- Reserves months
- —
- Total cash needed
- —
Loan-product check · same deal, 3 products live
Conventional
25% down · 7.5% · 30yr
- Down + closing
- —
- Monthly P&I
- —
- Monthly cashflow
- —
- DSCR
- —
- Eligible?
- —
Personal DTI + credit; lowest rate.
DSCR
20% down · 8.5% · 30yr
- Down + closing
- —
- Monthly P&I
- —
- Monthly cashflow
- —
- DSCR
- —
- Eligible?
- —
No personal income docs; deal must DSCR.
Hard money
10% down · 12.0% · 12mo
- Down + closing
- —
- Monthly P&I
- —
- Monthly cashflow
- —
- DSCR
- —
- Eligible?
- —
Short-term bridge; refi at stabilization.
Rent comps 11 comps
| Address | Beds | Baths | Sqft | Rent | $/sqft | DOM | Units | Dist |
|---|---|---|---|---|---|---|---|---|
| 509 Alabama Ave SE Shreveport, LA | 2.0 | 1.0 | 700 | $700 | $1.00 | 43d | 1 | 0.34mi |
| 2712 Ashton St Shreveport, LA | 2.0 | 1.0 | 875 | $700 | $0.80 | 13d | 1 | 0.48mi |
| 1928 Alston St Shreveport, LA | 3.0 | 2.0 | 1100 | $750 | $0.68 | 43d | 1 | 0.67mi |
| 1818 Perrin St Shreveport, LA | 3.0 | 1.5 | 1129 | $895 | $0.79 | 43d | 1 | 0.73mi |
| 3101 Harp St Shreveport, LA | 3.0 | 1.0 | 839 | $850 | $1.01 | 21d | 1 | 0.78mi |
| 2042 Laurel St Shreveport, LA | 3.0 | 1.0 | 1100 | $800 | $0.73 | 43d | 1 | 1.01mi |
| 3022 Lillian St Shreveport, LA | 2.0 | 1.0 | 1115 | $695 | $0.62 | 21d | 1 | 1.20mi |
| 3612 Michigan Blvd Shreveport, LA | 2.0 | 1.0 | 1200 | $615 | $0.51 | 13d | 1 | 1.22mi |
| 1719 Lakeshore Dr Shreveport, LA | 3.0 | 1.5 | 1200 | $950 | $0.79 | 43d | 1 | 1.43mi |
| 3323 Darien St Shreveport, LA | 3.0 | 1.0 | 1200 | $785 | $0.65 | 43d | 1 | 1.44mi |
| 3420 Darien St Shreveport, LA | 2.0 | 1.0 | 1200 | $665 | $0.55 | 13d | 1 | 1.44mi |
Listing history 4 events
-
2026-05-07status Pending
-
2026-04-25historical Active Contingent
-
2026-04-20status Active
-
2026-03-09$75,000 Active
ⓘ Source: listings_history table (triggers on properties + properties_extension) + one-shot
backfill from property_details.listing_events for pre-trigger history.
Tax reassessment forecast LA · Resets to sale price
- Current annual tax
- $395 · $33/mo
- Projected year-2 tax
- $412 · $34/mo
- Expected delta
- +$17/yr (+$1/mo · 4.4%)
ⓘ Screening estimate from a state-policy table — verify with the county assessor before closing.
Climate risk First Street
- Flood 1/10 Low FEMA zone X (unshaded) · 0% chance over 30 yrs
- Wildfire 1/10 Low
- Heat 7/10 Severe 7 d/yr ≥110°F today · 22 d/yr by 30 yrs out
- Wind 6/10 Major 68% chance of damaging wind over 30 yrs
- Air quality 2/10 Low 1 unhealthy d/yr today · 1 by 30 yrs out
Nearby sold comps map
Loading sold comps map…
Walkable amenities ~0.75 mi
Loading nearby amenities…
Taxation est. · year 1
- Rental income
- $9,100
- − Mortgage interest
- −$4,201
- − Property taxes
- −$395
- − Insurance
- −$375
- − Repairs & maintenance
- −$728
- − Management
- −$728
- − Depreciation
- −$2,182
- Taxable income
- $491
- Est. tax owed @ 24.0%
- −$118
- After-tax cash flow
- $1,582/yr
For passive investors: Depreciation is non-cash, so a rental often shows a tax loss while cash-flowing — sheltering income. Rental losses are passive: they offset passive income freely, and up to $25,000/yr can offset ordinary (W-2) income if you actively participate and your MAGI is under $100k (phasing out to $0 by $150k); unused losses carry forward. On sale, claimed depreciation is recaptured at up to 25%, and gains may owe capital-gains tax (a 1031 exchange can defer both). Figures are a year-1 estimate at your 24.0% rate — not tax advice; consult a CPA.
Schools (NCES district)
- District
- Caddo Parish
- NCES district ID
- 2200300
- Math proficiency
- 21% ▼ -33.00%
- Reading proficiency
- 32% ▼ -30.00%
- Median HH income
- $39,227
- Composite
- 22.23/100
- National rank
- #8148
- State rank
- #53 of 98 in LA
Livability — Shreveport
- Score
- 59/100
- State rank
- #270
- US rank
- #19730
Category grades
Schools grade is shown separately in the Schools card above.
Census & demographics
- Census place
- Shreveport, LA
- City population
- 164,123
- Population (ZIP)
- 6,142
Population outlook (Caddo County) Hauer SSP2
- Today (2025)
- 243,190 people
- By 2030
- 237,231 · -2.5%
- By 2040
- 222,502 · -8.5%
- By 2050
- 206,516 · -15.1%
- By 2075
- 165,706 · -31.9%
- By 2100
- 122,262 · -49.7%
Race, ethnicity, and origin ACS 2023
- Neighborhood character
- Predominantly Black (81%)
- Race & ethnicity
- Black 81% White 17% Hispanic / Latino 1%
- Common ancestry
- Slovak 3% Hispanic 1%
- Languages at home
- 99% English-only · Spanish 1%
Political lean MEDSL · Caddo
- 2024 margin
- Toss-up / Even · D 51.6% · R 47.0% · Other 1.4%
- 2008→2024 swing
- +1.6pp toward D · 2008: 3.0pp · 2024: 4.6pp
- All cycles
- 2024: D+4.6 2020: D+6.8 2016: D+4.2 2012: D+4.9 2008: D+3.0
Not yet ingested
- Civics
- —
Market trends
- HPI YoY
- ▼ -0.17%
- Current HPI
- 26.3904
- Rent YoY
- —
- Metro
- —
- State GDP YoY
- ▲ 3.29%
- F500 in state
- 10
Industry mix (Fortune 500 HQ in LA)
| Industry | F500 HQs | Revenue |
|---|---|---|
| Telecommunications | 2 | $23B |
|
||
| Utilities | 1 | $12B |
|
||
| Wholesale / Distribution | 1 | $5B |
|
||
| Advertising | 1 | $2B |
|
||
Price history
4 events — show timeline
- 2026-05-07 Pending — NTREIS
- 2026-04-25 Contingent — NTREIS
- 2026-04-20 Relisted — NTREIS
- 2026-03-09 Listed $75,000 NTREIS
Property tax history
+12.5%/yrLatest (2025): $395 · +0.4% YoY. Source: county tax records.
Cash-flow waterfall
monthlySold comps — $/sqft
last 12 mo · ≤1 miLoading sold comps…