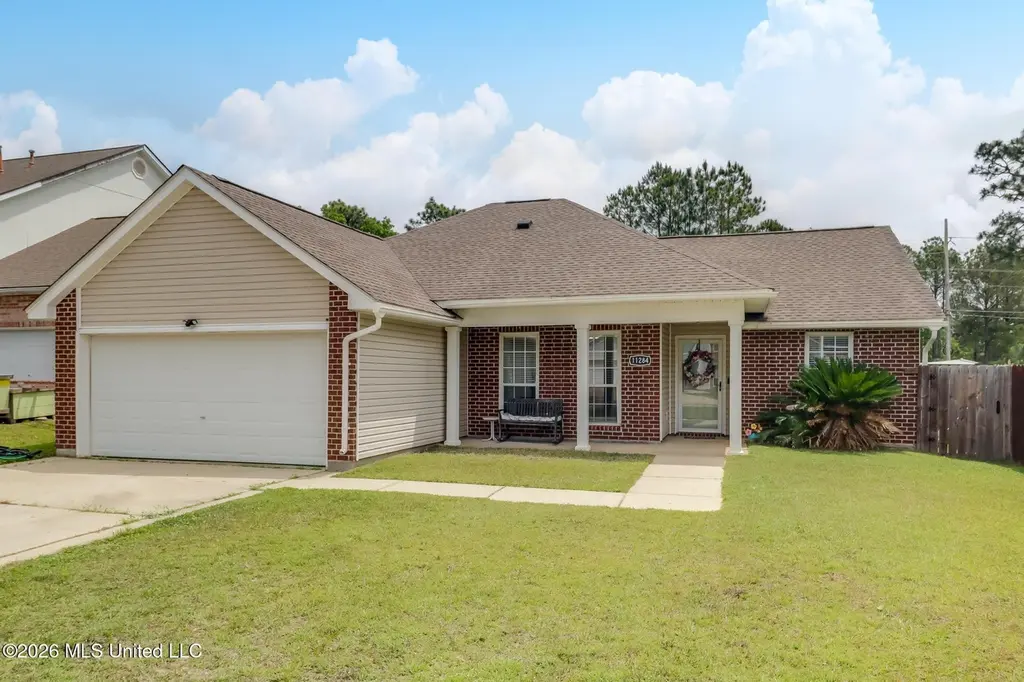
11284 Cypress Bayou Dr · Gulfport, MS
Flood risk 1/10 · Minimal
- FEMA flood zone
- X (unshaded)
- Chance of flooding over 30 yrs
- 0.0%
- Est. flood insurance / yr
- $507 – $1,088
Fire risk 5/10 · Moderate
- Est. fire insurance / yr
- $1,241 – $2,305
Heat risk 10/10 · Severe
- Hot days now (above 108°F)
- 7 days/yr
- Hot days in 30 yrs
- 23 days/yr
Wind risk 9/10 · Severe
- Chance of severe wind over 30 yrs
- 99.0%
Air-quality risk 1/10 · Minimal
- Unhealthy air days now
- 0 days/yr
- Unhealthy air days in 30 yrs
- 0 days/yr
Risk factors via First Street. Map © Google.
Why this score? — see what drove the D grade
The composite is a weighted blend of 9 inputs, each scored 0–100. Each bar is that input's sub-score; the figure is the points it added to the 100-point composite (weight × sub-score).
- Cash flow +12.7/30.0
- ARV discount +8.2/15.0
- Rent growth +4.2/5.0
- Schools +4.2/10.0
- DSCR +3.8/10.0
- Livability +3.7/5.0
- 1% rule +3.0/10.0
- Condition / age +2.5/5.0
- Appreciation +0.0/10.0
$258,000
🖨 Deal sheet (PDF) 📄 Offer letter ✓ Due diligence
Listing remarks MLS
Welcome Home! Beautiful one story home conveniently & centrally located in the Gulfport area just north of I-10. This home features a large open living space with open kitchen & dining perfect for entertaining. This home boasts a new roof that is less than a year old, new fence, updated paint. and fixtures. Come check it out today!
Key facts
- Cozy breakfast nook
- Expansive yard
- Whimsical playhouse
Tags
Property features AI
Exterior
- Parking: 2-car garage; Driveway; Garage faces front; Direct access; Concrete parking surfaces
- Utilities: Public water; Public sewer; Electricity connected; Sewer connected; Water connected
- Home design: Single-family house; One level; Move-in ready
- Construction: Brick and siding exterior; Architectural shingle roof; Slab foundation; Built in public-records year
- Exterior features: Front porch; Patio; Private yard; Rain gutters; Fenced yard (wood, privacy); Shed(s)
Interior
- Kitchen: Dishwasher; Microwave; Refrigerator
- Flooring: Luxury vinyl; Tile; Wood
- Bathrooms: 2 full bathrooms
- Heating & cooling: Central heating (electric, heat pump); Central air (electric, heat pump); Ceiling fans
- Interior features: Ceiling fans; Eat-in kitchen; Granite counters; High ceilings; Open floorplan; Soaking tub; Walk-in closets
- Laundry & utility: Indoor laundry room; Water heater
Neighborhood map
What this means for you Summary
Snapshot
- This is a 4-bed/1.0-bath single-family listed at $258k.
Deal economics
- At list price, monthly cash flow is $-28 ($-336/yr) — negative.
- To cash-flow at today's rent, offer at most $253k (1.9% below list).
- To meet the 1% rule (rent ≥ 1% of price), the offer needs to be $207k (19.9% below list).
- Recommended offer: $207k (19.9% below list) — sets the bar for 1% rule.
- Cap rate 6.2% vs local median 4.9% in Gulfport — meaningfully above typical; check what's discounted (condition, days-on-market, listing class) to confirm the premium yield is real.
Location & tenants
- Location reads 73/100 on livability (#15 in MS) — a middle-class / working-renter tenant base. Strengths: cost of living A+, housing A+, health & safety A+; Watch: schools D, amenities F, commute F.
- Harrison County School District (rural): math 52% / reading 46% proficiency, ranked #14 of 130 in MS (top 11%) — families likely to look elsewhere, expect single-tenant / working-renter base with shorter leases; 62% free/reduced lunch — lower-income household profile, screen leases tightly.
- Market conditions: Rents rising fast (+7.0%/yr); 770 active listings in the ZIP; 12 comparable units currently listed for rent nearby; rentals at typical pace (median 23d on market — plan ~3-4 weeks tenant-placement turnaround); 42% of comp listings sitting > 30 days — soft ceiling on asking rent; 2,194 units permitted in Harrison County in 2024 (0 in 5+ unit buildings).
- This rent runs 40% of the median local income ($63k/yr) — at the standard rent-burdened threshold; future hikes will face affordability resistance.
Forward outlook
- Local home prices are declining (-3.0%/yr); year-one equity from $2k of loan paydown is wiped out by about $8k of value loss. Plan a longer hold.
- Harrison County population projected at +27% by 2050 — long-run rental-demand tailwind backs the buy-and-hold thesis.
Negotiation context
- It's been on market 57 days — a 3% lower offer ($250k) is reasonable based on typical stale-listing flexibility.
- 8 sale attempts since 16y ago with the ask held roughly flat each time — persistent listings suggest the price (not the market) is what's stuck; bring a comps-based counter.
Risks & watch-outs
- Climate carrying-cost: severe wind risk, 99% chance of damaging wind over 30y; moderate wildfire risk; extreme-heat days projected 7→23/yr by 2055 (HVAC capex compounding) — expect insurance premiums to compound above CPI over the hold.
Questions for the listing agent
- What do current leases actually rent for vs. the listed asking? Can we see a recent rent roll and the last 12 months of T-12 income?
- It's been on market 57 days. Have you received any prior offers? Is the seller open to a 20% concession, seller financing, or rate buy-down credit?
- Is there a deadline driving the sale (1031 exchange, divorce, estate, relocation)? That informs how much negotiation room exists.
- Schools are D-rated, which usually means shorter tenancies and higher turnover. Who's the typical renter profile here, and what's been the actual vacancy rate?
- The area grade is low — what's the realistic commute time and amenity access for the typical tenant pool here? Any planned neighborhood developments (good or bad) we should know about?
- What's the average days-on-market for RENTAL listings here right now (not sales)? A rising rental-DOM trend means longer vacancies and softer asking-rent achievability than the comps imply.
- What's the recent tenant-quality profile in this submarket — average credit score on applications, eviction rate, late-payment / NSF rate, and stable-employment percentage? A property-management company in the area should have these aggregated.
- How much new for-sale + rental construction is in the pipeline within 1–3 miles? Heavy new supply typically softens prices + rents 12–24 months out; constrained supply supports both.
Investment metrics
- 1% rule
- 0.80% ✗
- Cap rate
- 6.16%
- Cash-on-cash
- -0.46%
- DSCR
- 0.98
- GRM
- 10.4
CMA / ARV
- ARV (median comp)
- $261,934
- List price
- $258,000
- Delta
- -1.50%
- Verdict
- FAIR
- Comps
- 20 within 1.0 mi
Show comp detail 12 sales within ~0.75 mi
| Address | Dist | Beds/Ba | Sqft | Sold | Price | $/sf | Match |
|---|---|---|---|---|---|---|---|
| 11298 Cypress Bayou Dr | 0.02mi | 4/2.0 | 1,989 (+3%) | 6mo | $149,000 | $75 | 86 |
| 11174 River Bend Dr | 0.26mi | 4/2.0 | 1,999 (+3%) | 2mo | $262,176 | $131 | 77 |
| 18119 Evergreen Dr | 0.24mi | 3/2.0 (-1) | 1,878 (-3%) | 1mo | $279,900 | $149 | 74 |
| 18026 Lake Vista Dr | 0.07mi | 3/2.0 (-1) | 2,142 (+11%) | 2mo | $274,900 | $128 | 68 |
| 18099 Lakeshore Dr | 0.36mi | 4/2.5 | 1,851 (-4%) | 3mo | $285,010 | $154 | 68 |
| 18080 Lakeshore Dr | 0.34mi | 3/2.0 (-1) | 1,848 (-4%) | 4mo | $285,650 | $155 | 64 |
| 18081 Lakeshore Dr | 0.36mi | 3/2.0 (-1) | 1,848 (-4%) | 5mo | $290,555 | $157 | 62 |
| 18123 Lakeshore Dr | 0.36mi | 3/2.0 (-1) | 1,848 (-4%) | 8mo | $286,600 | $155 | 60 |
| 11318 River Bend Dr | 0.09mi | 3/2.5 (-1) | 2,211 (+14%) | 4mo | $278,000 | $126 | 58 |
| 11426 Oak Aly | 0.32mi | 4/3.0 | 2,092 (+8%) | 8mo | $292,665 | $140 | 57 |
| 18123 Lake Vista Dr | 0.20mi | 3/2.5 (-1) | 2,163 (+12%) | 6mo | $259,900 | $120 | 55 |
| 10474 New Hope Rd | 0.68mi | 3/2.0 (-1) | 1,788 (-8%) | 4mo | $299,000 | $167 | 43 |
Match score weights: distance 35% · size 25% · config 20% · recency 20%. Top-matched comps best support the ARV.
Projected returns pro-forma
-3.0% appreciation · 6.99% rent growth · sell at horizon
- IRR
- -13.0%
- Equity multiple
- 0.52×
- Total profit
- $-34,998
- Equity at exit
- $38,469
- IRR
- 0.9%
- Equity multiple
- 1.08×
- Total profit
- $5,522
- Equity at exit
- $22,307
Cash invested: $72,240 (down + closing). Projections, not guarantees.
Landlord ↔ Tenant lean methodology
- Overall (STATE)
- 90 Strongly Landlord-Friendly
- State Mississippi
- 90 Strongly Landlord-Friendly · R+11
- County
- — inherits STATE
- City
- — inherits STATE
ZIP-level market 39503
- Home prices YoY
- -21.5%
- Rents YoY
- 7.0%
- Active inventory
- 770
- Price-to-rent
- 10.4×
Monthly cashflow live
- Estimated rent
- $2,068 high interval (Pro) →
- Mortgage (P&I)
- −$1,353
- Tax from tax record
- −$201 /mo · $2,412/yr
- Insurance
- −$108
- HOA
- −$0
- Vacancy / Maint / Mgmt
- −$434
- Net cashflow
- $-28
Break-even live
Sensitivity live
| Price | -10% $118 | -5% $45 | +0% $-28 | +5% $-101 | +10% $-174 |
|---|---|---|---|---|---|
| Rent | -10% $-191 | -5% $-110 | +0% $-28 | +5% $54 | +10% $135 |
| Rate | -1.0pp $102 | -0.5pp $38 | base $-28 | +0.5pp $-95 | +1.0pp $-163 |
UW: 25.0% down · 7.5% · 30yr · 1.5% tax · 5.0% vac · 8.0% maint · 8.0% mgmt
Financing live
Cash to close
- Down payment
- $64,500
- Closing costs
- $7,740
- Reserves months
- —
- Total cash needed
- —
Loan-product check · same deal, 3 products live
Conventional
25% down · 7.5% · 30yr
- Down + closing
- —
- Monthly P&I
- —
- Monthly cashflow
- —
- DSCR
- —
- Eligible?
- —
Personal DTI + credit; lowest rate.
DSCR
20% down · 8.5% · 30yr
- Down + closing
- —
- Monthly P&I
- —
- Monthly cashflow
- —
- DSCR
- —
- Eligible?
- —
No personal income docs; deal must DSCR.
Hard money
10% down · 12.0% · 12mo
- Down + closing
- —
- Monthly P&I
- —
- Monthly cashflow
- —
- DSCR
- —
- Eligible?
- —
Short-term bridge; refi at stabilization.
Rent comps 12 comps
| Address | Beds | Baths | Sqft | Rent | $/sqft | DOM | Units | Dist |
|---|---|---|---|---|---|---|---|---|
| 18052 Green Leaves Dr Gulfport, MS | 3.0 | 2.0 | 1485 | $1,800 | $1.21 | 23d | 1 | 0.13mi |
| 11415 Oak Alley Dr Gulfport, MS | 3.0 | 2.0 | 1495 | $1,975 | $1.32 | 15d | 1 | 0.29mi |
| 11571 Caroline Ct Gulfport, MS | 3.0 | 2.0 | 1950 | $2,000 | $1.03 | 45d | 1 | 0.62mi |
| 11604 Caroline Ct Gulfport, MS | 3.0 | 2.0 | 1660 | $1,850 | $1.11 | 46d | 1 | 0.66mi |
| 10749 Chapelwood Dr Gulfport, MS | 4.0 | 2.5 | 2306 | $2,250 | $0.98 | 45d | 1 | 0.90mi |
| 10388 Sweet Bay Dr Gulfport, MS | 3.0 | 2.0 | 1463 | $1,800 | $1.23 | 15d | 1 | 1.12mi |
| 10667 Wren Grv Gulfport, MS | 4.0 | 3.0 | 2076 | $2,850 | $1.37 | 45d | 1 | 1.14mi |
| 17986 Restoration Cir Gulfport, MS | 3.0 | 2.5 | 1730 | $2,100 | $1.21 | 15d | 1 | 1.20mi |
| 10536 Sweet Bay Dr Gulfport, MS | 4.0 | 2.0 | 1961 | $2,349 | $1.20 | 15d | 1 | 1.32mi |
| 18137 Canal Junction Dr Gulfport, MS | 3.0 | 2.0 | 1413 | $1,750 | $1.24 | 45d | 1 | 1.33mi |
| 18186 Southern Magnolia Cv Gulfport, MS | 4.0 | 2.0 | 2054 | $2,300 | $1.12 | 15d | 1 | 1.35mi |
| 11601 Oaklane Dr Gulfport, MS | 3.0 | 2.0 | 1568 | $1,525 | $0.97 | 15d | 1 | 1.43mi |
Listing history 35 events
-
2026-06-21days on market $258,000 Active 57 DOM
-
2026-06-18days on market $258,000 Active 54 DOM
-
2026-06-17days on market $258,000 Active 53 DOM
-
2026-06-16days on market $258,000 Active 52 DOM
-
2026-06-15days on market $258,000 Active 51 DOM
-
2026-06-14days on market $258,000 Active 49 DOM
-
2026-06-13days on market $258,000 Active 48 DOM
-
2026-06-10days on market $258,000 Active 46 DOM
-
2026-06-09days on market $258,000 Active 45 DOM
-
2026-06-08days on market $258,000 Active 44 DOM
-
2026-06-07days on market $258,000 Active 43 DOM
-
2026-06-02days on market $258,000 Active 38 DOM
-
2026-06-01days on market $258,000 Active 37 DOM
-
2026-05-31days on market $258,000 Active 36 DOM
-
2026-05-30days on market $258,000 Active 35 DOM
-
2026-04-25$259,000 Active 915-char remark
-
2026-04-06historical
-
2026-02-09price $260,000
-
2025-10-19$265,000 Active
-
2021-11-18soldstatus
-
2021-11-15soldstatus Closed
Show marketing remark (341 chars)
Welcome Home! Beautiful one story home conveniently & centrally located in the Gulfport area just north of I-10. This home features a large open living space with open kitchen & dining perfect for entertaining. This home boasts a new roof that is less than a year old, new fence, updated paint. and fixtures. Come check it out today!
-
2021-10-06historical
Show marketing remark (341 chars)
Welcome Home! Beautiful one story home conveniently & centrally located in the Gulfport area just north of I-10. This home features a large open living space with open kitchen & dining perfect for entertaining. This home boasts a new roof that is less than a year old, new fence, updated paint. and fixtures. Come check it out today!
-
2021-10-02historical
-
2021-09-17$245,000
Show marketing remark (341 chars)
Welcome Home! Beautiful one story home conveniently & centrally located in the Gulfport area just north of I-10. This home features a large open living space with open kitchen & dining perfect for entertaining. This home boasts a new roof that is less than a year old, new fence, updated paint. and fixtures. Come check it out today!
-
2021-09-15historical
-
2021-01-04soldstatus
-
2020-12-30soldstatus
-
2020-06-30$174,900
-
2020-06-24historical
-
2020-06-11$184,900
-
2017-02-14$179,900
-
2016-06-27$174,000
-
2010-05-21soldstatus
-
2010-04-29soldstatus
-
2010-02-05$179,000
ⓘ Source: listings_history table (triggers on properties + properties_extension) + one-shot
backfill from property_details.listing_events for pre-trigger history.
Tax reassessment forecast MS · Resets to sale price
- Current annual tax
- $2,412 · $201/mo
- Projected year-2 tax
- $2,412 · $201/mo
- Expected delta
- $0/yr ($0/mo · 0.0%)
ⓘ Screening estimate from a state-policy table — verify with the county assessor before closing.
Climate risk First Street
- Flood 1/10 Low FEMA zone X (unshaded) · 0% chance over 30 yrs
- Wildfire 5/10 Major
- Heat 10/10 Extreme 7 d/yr ≥108°F today · 23 d/yr by 30 yrs out
- Wind 9/10 Extreme 99% chance of damaging wind over 30 yrs
- Air quality 1/10 Low 0 unhealthy d/yr today · 0 by 30 yrs out
Nearby sold comps map
Loading sold comps map…
Walkable amenities ~0.75 mi
Loading nearby amenities…
Taxation est. · year 1
- Rental income
- $24,812
- − Mortgage interest
- −$14,452
- − Property taxes
- −$2,412
- − Insurance
- −$1,290
- − Repairs & maintenance
- −$1,985
- − Management
- −$1,985
- − Depreciation
- −$7,505
- Taxable loss
- −$4,817
- Est. tax savings @ 24.0%
- +$1,156
- After-tax cash flow
- $820/yr
For passive investors: Depreciation is non-cash, so a rental often shows a tax loss while cash-flowing — sheltering income. Rental losses are passive: they offset passive income freely, and up to $25,000/yr can offset ordinary (W-2) income if you actively participate and your MAGI is under $100k (phasing out to $0 by $150k); unused losses carry forward. On sale, claimed depreciation is recaptured at up to 25%, and gains may owe capital-gains tax (a 1031 exchange can defer both). Figures are a year-1 estimate at your 24.0% rate — not tax advice; consult a CPA.
Schools (NCES district)
- District
- Harrison County School District
- NCES district ID
- 2801770
- Math proficiency
- 52% ▼ -4.00%
- Reading proficiency
- 46% ▼ -4.00%
- Median HH income
- $46,504
- Composite
- 41.66/100
- National rank
- #3419
- State rank
- #14 of 130 in MS
Livability — Gulfport
- Score
- 73/100
- State rank
- #15
- US rank
- #5010
Category grades
Schools grade is shown separately in the Schools card above.
Census & demographics
- County
- Harrison County · 178,171 people
- City population
- 96,188
- Metro
- Gulfport-Biloxi, MS
- Population (ZIP)
- 55,059
- Household income
- $62,641
- Rent vs Own
- Severe rent burden
- 1686.0
Population outlook (Harrison County) Hauer SSP2
- Today (2025)
- 228,444 people
- By 2030
- 241,942 · +5.9%
- By 2040
- 267,531 · +17.1%
- By 2050
- 291,062 · +27.4%
- By 2075
- 346,711 · +51.8%
- By 2100
- 378,165 · +65.5%
Race, ethnicity, and origin ACS 2023
- Neighborhood character
- Diverse neighborhood (Simpson 0.58)
- Race & ethnicity
- White 58% Black 27% Two or more races 9% Hispanic / Latino 6% Asian 2%
- Hispanic origin (detail)
- Mexican 2% Puerto Rican 1%
- Common ancestry
- Lithuanian 5% Slovak 1% Portuguese 1%
- Foreign-born
- 3% · Canada
- Languages at home
- 95% English-only · Spanish 3%
Political lean MEDSL · Harrison
- 2024 margin
- Strong R (+28.9) · D 35.0% · R 63.9% · Other 1.1%
- 2008→2024 swing
- -2.9pp toward R · 2008: -26.0pp · 2024: -28.9pp
- All cycles
- 2024: R+28.9 2020: R+25.2 2016: R+30.7 2012: R+26.6 2008: R+26.0
Not yet ingested
- Civics
- —
Market trends
- HPI YoY
- ▼ -51.39%
- Current HPI
- 187.285
- Rent YoY
- ▲ 6.99%
- Metro
- Gulfport-Biloxi, MS
- State GDP YoY
- —
- F500 in state
- 0
Price history
+44.1% since first listed21 events — show timeline
- 2026-05-28 Price Changed $258,000 MLSU
- 2026-04-25 Listed $259,000 MLSU
- 2026-04-06 Listing Removed — MLSU
- 2026-02-09 Price Changed $260,000 MLSU
- 2025-10-19 Listed $265,000 MLSU
- 2021-11-18 Sold (Public Records) — Public Records
- 2021-11-15 Sold (MLS) — MLSU
- 2021-10-06 Listing Removed — MLSU
- 2021-10-02 Listing Removed — MLSU
- 2021-09-17 Listed $245,000 MLSU
- 2021-09-15 Listing Removed — MLSU
- 2021-01-04 Sold (Public Records) — Public Records
- 2020-12-30 Sold (MLS) — MLSU
- 2020-06-30 Listed $174,900 MLSU
- 2020-06-24 Listing Removed — MLSU
- 2020-06-11 Listed $184,900 MLSU
- 2017-02-14 Listed $179,900 MLSU
- 2016-06-27 Listed $174,000 MLSU
- 2010-05-21 Sold (Public Records) — Public Records
- 2010-04-29 Sold (MLS) — MLSU
- 2010-02-05 Listed $179,000 MLSU
Property tax history
+4.7%/yrLatest (2025): $2,412 · +10.7% YoY. Source: county tax records.
Cash-flow waterfall
monthlySold comps — $/sqft
last 12 mo · ≤1 miLoading sold comps…