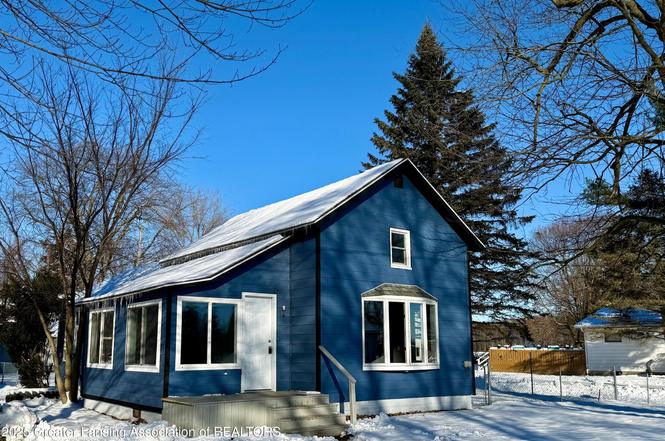
129 E Fulton St · Perrinton, MI
Flood risk 1/10 · Minimal
- FEMA flood zone
- X (unshaded)
- Chance of flooding over 30 yrs
- 0.0%
- Est. flood insurance / yr
- $473 – $860
Fire risk 1/10 · Minimal
- Est. fire insurance / yr
- $784 – $1,456
Heat risk 2/10 · Minimal
- Hot days now (above 99°F)
- 7 days/yr
- Hot days in 30 yrs
- 15 days/yr
Wind risk 1/10 · Minimal
- Chance of severe wind over 30 yrs
- —
Air-quality risk 2/10 · Minimal
- Unhealthy air days now
- 1 days/yr
- Unhealthy air days in 30 yrs
- 2 days/yr
Risk factors via First Street. Map © Google.
Why this score? — see what drove the D grade
The composite is a weighted blend of 9 inputs, each scored 0–100. Each bar is that input's sub-score; the figure is the points it added to the 100-point composite (weight × sub-score).
- Cash flow +13.8/30.0
- ARV discount +5.3/15.0
- Appreciation +5.0/10.0
- DSCR +4.2/10.0
- Schools +3.4/10.0
- Livability +2.9/5.0
- 1% rule +2.7/10.0
- Rent growth +2.5/5.0
- Condition / age +2.5/5.0
$159,000
🖨 Deal sheet (PDF) 📄 Offer letter ✓ Due diligence
Listing remarks MLS
Welcome to 129 E Fulton St in Pompeii MI. This is a great home with many updates to the kitchen to the bathroom and the flooring and fixtures. Welcome to a small town where life is relaxed. You will love it. The kitchen appliances are newly installed and are stainless steel finish. The cabinets and counters are newly installed also. Schedule your showing today.
Key facts
- Kitchen appliances
- 0.5 acre lot
- 2 garage spots
Tags
Neighborhood map
What this means for you Summary
Snapshot
- This is a 3-bed/1.0-bath single-family listed at $159k.
Deal economics
- At list price, monthly cash flow is $16 ($188/yr) — positive.
- The deal already cash-flows at list — no discount required.
- To meet the 1% rule (rent ≥ 1% of price), the offer needs to be $122k (23.2% below list).
- Recommended offer: $122k (23.2% below list) — sets the bar for 1% rule.
Location & tenants
- Location reads 58/100 on livability (#628 in MI) — a working-class tenant base; expect higher turnover. Strengths: cost of living A+, housing A+; Watch: employment C-, crime F, amenities F.
- Ithaca Public Schools (rural): math 31% / reading 48% proficiency, ranked #221 of 540 in MI (top 41%) — families likely to look elsewhere, expect single-tenant / working-renter base with shorter leases.
- Zoned schools: North Elementary School (math 29% / reading 44%, grade F, #720 of 1,397 statewide, top 52%, 305 students, 56% FRL); Ithaca High School (math 33% / reading 53%, grade F, #260 of 713 statewide, top 37%, 467 students, 44% FRL).
- Market conditions: 2 active listings in the ZIP; 47 units permitted in Gratiot County in 2024 (0 in 5+ unit buildings).
Forward outlook
- In year one you build about $6k of equity ($1k loan paydown + $5k appreciation (3.0% local appreciation)).
- Gratiot County population projected at -14% by 2050 — secular population decline; favor cash flow + early exit over multi-decade hold.
- At projected returns (3.0% appreciation + 3.0% rent growth), your $45k cash investment doubles in ~6 years — after that, you're playing with house money.
- By year 6, paydown + projected appreciation supports a ~$31k cash-out refi (75% LTV) — recoverable capital for the next deal without selling this one.
Negotiation context
- It's been on market 94 days — a 9% lower offer ($145k) is reasonable based on typical stale-listing flexibility.
- 2 sale attempts with the ask held roughly flat each time — persistent listings suggest the price (not the market) is what's stuck; bring a comps-based counter.
- Current owner paid $25k; list at $159k implies a 536% gain — meaningful room to come down on a strong offer.
Risks & watch-outs
- Watch-outs: built in 1900 — expect roof / HVAC / electrical / plumbing capex.
Questions for the listing agent
- It's been on market 94 days. Have you received any prior offers? Is the seller open to a 23% concession, seller financing, or rate buy-down credit?
- Built in 1900 — when were the roof, HVAC, electrical panel, plumbing, and water heater last replaced?
- Why hasn't it sold? Are there any deal-killer items the seller is aware of (foundation, flood, title, zoning, code violations)?
- Is there a deadline driving the sale (1031 exchange, divorce, estate, relocation)? That informs how much negotiation room exists.
- Schools are F-rated, which usually means shorter tenancies and higher turnover. Who's the typical renter profile here, and what's been the actual vacancy rate?
- Crime grade is F in this area — have there been break-ins, vandalism, or insurance claims at this property in the last 3 years? What carrier currently insures it and at what premium?
- The area grade is low — what's the realistic commute time and amenity access for the typical tenant pool here? Any planned neighborhood developments (good or bad) we should know about?
- What's the average days-on-market for RENTAL listings here right now (not sales)? A rising rental-DOM trend means longer vacancies and softer asking-rent achievability than the comps imply.
- What's the recent tenant-quality profile in this submarket — average credit score on applications, eviction rate, late-payment / NSF rate, and stable-employment percentage? A property-management company in the area should have these aggregated.
- How much new for-sale + rental construction is in the pipeline within 1–3 miles? Heavy new supply typically softens prices + rents 12–24 months out; constrained supply supports both.
Investment metrics
- 1% rule
- 0.77% ✗
- Cap rate
- 6.41%
- Cash-on-cash
- 0.42%
- DSCR
- 1.02
- GRM
- 10.9
CMA / ARV
- ARV (on-the-fly)
- $151,728
- Comps found
- 2
Show comp detail 2 sales within ~0.75 mi
| Address | Dist | Beds/Ba | Sqft | Sold | Price | $/sf | Match |
|---|---|---|---|---|---|---|---|
| 129 E Fulton St | 0.00mi | 3/1.0 | 1,308 (0%) | 1mo | $152,000 | $116 | 99 |
| 123 Burton St | 0.13mi | 3/1.0 | 1,491 (+14%) | 24mo | $163,200 | $109 | 51 |
Match score weights: distance 35% · size 25% · config 20% · recency 20%. Top-matched comps best support the ARV.
Projected returns pro-forma
3.0% appreciation · 3.0% rent growth · sell at horizon
- IRR
- 7.9%
- Equity multiple
- 1.45×
- Total profit
- $20,079
- Equity at exit
- $71,493
- IRR
- 10.5%
- Equity multiple
- 2.57×
- Total profit
- $70,003
- Equity at exit
- $110,180
Cash invested: $44,520 (down + closing). Projections, not guarantees.
Landlord ↔ Tenant lean methodology
- Overall (STATE)
- 62 Landlord-Friendly
- State Michigan
- 62 Landlord-Friendly · EVEN
- County
- — inherits STATE
- City
- — inherits STATE
ZIP-level market 48874
- Active inventory
- 2
- Price-to-rent
- 10.9×
Monthly cashflow live
- Estimated rent
- $1,221 medium interval (Pro) →
- Mortgage (P&I)
- −$834
- Tax from tax record
- −$49 /mo · $582/yr
- Insurance
- −$66
- HOA
- −$0
- Vacancy / Maint / Mgmt
- −$256
- Net cashflow
- $16
Break-even live
Sensitivity live
| Price | -10% $106 | -5% $61 | +0% $16 | +5% $-29 | +10% $-74 |
|---|---|---|---|---|---|
| Rent | -10% $-81 | -5% $-33 | +0% $16 | +5% $64 | +10% $112 |
| Rate | -1.0pp $96 | -0.5pp $56 | base $16 | +0.5pp $-26 | +1.0pp $-67 |
UW: 25.0% down · 7.5% · 30yr · 1.5% tax · 5.0% vac · 8.0% maint · 8.0% mgmt
Financing live
Cash to close
- Down payment
- $39,750
- Closing costs
- $4,770
- Reserves months
- —
- Total cash needed
- —
Loan-product check · same deal, 3 products live
Conventional
25% down · 7.5% · 30yr
- Down + closing
- —
- Monthly P&I
- —
- Monthly cashflow
- —
- DSCR
- —
- Eligible?
- —
Personal DTI + credit; lowest rate.
DSCR
20% down · 8.5% · 30yr
- Down + closing
- —
- Monthly P&I
- —
- Monthly cashflow
- —
- DSCR
- —
- Eligible?
- —
No personal income docs; deal must DSCR.
Hard money
10% down · 12.0% · 12mo
- Down + closing
- —
- Monthly P&I
- —
- Monthly cashflow
- —
- DSCR
- —
- Eligible?
- —
Short-term bridge; refi at stabilization.
Listing history 5 events
-
2026-03-07status Pending 363-char remark
Show marketing remark (363 chars)
Welcome to 129 E Fulton St in Pompeii MI. This is a great home with many updates to the kitchen to the bathroom and the flooring and fixtures. Welcome to a small town where life is relaxed. You will love it. The kitchen appliances are newly installed and are stainless steel finish. The cabinets and counters are newly installed also. Schedule your showing today.
-
2026-03-07status Pending
Show marketing remark (363 chars)
Welcome to 129 E Fulton St in Pompeii MI. This is a great home with many updates to the kitchen to the bathroom and the flooring and fixtures. Welcome to a small town where life is relaxed. You will love it. The kitchen appliances are newly installed and are stainless steel finish. The cabinets and counters are newly installed also. Schedule your showing today.
-
2025-12-03$159,000 Active 363-char remark
Show marketing remark (363 chars)
Welcome to 129 E Fulton St in Pompeii MI. This is a great home with many updates to the kitchen to the bathroom and the flooring and fixtures. Welcome to a small town where life is relaxed. You will love it. The kitchen appliances are newly installed and are stainless steel finish. The cabinets and counters are newly installed also. Schedule your showing today.
-
2025-12-03$159,000 Active
Show marketing remark (363 chars)
Welcome to 129 E Fulton St in Pompeii MI. This is a great home with many updates to the kitchen to the bathroom and the flooring and fixtures. Welcome to a small town where life is relaxed. You will love it. The kitchen appliances are newly installed and are stainless steel finish. The cabinets and counters are newly installed also. Schedule your showing today.
-
2025-08-05soldstatus $25,000
ⓘ Source: listings_history table (triggers on properties + properties_extension) + one-shot
backfill from property_details.listing_events for pre-trigger history.
Tax reassessment forecast MI · Partial reset (capped growth)
- Current annual tax
- $582 · $49/mo
- Projected year-2 tax
- $1,515 · $126/mo
- Expected delta
- +$933/yr (+$78/mo · 160.3%)
ⓘ Screening estimate from a state-policy table — verify with the county assessor before closing.
Climate risk First Street
- Flood 1/10 Low FEMA zone X (unshaded) · 0% chance over 30 yrs
- Wildfire 1/10 Low
- Heat 2/10 Low 7 d/yr ≥99°F today · 15 d/yr by 30 yrs out
- Wind 1/10 Low
- Air quality 2/10 Low 1 unhealthy d/yr today · 2 by 30 yrs out
Nearby sold comps map
Loading sold comps map…
Walkable amenities ~0.75 mi
Loading nearby amenities…
Taxation est. · year 1
- Rental income
- $14,647
- − Mortgage interest
- −$8,906
- − Property taxes
- −$582
- − Insurance
- −$795
- − Repairs & maintenance
- −$1,172
- − Management
- −$1,172
- − Depreciation
- −$4,625
- Taxable loss
- −$2,606
- Est. tax savings @ 24.0%
- +$625
- After-tax cash flow
- $814/yr
For passive investors: Depreciation is non-cash, so a rental often shows a tax loss while cash-flowing — sheltering income. Rental losses are passive: they offset passive income freely, and up to $25,000/yr can offset ordinary (W-2) income if you actively participate and your MAGI is under $100k (phasing out to $0 by $150k); unused losses carry forward. On sale, claimed depreciation is recaptured at up to 25%, and gains may owe capital-gains tax (a 1031 exchange can defer both). Figures are a year-1 estimate at your 24.0% rate — not tax advice; consult a CPA.
Schools (NCES district)
- District
- Ithaca Public Schools
- NCES district ID
- 2619580
- Math proficiency
- 31% ▼ -9.00%
- Reading proficiency
- 48% ▼ -7.00%
- Median HH income
- $45,626
- Composite
- 33.6/100
- National rank
- #5412
- State rank
- #221 of 540 in MI
Livability — Perrinton
- Score
- 58/100
- State rank
- #628
- US rank
- #21142
Category grades
Schools grade is shown separately in the Schools card above.
Census & demographics
- Population (ZIP)
- 160
Population outlook (Gratiot County) Hauer SSP2
- Today (2025)
- 39,991 people
- By 2030
- 38,944 · -2.6%
- By 2040
- 36,694 · -8.2%
- By 2050
- 34,314 · -14.2%
- By 2075
- 27,693 · -30.8%
- By 2100
- 20,809 · -48.0%
Race, ethnicity, and origin ACS 2023
- Neighborhood character
- Diverse neighborhood (Simpson 0.56)
- Race & ethnicity
- White 58% Black 32% Hispanic / Latino 11% Two or more races 11%
- Hispanic origin (detail)
- Common ancestry
- Iranian 21% Slovak 11%
Political lean MEDSL · Gratiot
- 2024 margin
- Solid R (+31.3) · D 33.7% · R 65.0% · Other 1.4%
- 2008→2024 swing
- -35.7pp toward R · 2008: 4.4pp · 2024: -31.3pp
- All cycles
- 2024: R+31.3 2020: R+28.3 2016: R+25.6 2012: R+3.9 2008: D+4.4
Not yet ingested
- Civics
- —
Market trends
- HPI YoY
- —
- Current HPI
- —
- Rent YoY
- —
- Metro
- —
- State GDP YoY
- ▲ 1.37%
- F500 in state
- 28
Industry mix (Fortune 500 HQ in MI)
| Industry | F500 HQs | Revenue |
|---|---|---|
| Automotive Parts | 3 | $48B |
|
||
| Automotive | 2 | $372B |
|
||
| Chemicals | 1 | $45B |
|
||
| Automotive Retail | 1 | $29B |
|
||
| Healthcare / Medical Devices | 1 | $23B |
|
||
| Automotive Technology | 1 | $20B |
|
||
Price history
+536.0% since first listed5 events — show timeline
- 2026-03-07 Pending — REALCOMP
- 2026-03-07 Pending — Greater Lansing AoR
- 2025-12-03 Listed $159,000 Greater Lansing AoR
- 2025-12-03 Listed $159,000 REALCOMP
- 2025-08-05 Sold (Public Records) $25,000 Public Records
Cash-flow waterfall
monthlySold comps — $/sqft
last 12 mo · ≤1 miLoading sold comps…