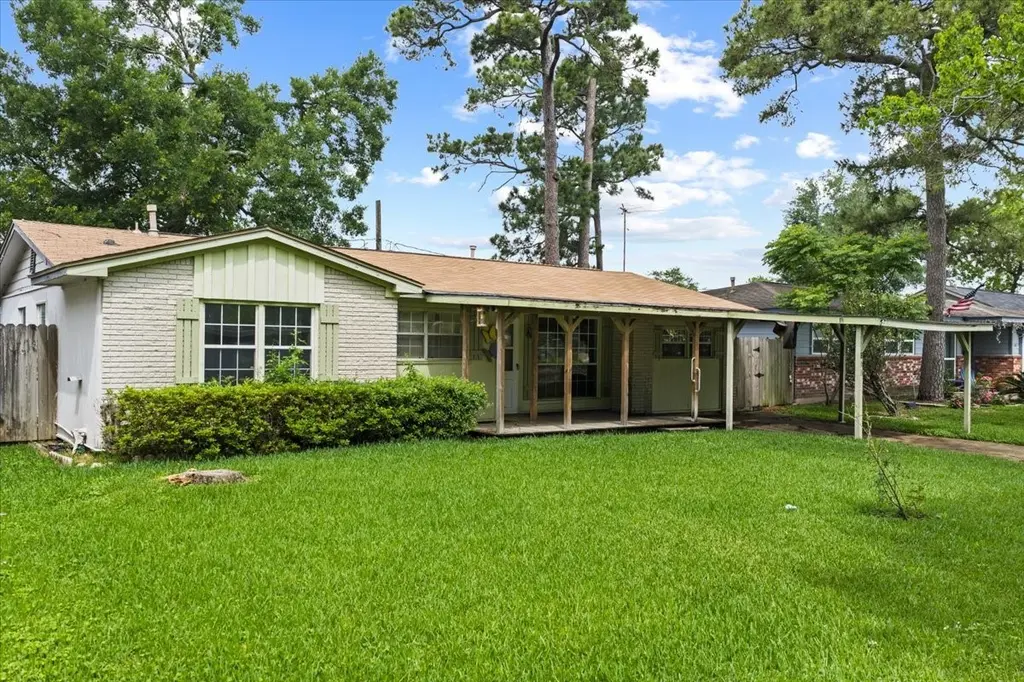
811 Shadowglen St · Channelview, TX
Flood risk 1/10 · Minimal
- FEMA flood zone
- X (unshaded)
- Chance of flooding over 30 yrs
- 0.0%
- Est. flood insurance / yr
- $507 – $1,088
Fire risk 2/10 · Minimal
- Est. fire insurance / yr
- $1,222 – $2,270
Heat risk 10/10 · Severe
- Hot days now (above 109°F)
- 7 days/yr
- Hot days in 30 yrs
- 24 days/yr
Wind risk 9/10 · Severe
- Chance of severe wind over 30 yrs
- 99.0%
Air-quality risk 2/10 · Minimal
- Unhealthy air days now
- 2 days/yr
- Unhealthy air days in 30 yrs
- 2 days/yr
Risk factors via First Street. Map © Google.
Why this score? — see what drove the B- grade
The composite is a weighted blend of 9 inputs, each scored 0–100. Each bar is that input's sub-score; the figure is the points it added to the 100-point composite (weight × sub-score).
- Cash flow +25.9/30.0
- ARV discount +14.3/15.0
- DSCR +8.7/10.0
- 1% rule +7.8/10.0
- Rent growth +5.0/5.0
- Livability +3.3/5.0
- Schools +2.5/10.0
- Condition / age +2.5/5.0
- Appreciation +0.0/10.0
$150,000
🖨 Deal sheet 📄 Offer letter ✓ Due diligence
Listing remarks
Welcome to a home filled with history, heart, and opportunity. Lovingly owned by the same family for over 50 years, this 3-bedroom, 1-bath property is ready to begin its next chapter with new owners. Inside, you’ll find a layout full of potential—perfect for those looking to create a space that truly reflects their style. Whether you’re envisioning modern updates, cozy charm, or something entirely your own, this home offers the ideal canvas. Thoughtfully priced with future improvements in mind, this property gives you the flexibility to invest in updates and personal touches while building equity along the way. It’s a rare chance to own a home with such a long-standi
Key facts
- 6,098 sq ft lot
- 2 parking spots
- Built 1960
Property features AI
Exterior
- Parking: Attached carport; 2-car carport
- Utilities: Public water; Public sewer
- Home design: Residential property; Built in 1960
- Construction: Brick and wood siding exterior; Composition roof
- Exterior features: Subdivision lot
Interior
- Kitchen: Kitchen on the first floor
- Bedrooms: Primary bedroom on the first floor; Additional bedrooms on the first floor
- Bathrooms: 1 full bathroom
- Heating & cooling: Central heating (gas); Central air conditioning (electric)
- Interior features: Dining room; Living room; Total of 6 rooms
Neighborhood map
What this means for you Summary
Snapshot
- This is a 3-bed/1.0-bath single-family listed at $150k.
Deal economics
- At list price, monthly cash flow is $369 ($4k/yr) — positive.
- The deal already cash-flows at list — no discount required.
- Meets the 1% rule at list price ($2k rent vs $150k).
- Cap rate 9.2% vs local median 4.8% in Channelview — top-decile yield for the area; either an underpriced asset or a hidden risk that comps aren't pricing in. Stress-test before assuming the spread holds.
Location & tenants
- Location reads 66/100 on livability (#598 in TX) — a middle-class / working-renter tenant base. Strengths: cost of living A+, housing A+; Watch: crime F, amenities F, commute F.
- Channelview ISD (suburban): math 27% / reading 30% proficiency, ranked #640 of 826 in TX (top 78%) — low school quality limits family demand, transient renter base, plan for 1-2y turnover; 70% free/reduced lunch — lower-income household profile, screen leases tightly.
- Zoned schools: Channelview H S (math 24% / reading 35%, grade F, #1,112 of 1,632 statewide, top 70%, 2,893 students, 87% FRL) — zoned schools average 87% FRL vs 70% district-wide (17 pts higher); higher-poverty schools than district average — tighter screening recommended.
- Market conditions: Rents rising fast (+16.9%/yr); 100 active listings in the ZIP; 5 comparable units currently listed for rent nearby; rentals leasing fast (median 5d on market — plan ~1-2 weeks tenant-placement turnaround); 29,883 units permitted in Harris County in 2024 (8,621 in 5+ unit buildings).
- This rent runs 37% of the median local income ($62k/yr) — at the standard rent-burdened threshold; future hikes will face affordability resistance.
Forward outlook
- Local home prices are declining (-3.0%/yr); year-one equity from $1k of loan paydown is wiped out by about $4k of value loss. Plan a longer hold.
- Harris County population projected at +47% by 2050 — long-run rental-demand tailwind backs the buy-and-hold thesis.
- At projected returns (-3.0% appreciation + 8.0% rent growth), your $42k cash investment doubles in ~7 years — after that, you're playing with house money.
Negotiation context
- Only 11 days on market — expect competitive offers; lowballing is unlikely to land.
Risks & watch-outs
- Climate carrying-cost: severe wind risk, 99% chance of damaging wind over 30y; extreme-heat days projected 7→24/yr by 2055 (HVAC capex compounding) — expect insurance premiums to compound above CPI over the hold.
Questions for the listing agent
- Built in 1960 — when were the roof, HVAC, electrical panel, plumbing, and water heater last replaced?
- Is there a deadline driving the sale (1031 exchange, divorce, estate, relocation)? That informs how much negotiation room exists.
- Schools are D-rated, which usually means shorter tenancies and higher turnover. Who's the typical renter profile here, and what's been the actual vacancy rate?
- Crime grade is F in this area — have there been break-ins, vandalism, or insurance claims at this property in the last 3 years? What carrier currently insures it and at what premium?
- What's the average days-on-market for RENTAL listings here right now (not sales)? A rising rental-DOM trend means longer vacancies and softer asking-rent achievability than the comps imply.
- What's the recent tenant-quality profile in this submarket — average credit score on applications, eviction rate, late-payment / NSF rate, and stable-employment percentage? A property-management company in the area should have these aggregated.
- How much new for-sale + rental construction is in the pipeline within 1–3 miles? Heavy new supply typically softens prices + rents 12–24 months out; constrained supply supports both.
Investment metrics
- 1% rule
- 1.28% ✓
- Cap rate
- 9.24%
- Cash-on-cash
- 10.53%
- DSCR
- 1.47
- GRM
- 6.5
CMA / ARV
- ARV (median comp)
- $176,475
- List price
- $150,000
- Delta
- -15.00%
- Verdict
- UNDERPRICED
- Comps
- 20 within 1.0 mi
Show comp detail 12 sales within ~0.75 mi
| Address | Dist | Beds/Ba | Sqft | Sold | Price | $/sf | Match |
|---|---|---|---|---|---|---|---|
| 811 Shadowglen St | 0.00mi | 3/1.0 | 1,306 (0%) | 0mo | $150,000 | $115 | 100 |
| 714 Horncastle St | 0.39mi | 3/1.0 | 1,284 (-2%) | 6mo | $164,999 | $129 | 74 |
| 734 Dell Dale St | 0.19mi | 3/1.5 | 1,471 (+13%) | 0mo | $150,000 | $102 | 68 |
| 15506 Vonnett St | 0.31mi | 4/2.0 (+1) | 1,400 (+7%) | 6mo | $219,000 | $156 | 60 |
| 702 Norell St | 0.44mi | 3/2.0 | 1,180 (-10%) | 3mo | $235,000 | $199 | 57 |
| 819 Knob Hollow St | 0.16mi | 3/2.0 | 1,145 (-12%) | 14mo | $209,999 | $183 | 57 |
| 741 Tobe St | 0.32mi | 4/2.0 (+1) | 1,400 (+7%) | 11mo | $189,900 | $136 | 55 |
| 904 Willaby St | 0.47mi | 3/2.0 | 1,364 (+4%) | 14mo | $215,000 | $158 | 55 |
| 722 Woodhue St | 0.59mi | 3/1.0 | 1,204 (-8%) | 13mo | $190,500 | $158 | 49 |
| 15208 Grassington Dr | 0.58mi | 3/2.0 | 1,282 (-2%) | 20mo | $219,000 | $171 | 49 |
| 714 Donfield St | 0.69mi | 3/2.0 | 1,154 (-12%) | 2mo | $139,990 | $121 | 43 |
| 1118 Chestnut Bough St | 0.65mi | 3/2.0 | 1,499 (+15%) | 1mo | $225,000 | $150 | 40 |
Match score weights: distance 35% · size 25% · config 20% · recency 20%. Top-matched comps best support the ARV.
Projected returns pro-forma
-3.0% appreciation · 8.0% rent growth · sell at horizon
- IRR
- 5.4%
- Equity multiple
- 1.22×
- Total profit
- $9,403
- Equity at exit
- $22,365
- IRR
- 19.2%
- Equity multiple
- 3.02×
- Total profit
- $84,925
- Equity at exit
- $12,969
Cash invested: $42,000 (down + closing). Projections, not guarantees.
Landlord ↔ Tenant lean methodology
- Overall (STATE)
- 87 Strongly Landlord-Friendly
- State Texas
- 87 Strongly Landlord-Friendly · R+5
- County
- — inherits STATE
- City
- — inherits STATE
ZIP-level market 77530
- Rents YoY
- 16.9%
- Active inventory
- 100
- Price-to-rent
- 6.5×
Monthly cashflow live
- Estimated rent
- $1,917 high interval (Pro) →
- Mortgage (P&I)
- −$787
- Tax from tax record
- −$297 /mo · $3,559/yr
- Insurance
- −$62
- HOA
- −$0
- Vacancy / Maint / Mgmt
- −$403
- Net cashflow
- $369
Break-even live
UW: 25.0% down · 7.5% · 30yr · 1.5% tax · 5.0% vac · 8.0% maint · 8.0% mgmt
Financing live
Cash to close
- Down payment
- $37,500
- Closing costs
- $4,500
- Reserves months
- —
- Total cash needed
- —
Loan-product check · same deal, 3 products live
Conventional
25% down · 7.5% · 30yr
- Down + closing
- —
- Monthly P&I
- —
- Monthly cashflow
- —
- DSCR
- —
- Eligible?
- —
Personal DTI + credit; lowest rate.
DSCR
20% down · 8.5% · 30yr
- Down + closing
- —
- Monthly P&I
- —
- Monthly cashflow
- —
- DSCR
- —
- Eligible?
- —
No personal income docs; deal must DSCR.
Hard money
10% down · 12.0% · 12mo
- Down + closing
- —
- Monthly P&I
- —
- Monthly cashflow
- —
- DSCR
- —
- Eligible?
- —
Short-term bridge; refi at stabilization.
Rent comps 5 comps
| Address | Beds | Baths | Sqft | Rent | $/sqft | DOM | Units | Dist |
|---|---|---|---|---|---|---|---|---|
| 15255 Ferness Ln Channelview, TX | 4.0 | 2.0 | 1326 | $1,668 | $1.26 | 2d | 10 | 0.60mi |
| 947 Leadenhall Cir Channelview, TX | 3.0 | 2.5 | 1620 | $1,856 | $1.15 | 7d | 1 | 0.66mi |
| 1379 Dell Dale St Channelview, TX | 4.0 | 2.0 | 1444 | $1,893 | $1.31 | 5d | 1 | 0.95mi |
| 1335 Willersley Ln Channelview, TX | 3.0 | 2.0 | 1669 | $1,775 | $1.06 | 2d | 1 | 1.04mi |
| 810 Townley St Channelview, TX | 3.0 | 3.5 | 1713 | $1,925 | $1.12 | 43d | 1 | 1.06mi |
Listing history 3 events
-
2026-05-05status Pending 888-char remark
-
2026-04-24$150,000 Active 888-char remark
-
1988-01-02soldstatus
ⓘ Source: listings_history table (triggers on properties + properties_extension) + one-shot
backfill from property_details.listing_events for pre-trigger history.
Tax reassessment forecast TX · Resets to sale price
- Current annual tax
- $3,559 · $297/mo
- Projected year-2 tax
- $3,559 · $297/mo
- Expected delta
- $0/yr ($0/mo · 0.0%)
ⓘ Screening estimate from a state-policy table — verify with the county assessor before closing.
Climate risk First Street
- Flood 1/10 Low FEMA zone X (unshaded) · 0% chance over 30 yrs
- Wildfire 2/10 Low
- Heat 10/10 Extreme 7 d/yr ≥109°F today · 24 d/yr by 30 yrs out
- Wind 9/10 Extreme 99% chance of damaging wind over 30 yrs
- Air quality 2/10 Low 2 unhealthy d/yr today · 2 by 30 yrs out
Nearby sold comps map
Loading sold comps map…
Walkable amenities ~0.75 mi
Loading nearby amenities…
Taxation est. · year 1
- Rental income
- $23,004
- − Mortgage interest
- −$8,402
- − Property taxes
- −$3,559
- − Insurance
- −$750
- − Repairs & maintenance
- −$1,840
- − Management
- −$1,840
- − Depreciation
- −$4,364
- Taxable income
- $2,248
- Est. tax owed @ 24.0%
- −$540
- After-tax cash flow
- $3,885/yr
For passive investors: Depreciation is non-cash, so a rental often shows a tax loss while cash-flowing — sheltering income. Rental losses are passive: they offset passive income freely, and up to $25,000/yr can offset ordinary (W-2) income if you actively participate and your MAGI is under $100k (phasing out to $0 by $150k); unused losses carry forward. On sale, claimed depreciation is recaptured at up to 25%, and gains may owe capital-gains tax (a 1031 exchange can defer both). Figures are a year-1 estimate at your 24.0% rate — not tax advice; consult a CPA.
Schools (NCES district)
- District
- Channelview ISD
- NCES district ID
- 4813590
- Math proficiency
- 27% ▼ -22.00%
- Reading proficiency
- 30% ▼ -8.00%
- Median HH income
- $52,320
- Composite
- 25.18/100
- National rank
- #7513
- State rank
- #640 of 826 in TX
Livability — Channelview
- Score
- 66/100
- State rank
- #598
- US rank
- #11392
Category grades
Schools grade is shown separately in the Schools card above.
Census & demographics
- Census place
- Channelview, TX
- County
- Harris County · 4,702,590 people
- City population
- 31,527
- Metro
- Houston-The Woodlands-Sugar Land, TX
- Population (ZIP)
- 31,527
- Household income
- $62,195
- Rent vs Own
- Severe rent burden
- 966.0
Population outlook (Harris County) Hauer SSP2
- Today (2025)
- 5,571,493 people
- By 2030
- 6,089,821 · +9.3%
- By 2040
- 7,142,806 · +28.2%
- By 2050
- 8,185,864 · +46.9%
- By 2075
- 10,574,329 · +89.8%
- By 2100
- 12,109,958 · +117.4%
Race, ethnicity, and origin ACS 2023
- Neighborhood character
- Predominantly Hispanic (71%)
- Race & ethnicity
- Hispanic / Latino 71% Two or more races 31% White 16% Black 9% Asian 4% Native American 1%
- Hispanic origin (detail)
- Mexican 61%
- Common ancestry
- Slovak 1% Lithuanian 1%
- Foreign-born
- 33% · Canada, Vietnam, Jamaica
- Languages at home
- 37% English-only · Spanish 60% Other Asian/Pacific 1% Vietnamese 1%
Political lean MEDSL · Harris
- 2024 margin
- Lean D (+5.5) · D 52.0% · R 46.4% · Other 1.6%
- 2008→2024 swing
- +3.9pp toward D · 2008: 1.6pp · 2024: 5.5pp
- All cycles
- 2024: D+5.5 2020: D+13.3 2016: D+12.4 2012: D+0.1 2008: D+1.6
Not yet ingested
- Civics
- —
Market trends
- HPI YoY
- ▼ -172.05%
- Current HPI
- 292.1862
- Rent YoY
- ▲ 16.85%
- Metro
- Houston-The Woodlands-Sugar Land, TX
- State GDP YoY
- ▲ 3.95%
- F500 in state
- 110
Industry mix (Fortune 500 HQ in TX)
| Industry | F500 HQs | Revenue |
|---|---|---|
| Energy | 16 | $1,198B |
|
||
| Technology | 5 | $198B |
|
||
| Engineering / Construction | 4 | $72B |
|
||
| Energy Services | 3 | $60B |
|
||
| Utilities | 3 | $41B |
|
||
| Healthcare | 2 | $330B |
|
||
Price history
5 events — show timeline
- 2026-06-08 Sold (Public Records) — Public Records
- 2026-06-08 Sold (MLS) — HARMLS
- 2026-05-05 Pending — HARMLS
- 2026-04-24 Listed $150,000 HARMLS
- 1988-01-02 Sold (Public Records) — Public Records
Property tax history
+7.6%/yrLatest (2025): $3,559 · +0.7% YoY. Source: county tax records.
Cash-flow waterfall
monthlySold comps — $/sqft
last 12 mo · ≤1 miLoading sold comps…