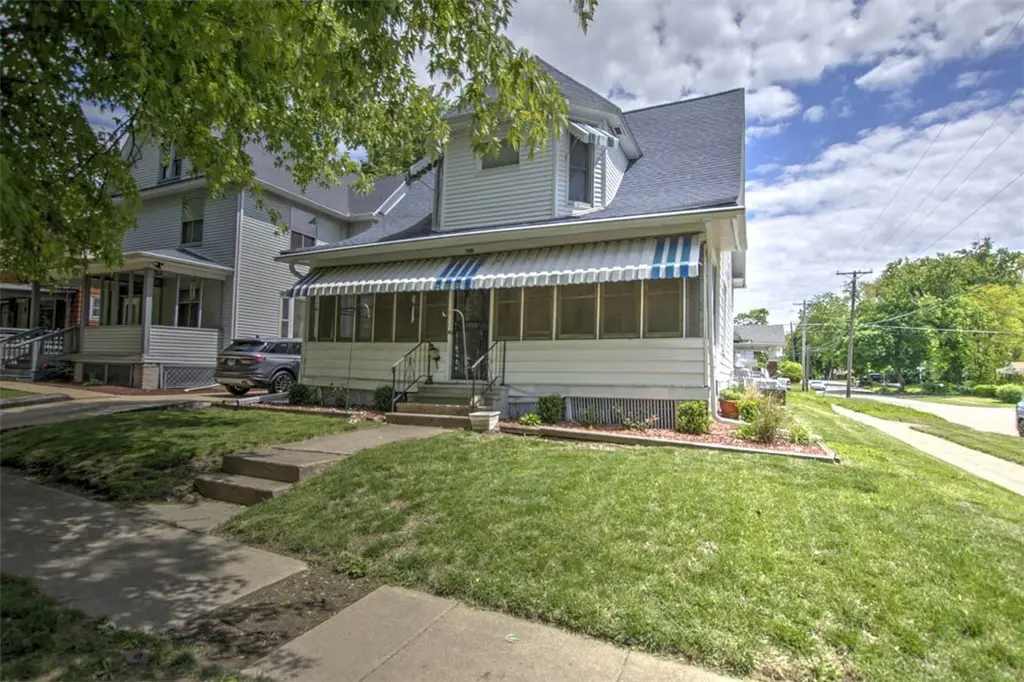
494 Crea St · Decatur, IL
Flood risk 1/10 · Minimal
- FEMA flood zone
- X (unshaded)
- Chance of flooding over 30 yrs
- 0.0%
- Est. flood insurance / yr
- $473 – $860
Fire risk 1/10 · Minimal
- Est. fire insurance / yr
- $804 – $1,492
Heat risk 3/10 · Minor
- Hot days now (above 106°F)
- 7 days/yr
- Hot days in 30 yrs
- 19 days/yr
Wind risk 2/10 · Minimal
- Chance of severe wind over 30 yrs
- 2.0%
Air-quality risk 2/10 · Minimal
- Unhealthy air days now
- 1 days/yr
- Unhealthy air days in 30 yrs
- 1 days/yr
Risk factors via First Street. Map © Google.
Why this score? — see what drove the C grade
The composite is a weighted blend of 9 inputs, each scored 0–100. Each bar is that input's sub-score; the figure is the points it added to the 100-point composite (weight × sub-score).
- Cash flow +30.0/30.0
- 1% rule +10.0/10.0
- DSCR +10.0/10.0
- Livability +3.0/5.0
- Rent growth +2.5/5.0
- Condition / age +2.5/5.0
- Schools +0.4/10.0
- ARV discount +0.0/15.0
- Appreciation +0.0/10.0
$58,500
🖨 Deal sheet (PDF) 📄 Offer letter ✓ Due diligence
Listing remarks
This well-maintained two-story home features 2 bedrooms and 1.5 baths, conveniently located near downtown Decatur. Owned by the same owner since 1992, the property has been thoughtfully cared for over the years with several major updates, including central air installed in 2023, a roof approximately 6 years old, leaf guard gutters, and a furnace less than 10 years old. The home also includes a Generac generator that has been professionally serviced every 3 months for added peace of mind.
Key facts
- Generac generator
- Roof
- Central air
Tags
Property features AI
Exterior
- Parking: Attached garage (1 car)
- Utilities: Public water; Public sewer
- Home design: Single-family residence; Two levels / 2 stories
- Construction: Aluminum siding; Asphalt shingle roof
- Exterior features: Front porch; Concrete road surface
Interior
- Kitchen: Cooktop; Microwave; Oven; Refrigerator; Electric water heater
- Bathrooms: 1 full bathroom; 1 half bathroom
- Heating & cooling: Electric heating; Central air conditioning
- Interior features: Unfinished full basement; 5 total rooms
- Laundry & utility: Washer; Dryer; Main-level laundry
Neighborhood map
What this means for you Summary
Snapshot
- This is a 2-bed/2.0-bath single-family listed at $58k.
Deal economics
- At list price, monthly cash flow is $369 ($4k/yr) — positive.
- The deal already cash-flows at list — no discount required.
- Meets the 1% rule at list price ($930 rent vs $58k).
- Cap rate 13.9% vs local median 7.0% in Decatur — top-decile yield for the area; either an underpriced asset or a hidden risk that comps aren't pricing in. Stress-test before assuming the spread holds.
Location & tenants
- Location reads 59/100 on livability (#1,076 in IL) — a working-class tenant base; expect higher turnover. Strengths: cost of living A+, housing A+; Watch: schools F, crime F, amenities F.
- Decatur SD 61 (urban): math 3% / reading 6% proficiency, ranked #605 of 620 in IL (top 98%) — low school quality limits family demand, transient renter base, plan for 1-2y turnover; 73% free/reduced lunch — lower-income household profile, screen leases tightly.
- Market conditions: 75 active listings in the ZIP; 11 comparable units currently listed for rent nearby; rentals lingering (median 45d on market — plan ~5-8 weeks vacancy on turnover, expect pricing pressure); 91% of comp listings sitting > 30 days — soft ceiling on asking rent; 63 units permitted in Macon County in 2024 (0 in 5+ unit buildings).
Forward outlook
- Local home prices are declining (-3.0%/yr); year-one equity from $404 of loan paydown is wiped out by about $2k of value loss. Plan a longer hold.
- Macon County population projected at -24% by 2050 — secular population decline; favor cash flow + early exit over multi-decade hold.
- At projected returns (-3.0% appreciation + 3.0% rent growth), your $16k cash investment doubles in ~5 years — after that, you're playing with house money.
Negotiation context
- Only 3 days on market — expect competitive offers; lowballing is unlikely to land.
Risks & watch-outs
- Watch-outs: built in 1900 — expect roof / HVAC / electrical / plumbing capex.
Questions for the listing agent
- Built in 1900 — when were the roof, HVAC, electrical panel, plumbing, and water heater last replaced?
- Is there a deadline driving the sale (1031 exchange, divorce, estate, relocation)? That informs how much negotiation room exists.
- Schools are F-rated, which usually means shorter tenancies and higher turnover. Who's the typical renter profile here, and what's been the actual vacancy rate?
- Crime grade is F in this area — have there been break-ins, vandalism, or insurance claims at this property in the last 3 years? What carrier currently insures it and at what premium?
- What's the average days-on-market for RENTAL listings here right now (not sales)? A rising rental-DOM trend means longer vacancies and softer asking-rent achievability than the comps imply.
- What's the recent tenant-quality profile in this submarket — average credit score on applications, eviction rate, late-payment / NSF rate, and stable-employment percentage? A property-management company in the area should have these aggregated.
- How much new for-sale + rental construction is in the pipeline within 1–3 miles? Heavy new supply typically softens prices + rents 12–24 months out; constrained supply supports both.
Investment metrics
- 1% rule
- 1.59% ✓
- Cap rate
- 13.87%
- Cash-on-cash
- 27.05%
- DSCR
- 2.20
- GRM
- 5.2
CMA / ARV
- ARV (on-the-fly)
- $40,768
- Comps found
- 5
Show comp detail 5 sales within ~0.75 mi
| Address | Dist | Beds/Ba | Sqft | Sold | Price | $/sf | Match |
|---|---|---|---|---|---|---|---|
| 705 S Oakland Ct | 0.48mi | 2/2.0 | 780 (-0%) | 10mo | $100 | — | 68 |
| 1087 W Tuttle St | 0.37mi | 3/1.0 (+1) | 768 (-2%) | 3mo | $38,500 | $50 | 68 |
| 1061 W Decatur St | 0.28mi | 3/2.0 (+1) | 828 (+6%) | 9mo | $25,000 | $30 | 65 |
| 1048 Tuttle St | 0.30mi | 2/1.0 | 882 (+12%) | 19mo | $46,000 | $52 | 45 |
| 775 S Sycamore St | 0.54mi | 2/1.0 | 724 (-8%) | 17mo | $197,000 | $272 | 44 |
Match score weights: distance 35% · size 25% · config 20% · recency 20%. Top-matched comps best support the ARV.
Projected returns pro-forma
-3.0% appreciation · 3.0% rent growth · sell at horizon
- IRR
- 21.0%
- Equity multiple
- 1.86×
- Total profit
- $14,028
- Equity at exit
- $8,723
- IRR
- 29.1%
- Equity multiple
- 3.59×
- Total profit
- $42,457
- Equity at exit
- $5,058
Cash invested: $16,380 (down + closing). Projections, not guarantees.
Landlord ↔ Tenant lean methodology
- Overall (STATE)
- 43 Moderately Tenant-Leaning
- State Illinois
- 43 Moderately Tenant-Leaning · D+7
- County
- — inherits STATE
- City
- — inherits STATE
ZIP-level market 62522
- Home prices YoY
- -16.9%
- Active inventory
- 75
- Price-to-rent
- 5.2×
Monthly cashflow live
- Estimated rent
- $930 high interval (Pro) →
- Mortgage (P&I)
- −$307
- Tax from tax record
- −$34 /mo · $408/yr
- Insurance
- −$24
- HOA
- −$0
- Vacancy / Maint / Mgmt
- −$195
- Net cashflow
- $369
Break-even live
Sensitivity live
| Price | -10% $402 | -5% $386 | +0% $369 | +5% $353 | +10% $336 |
|---|---|---|---|---|---|
| Rent | -10% $296 | -5% $333 | +0% $369 | +5% $406 | +10% $443 |
| Rate | -1.0pp $399 | -0.5pp $384 | base $369 | +0.5pp $354 | +1.0pp $339 |
UW: 25.0% down · 7.5% · 30yr · 1.5% tax · 5.0% vac · 8.0% maint · 8.0% mgmt
Financing live
Cash to close
- Down payment
- $14,625
- Closing costs
- $1,755
- Reserves months
- —
- Total cash needed
- —
Loan-product check · same deal, 3 products live
Conventional
25% down · 7.5% · 30yr
- Down + closing
- —
- Monthly P&I
- —
- Monthly cashflow
- —
- DSCR
- —
- Eligible?
- —
Personal DTI + credit; lowest rate.
DSCR
20% down · 8.5% · 30yr
- Down + closing
- —
- Monthly P&I
- —
- Monthly cashflow
- —
- DSCR
- —
- Eligible?
- —
No personal income docs; deal must DSCR.
Hard money
10% down · 12.0% · 12mo
- Down + closing
- —
- Monthly P&I
- —
- Monthly cashflow
- —
- DSCR
- —
- Eligible?
- —
Short-term bridge; refi at stabilization.
Rent comps 11 comps
| Address | Beds | Baths | Sqft | Rent | $/sqft | DOM | Units | Dist |
|---|---|---|---|---|---|---|---|---|
| 1035 S Main St Decatur, IL | 2.0 | 1.0 | 847 | $880 | $1.04 | 14d | 7 | 0.72mi |
| 853 N College St Decatur, IL | 2.0 | 1.0 | 936 | $925 | $0.99 | 44d | 1 | 0.87mi |
| 1045 N Monroe St Decatur, IL | 3.0 | 2.0 | 1094 | $1,000 | $0.91 | 44d | 1 | 1.03mi |
| 759 E Lawrence St Decatur, IL | 3.0 | 1.0 | 1080 | $695 | $0.64 | 44d | 1 | 1.04mi |
| 803 E Whitmer St Decatur, IL | 3.0 | 1.0 | 900 | $935 | $1.04 | 44d | 1 | 1.07mi |
| 1245 N Union St Decatur, IL | 3.0 | 2.0 | 1111 | $995 | $0.90 | 44d | 1 | 1.24mi |
| 1311 N Walnut Grove Ave Decatur, IL | 2.0 | 1.0 | 781 | $1,100 | $1.41 | 44d | 1 | 1.26mi |
| 1345 N Fairview Ave Decatur, IL | 3.0 | 1.0 | 785 | $985 | $1.25 | 44d | 1 | 1.40mi |
| 1237 E Johns Ave Decatur, IL | 2.0 | 1.0 | 1000 | $895 | $0.90 | 44d | 1 | 1.41mi |
| 1245 Sedgwick St Decatur, IL | 2.0 | 1.0 | 1055 | $895 | $0.85 | 44d | 1 | 1.42mi |
| 1304 E Lawrence St Decatur, IL | 2.0 | 1.0 | 850 | $850 | $1.00 | 44d | 1 | 1.43mi |
Listing history 2 events
-
2026-05-14status Pending
-
2026-05-11$58,500 Active
ⓘ Source: listings_history table (triggers on properties + properties_extension) + one-shot
backfill from property_details.listing_events for pre-trigger history.
Tax reassessment forecast IL · Partial reset (capped growth)
- Current annual tax
- $408 · $34/mo
- Projected year-2 tax
- $868 · $72/mo
- Expected delta
- +$460/yr (+$38/mo · 112.6%)
ⓘ Screening estimate from a state-policy table — verify with the county assessor before closing.
Climate risk First Street
- Flood 1/10 Low FEMA zone X (unshaded) · 0% chance over 30 yrs
- Wildfire 1/10 Low
- Heat 3/10 Moderate 7 d/yr ≥106°F today · 19 d/yr by 30 yrs out
- Wind 2/10 Low 2% chance of damaging wind over 30 yrs
- Air quality 2/10 Low 1 unhealthy d/yr today · 1 by 30 yrs out
Nearby sold comps map
Loading sold comps map…
Walkable amenities ~0.75 mi
Loading nearby amenities…
Taxation est. · year 1
- Rental income
- $11,156
- − Mortgage interest
- −$3,277
- − Property taxes
- −$408
- − Insurance
- −$292
- − Repairs & maintenance
- −$892
- − Management
- −$892
- − Depreciation
- −$1,702
- Taxable income
- $3,691
- Est. tax owed @ 24.0%
- −$886
- After-tax cash flow
- $3,545/yr
For passive investors: Depreciation is non-cash, so a rental often shows a tax loss while cash-flowing — sheltering income. Rental losses are passive: they offset passive income freely, and up to $25,000/yr can offset ordinary (W-2) income if you actively participate and your MAGI is under $100k (phasing out to $0 by $150k); unused losses carry forward. On sale, claimed depreciation is recaptured at up to 25%, and gains may owe capital-gains tax (a 1031 exchange can defer both). Figures are a year-1 estimate at your 24.0% rate — not tax advice; consult a CPA.
Schools (NCES district)
- District
- Decatur SD 61
- NCES district ID
- 1711850
- Math proficiency
- 3% ▼ -4.00%
- Reading proficiency
- 6% ▼ -6.00%
- Median HH income
- $38,864
- Composite
- 3.99/100
- National rank
- #10059
- State rank
- #605 of 620 in IL
Livability — Decatur
- Score
- 59/100
- State rank
- #1076
- US rank
- #20533
Category grades
Schools grade is shown separately in the Schools card above.
Census & demographics
- Census place
- Decatur, IL
- County
- Macon County · 78,333 people
- City population
- 78,333
- Metro
- Decatur, IL
- Population (ZIP)
- 15,185
- Household income
- $50,669
- Rent vs Own
- Severe rent burden
- 321.0
Population outlook (Macon County) Hauer SSP2
- Today (2025)
- 99,568 people
- By 2030
- 94,973 · -4.6%
- By 2040
- 85,250 · -14.4%
- By 2050
- 75,920 · -23.8%
- By 2075
- 55,962 · -43.8%
- By 2100
- 36,468 · -63.4%
Race, ethnicity, and origin ACS 2023
- Neighborhood character
- Majority White (62%)
- Race & ethnicity
- White 62% Black 28% Two or more races 7% Hispanic / Latino 2% Asian 1%
- Common ancestry
- Romanian 1% Italian 1% Slovak 1%
- Foreign-born
- 2% · Canada, China, Jamaica
- Languages at home
- 97% English-only · Spanish 2%
Political lean MEDSL · Macon
- 2024 margin
- R (+18.9) · D 39.8% · R 58.7% · Other 1.4%
- 2008→2024 swing
- -20.0pp toward R · 2008: 1.1pp · 2024: -18.9pp
- All cycles
- 2024: R+18.9 2020: R+17.7 2016: R+18.1 2012: R+5.2 2008: D+1.1
Not yet ingested
- Civics
- —
Market trends
- HPI YoY
- ▼ -36.64%
- Current HPI
- 180.7847
- Rent YoY
- —
- Metro
- Decatur, IL
- State GDP YoY
- ▲ 1.59%
- F500 in state
- 60
Industry mix (Fortune 500 HQ in IL)
| Industry | F500 HQs | Revenue |
|---|---|---|
| Insurance | 4 | $201B |
|
||
| Consumer Goods | 4 | $87B |
|
||
| Industrial Machinery | 3 | $64B |
|
||
| Healthcare | 2 | $55B |
|
||
| Retail / Pharmacy | 1 | $148B |
|
||
| Agriculture / Food | 1 | $86B |
|
||
Price history
2 events — show timeline
- 2026-05-14 Pending — CIBR
- 2026-05-11 Listed $58,500 CIBR
Property tax history
+15.1%/yrLatest (2024): $408 · +11.5% YoY. Source: county tax records.
Cash-flow waterfall
monthlySold comps — $/sqft
last 12 mo · ≤1 miLoading sold comps…