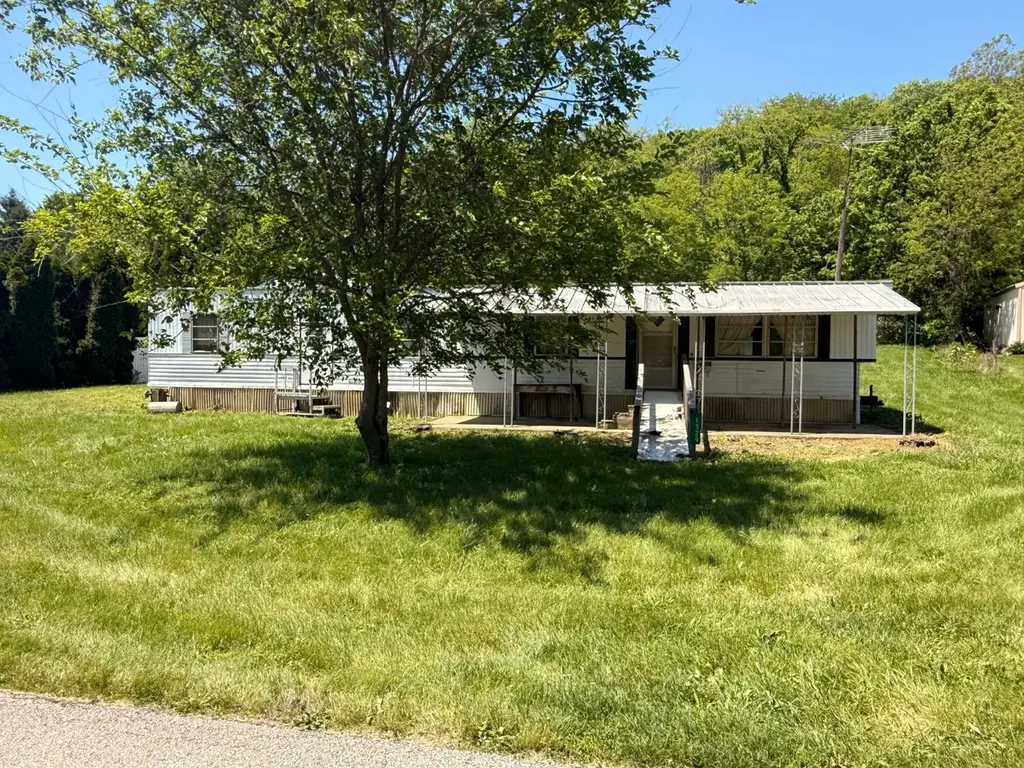
1329 Honecker Ln · Brookville, IN
Flood risk 1/10 · Minimal
- FEMA flood zone
- X (unshaded)
- Chance of flooding over 30 yrs
- 0.0%
- Est. flood insurance / yr
- $507 – $1,088
Fire risk 1/10 · Minimal
- Est. fire insurance / yr
- $717 – $1,331
Heat risk 4/10 · Minor
- Hot days now (above 102°F)
- 7 days/yr
- Hot days in 30 yrs
- 20 days/yr
Wind risk 2/10 · Minimal
- Chance of severe wind over 30 yrs
- 1.0%
Air-quality risk 2/10 · Minimal
- Unhealthy air days now
- 1 days/yr
- Unhealthy air days in 30 yrs
- 2 days/yr
Risk factors via First Street. Map © Google.
Why this score? — see what drove the B- grade
The composite is a weighted blend of 9 inputs, each scored 0–100. Each bar is that input's sub-score; the figure is the points it added to the 100-point composite (weight × sub-score).
- Cash flow +24.9/30.0
- ARV discount +15.0/15.0
- DSCR +8.1/10.0
- 1% rule +6.5/10.0
- Schools +5.0/10.0
- Livability +3.7/5.0
- Rent growth +2.5/5.0
- Condition / age +2.2/5.0
- Appreciation +0.0/10.0
$75,000
🖨 Deal sheet (PDF) 📄 Offer letter ✓ Due diligence
Listing remarks
The standout feature of this property is the impressive garage/pole barn, offering abundant space for vehicles, equipment, storage, workshop needs, or recreational toys. Conveniently located in Brookville, this affordable property combines practical living space with the kind of garage space that's hard to find. Whether you're a hobbyist, collector, contractor, or simply need extra room, you'll appreciate the versatility and potential this property provides. Mobile home is being sold as is.
Key facts
- Workshop space
- Garage pole barn
- Garage space
Tags
Property features AI
Exterior
- Utilities: Public water; Public sewer
- Home design: Single-family residence; One story
- Construction: Aluminum siding
- Exterior features: Shingle roof; Barn(s) on the property; Lot dimensions approximately 103 x 184 (0.44 acre)
Interior
- Bathrooms: 1 full bathroom
- Interior features: Electric water heater; 4 total rooms
Neighborhood map
What this means for you Summary
Snapshot
- This is a 2-bed/1.0-bath single-family listed at $75k. Condition is rated fair.
Deal economics
- At list price, monthly cash flow is $162 ($2k/yr) — positive.
- The deal already cash-flows at list — no discount required.
- Meets the 1% rule at list price ($861 rent vs $75k).
- Recommended offer: $73k (3.0% below list) — sets the bar for market timing.
Location & tenants
- Location reads 73/100 on livability (#92 in IN) — a middle-class / working-renter tenant base. Strengths: crime A+, cost of living A+, housing A; Watch: health & safety C-, amenities F, commute F.
- Zoned schools: Franklin County Middle School (math 29% / reading 37%, grade F, #180 of 330 statewide, top 56%, 358 students, 53% FRL); Franklin County High (math 27% / reading 57%, grade F, #197 of 369 statewide, top 57%, 713 students, 44% FRL).
- Market conditions: 4 active listings in the ZIP; 58 units permitted in Franklin County in 2024 (0 in 5+ unit buildings).
Forward outlook
- Local home prices are declining (-3.0%/yr); year-one equity from $519 of loan paydown is wiped out by about $2k of value loss. Plan a longer hold.
- Franklin County population projected to shrink 10% by 2050 — rents likely to lag national; underwrite the cash flow, not the appreciation.
Negotiation context
- It's been on market 31 days — a 3% lower offer ($73k) is reasonable based on typical stale-listing flexibility.
Questions for the listing agent
- It's been on market 31 days. Have you received any prior offers? Is the seller open to a 3% concession, seller financing, or rate buy-down credit?
- Have any recent inspections been done? Can we get a copy of the seller's disclosures and any deferred-maintenance estimates?
- Built in 1969 — when were the roof, HVAC, electrical panel, plumbing, and water heater last replaced?
- Is there a deadline driving the sale (1031 exchange, divorce, estate, relocation)? That informs how much negotiation room exists.
- Schools are D-rated, which usually means shorter tenancies and higher turnover. Who's the typical renter profile here, and what's been the actual vacancy rate?
- What's the average days-on-market for RENTAL listings here right now (not sales)? A rising rental-DOM trend means longer vacancies and softer asking-rent achievability than the comps imply.
- What's the recent tenant-quality profile in this submarket — average credit score on applications, eviction rate, late-payment / NSF rate, and stable-employment percentage? A property-management company in the area should have these aggregated.
- How much new for-sale + rental construction is in the pipeline within 1–3 miles? Heavy new supply typically softens prices + rents 12–24 months out; constrained supply supports both.
Investment metrics
- 1% rule
- 1.15% ✓
- Cap rate
- 8.88%
- Cash-on-cash
- 9.24%
- DSCR
- 1.41
- GRM
- 7.3
CMA / ARV
- ARV (on-the-fly)
- $144,900
- Comps found
- 2
Show comp detail 2 sales within ~0.75 mi
| Address | Dist | Beds/Ba | Sqft | Sold | Price | $/sf | Match |
|---|---|---|---|---|---|---|---|
| 1341 Fairfield Ave | 0.03mi | 2/1.0 | 876 (+6%) | 1mo | $140,000 | $160 | 88 |
| 511 E 6th St | 0.73mi | 2/1.0 | 742 (-10%) | 11mo | $130,000 | $175 | 39 |
Match score weights: distance 35% · size 25% · config 20% · recency 20%. Top-matched comps best support the ARV.
Projected returns pro-forma
-3.0% appreciation · 3.0% rent growth · sell at horizon
- IRR
- -2.3%
- Equity multiple
- 0.91×
- Total profit
- $-1,840
- Equity at exit
- $11,183
- IRR
- 7.4%
- Equity multiple
- 1.56×
- Total profit
- $11,714
- Equity at exit
- $6,485
Cash invested: $21,000 (down + closing). Projections, not guarantees.
Landlord ↔ Tenant lean methodology
- Overall (STATE)
- 90 Strongly Landlord-Friendly
- State Indiana
- 90 Strongly Landlord-Friendly · R+11
- County
- — inherits STATE
- City
- — inherits STATE
ZIP-level market 47012
- Home prices YoY
- -27.1%
- Active inventory
- 4
- Price-to-rent
- 7.3×
Monthly cashflow live
- Estimated rent
- $861 medium interval (Pro) →
- Mortgage (P&I)
- −$393
- Tax est. 1.5%
- −$94 /mo · $1,125/yr
- Insurance
- −$31
- HOA
- −$0
- Vacancy / Maint / Mgmt
- −$181
- Net cashflow
- $162
Break-even live
Sensitivity live
| Price | -10% $214 | -5% $188 | +0% $162 | +5% $136 | +10% $110 |
|---|---|---|---|---|---|
| Rent | -10% $94 | -5% $128 | +0% $162 | +5% $196 | +10% $230 |
| Rate | -1.0pp $199 | -0.5pp $181 | base $162 | +0.5pp $142 | +1.0pp $123 |
UW: 25.0% down · 7.5% · 30yr · 1.5% tax · 5.0% vac · 8.0% maint · 8.0% mgmt
Financing live
Cash to close
- Down payment
- $18,750
- Closing costs
- $2,250
- Reserves months
- —
- Total cash needed
- —
Loan-product check · same deal, 3 products live
Conventional
25% down · 7.5% · 30yr
- Down + closing
- —
- Monthly P&I
- —
- Monthly cashflow
- —
- DSCR
- —
- Eligible?
- —
Personal DTI + credit; lowest rate.
DSCR
20% down · 8.5% · 30yr
- Down + closing
- —
- Monthly P&I
- —
- Monthly cashflow
- —
- DSCR
- —
- Eligible?
- —
No personal income docs; deal must DSCR.
Hard money
10% down · 12.0% · 12mo
- Down + closing
- —
- Monthly P&I
- —
- Monthly cashflow
- —
- DSCR
- —
- Eligible?
- —
Short-term bridge; refi at stabilization.
Listing history 17 events
-
2026-06-21statusdays on market $75,000 Pending 31 DOM
-
2026-06-18days on market $75,000 Active 30 DOM
-
2026-06-17days on market $75,000 Active 29 DOM
-
2026-06-16days on market $75,000 Active 28 DOM
-
2026-06-15days on market $75,000 Active 27 DOM
-
2026-06-13days on market $75,000 Active 25 DOM
-
2026-06-13remarks 495-char remark
-
2026-06-13days on market $75,000 Active 24 DOM
-
2026-06-09days on market $75,000 Active 21 DOM
-
2026-06-08days on market $75,000 Active 20 DOM
-
2026-06-07days on market $75,000 Active 19 DOM
-
2026-06-04days on market $75,000 Active 16 DOM
-
2026-06-03days on market $75,000 Active 15 DOM
-
2026-06-02days on market $75,000 Active 14 DOM
-
2026-06-01days on market $75,000 Active 13 DOM
-
2026-05-31days on market $75,000 Active 12 DOM
-
2026-05-19$75,000 Active
ⓘ Source: listings_history table (triggers on properties + properties_extension) + one-shot
backfill from property_details.listing_events for pre-trigger history.
Climate risk First Street
- Flood 1/10 Low FEMA zone X (unshaded) · 0% chance over 30 yrs
- Wildfire 1/10 Low
- Heat 4/10 Moderate 7 d/yr ≥102°F today · 20 d/yr by 30 yrs out
- Wind 2/10 Low 100% chance of damaging wind over 30 yrs
- Air quality 2/10 Low 1 unhealthy d/yr today · 2 by 30 yrs out
Nearby sold comps map
Loading sold comps map…
Walkable amenities ~0.75 mi
Loading nearby amenities…
Taxation est. · year 1
- Rental income
- $10,330
- − Mortgage interest
- −$4,201
- − Property taxes
- −$1,125
- − Insurance
- −$375
- − Repairs & maintenance
- −$826
- − Management
- −$826
- − Depreciation
- −$2,182
- Taxable income
- $794
- Est. tax owed @ 24.0%
- −$191
- After-tax cash flow
- $1,750/yr
For passive investors: Depreciation is non-cash, so a rental often shows a tax loss while cash-flowing — sheltering income. Rental losses are passive: they offset passive income freely, and up to $25,000/yr can offset ordinary (W-2) income if you actively participate and your MAGI is under $100k (phasing out to $0 by $150k); unused losses carry forward. On sale, claimed depreciation is recaptured at up to 25%, and gains may owe capital-gains tax (a 1031 exchange can defer both). Figures are a year-1 estimate at your 24.0% rate — not tax advice; consult a CPA.
Condition & rehab AI · 13 photos
This mobile home requires moderate renovations, including kitchen and bathroom updates, flooring replacement, and painting. The property has a good-sized garage and is located in a small town, which could be a positive factor for rental value.
Repairs flagged
- Major Kitchen cabinets — Worn and outdated, likely in need of replacement
- Major Bathroom fixtures — Outdated and possibly in need of replacement
- Major Flooring — Linoleum in poor condition, likely in need of replacement
- Major Paint — Interior walls and exterior siding could benefit from repainting
Value-add opportunities
- Resale Kitchen renovation — Updating the kitchen will significantly improve the home's appeal and value
- Resale Bathroom renovation — Updating the bathroom will improve the home's appeal and value
- Resale Flooring replacement — Replacing the linoleum flooring will improve the home's appearance and value
- Resale Painting — Repainting the interior and exterior will improve the home's appearance and value
- Both Landscaping — Landscaping will improve the home's curb appeal and rental value
Renovation cost estimate screening
| Repair item | Severity | Est. cost |
|---|---|---|
| Kitchen cabinets · Worn and outdated, likely in need of replacement | Major | $15,000–50,000 |
| Bathroom fixtures · Outdated and possibly in need of replacement | Major | $15,000–50,000 |
| Flooring · Linoleum in poor condition, likely in need of replacement | Major | $15,000–50,000 |
| Paint · Interior walls and exterior siding could benefit from repainting | Major | $15,000–50,000 |
| Total estimated repair cost · 4 items | $60,000–200,000 |
Value-add ROI direction
- Resale Kitchen renovation — Updating the kitchen will significantly improve the home's appeal and value ↑
- Resale Bathroom renovation — Updating the bathroom will improve the home's appeal and value ↑
- Resale Flooring replacement — Replacing the linoleum flooring will improve the home's appearance and value ↑
- Resale Painting — Repainting the interior and exterior will improve the home's appearance and value ↑
- Both Landscaping — Landscaping will improve the home's curb appeal and rental value ↑
ⓘ Cost ranges are severity-bucket heuristics (US national rule-of-thumb). Get contractor quotes + a written scope before underwriting a rehab budget.
Schools (NCES district)
No district data.
Livability — Brookville
- Score
- 73/100
- State rank
- #92
- US rank
- #5309
Category grades
Schools grade is shown separately in the Schools card above.
Census & demographics
- Census place
- Brookville, IN
- Population (ZIP)
- 10,891
Population outlook (Franklin County) Hauer SSP2
- Today (2025)
- 22,796 people
- By 2030
- 22,556 · -1.1%
- By 2040
- 21,762 · -4.5%
- By 2050
- 20,575 · -9.7%
- By 2075
- 17,810 · -21.9%
- By 2100
- 13,698 · -39.9%
Race, ethnicity, and origin ACS 2023
- Neighborhood character
- Predominantly White (96%)
- Race & ethnicity
- White 96% Two or more races 2% Hispanic / Latino 2%
- Common ancestry
- Slovak 2% Italian 1% Romanian 1%
- Foreign-born
- 2% · Vietnam, Canada
- Languages at home
- 96% English-only · Korean 2% Vietnamese 1% Russian/Polish/Slavic 1%
Political lean MEDSL · Franklin
- 2024 margin
- Solid R (+64.4) · D 17.1% · R 81.5% · Other 1.3%
- 2008→2024 swing
- -30.3pp toward R · 2008: -34.1pp · 2024: -64.4pp
- All cycles
- 2024: R+64.4 2020: R+63.0 2016: R+60.9 2012: R+42.8 2008: R+34.1
Not yet ingested
- Civics
- —
Market trends
- HPI YoY
- ▼ -82.81%
- Current HPI
- 223.2183
- Rent YoY
- —
- Metro
- —
- State GDP YoY
- ▲ 2.90%
- F500 in state
- 18
Industry mix (Fortune 500 HQ in IN)
| Industry | F500 HQs | Revenue |
|---|---|---|
| Industrial Machinery | 2 | $37B |
|
||
| Healthcare | 1 | $177B |
|
||
| Pharmaceuticals | 1 | $45B |
|
||
| Metals / Steel | 1 | $18B |
|
||
| Agriculture | 1 | $17B |
|
||
| Packaging | 1 | $12B |
|
||
Price history
2 events — show timeline
- 2026-06-19 Pending — SEIBR
- 2026-05-19 Listed $75,000 SEIBR
Cash-flow waterfall
monthlySold comps — $/sqft
last 12 mo · ≤1 miLoading sold comps…