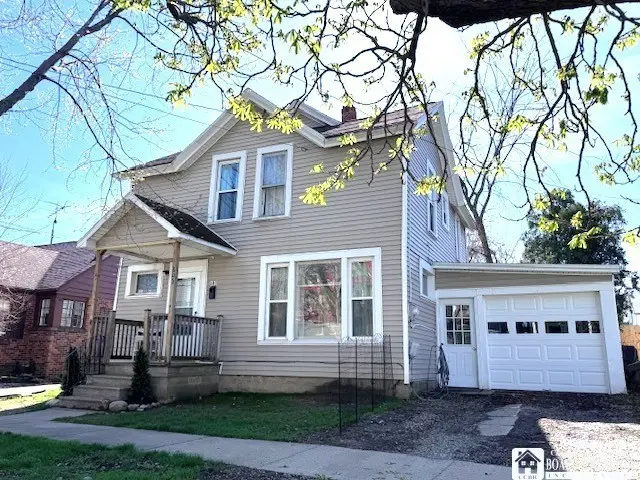
605 Swan St · Dunkirk, NY
Flood risk 1/10 · Minimal
- FEMA flood zone
- X
- Chance of flooding over 30 yrs
- 0.0%
- Est. flood insurance / yr
- $473 – $860
Fire risk 1/10 · Minimal
- Est. fire insurance / yr
- $691 – $1,283
Heat risk 2/10 · Minimal
- Hot days now (above 94°F)
- 7 days/yr
- Hot days in 30 yrs
- 16 days/yr
Wind risk 1/10 · Minimal
- Chance of severe wind over 30 yrs
- —
Air-quality risk 2/10 · Minimal
- Unhealthy air days now
- 2 days/yr
- Unhealthy air days in 30 yrs
- 2 days/yr
Risk factors via First Street. Map © Google.
Why this score? — see what drove the B- grade
The composite is a weighted blend of 9 inputs, each scored 0–100. Each bar is that input's sub-score; the figure is the points it added to the 100-point composite (weight × sub-score).
- Cash flow +20.7/30.0
- ARV discount +15.0/15.0
- Appreciation +7.5/10.0
- DSCR +6.6/10.0
- 1% rule +4.8/10.0
- Livability +3.5/5.0
- Schools +2.7/10.0
- Rent growth +2.5/5.0
- Condition / age +2.5/5.0
$99,900
🖨 Deal sheet 📄 Offer letter ✓ Due diligence
Listing remarks
Welcome to your new home! Tired of paying rent with nothing to show for it? Make this ideally affordable home yours and pay less for a mortgage payment than most pay to rent!! Easy to maintain, this classic colonial 2 story has maintenance free vinyl siding and no backyard to mow for stressfree living! The quiet neighborhood is walking distance to schools, hospital, post office and downtown shops, eateries and businesses! As you enter the front door you will be greeted by gleaming natural woodwork, bright and airy rooms with light reflecting in through the brand new windows, appealing style and design with oh so much character yet many upgrades and renovations. Fresh and clean and ready for
Key facts
- Natural woodwork
- Double living room
- Brand new windows
Tags
Neighborhood map
What this means for you Summary
Snapshot
- This is a 3-bed/1.0-bath single-family listed at $100k.
Deal economics
- At list price, monthly cash flow is $136 ($2k/yr) — positive.
- The deal already cash-flows at list — no discount required.
- To meet the 1% rule (rent ≥ 1% of price), the offer needs to be $98k (1.9% below list).
- Recommended offer: $98k (1.9% below list) — sets the bar for 1% rule.
Location & tenants
- Location reads 70/100 on livability (#426 in NY) — a middle-class / working-renter tenant base. Strengths: cost of living A+, housing A+, health & safety A+; Watch: schools C-, amenities F, commute F.
- Dunkirk City School District (town): math 30% / reading 34% proficiency, ranked #575 of 590 in NY (top 98%) — families likely to look elsewhere, expect single-tenant / working-renter base with shorter leases; 65% free/reduced lunch — lower-income household profile, screen leases tightly.
- Market conditions: 70 active listings in the ZIP; 1 comparable units currently listed for rent nearby; 127 units permitted in Chautauqua County in 2024 (0 in 5+ unit buildings).
Forward outlook
- In year one you build about $6k of equity ($691 loan paydown + $5k appreciation (4.9% local appreciation)).
- Chautauqua County population projected at -22% by 2050 — secular population decline; favor cash flow + early exit over multi-decade hold.
- At projected returns (4.9% appreciation + 3.0% rent growth), your $28k cash investment doubles in ~4 years — after that, you're playing with house money.
- By year 6, paydown + projected appreciation supports a ~$30k cash-out refi (75% LTV) — recoverable capital for the next deal without selling this one.
Negotiation context
- Only 8 days on market — expect competitive offers; lowballing is unlikely to land.
- 3 sale attempts since 23y ago with the ask held roughly flat each time — persistent listings suggest the price (not the market) is what's stuck; bring a comps-based counter.
- Current owner paid $20k; list at $100k implies a 400% gain — meaningful room to come down on a strong offer.
Risks & watch-outs
- Watch-outs: built in 1900 — expect roof / HVAC / electrical / plumbing capex.
Questions for the listing agent
- Built in 1900 — when were the roof, HVAC, electrical panel, plumbing, and water heater last replaced?
- Is there a deadline driving the sale (1031 exchange, divorce, estate, relocation)? That informs how much negotiation room exists.
- What's the average days-on-market for RENTAL listings here right now (not sales)? A rising rental-DOM trend means longer vacancies and softer asking-rent achievability than the comps imply.
- What's the recent tenant-quality profile in this submarket — average credit score on applications, eviction rate, late-payment / NSF rate, and stable-employment percentage? A property-management company in the area should have these aggregated.
- How much new for-sale + rental construction is in the pipeline within 1–3 miles? Heavy new supply typically softens prices + rents 12–24 months out; constrained supply supports both.
Investment metrics
- 1% rule
- 0.98% ✗
- Cap rate
- 7.93%
- Cash-on-cash
- 5.83%
- DSCR
- 1.26
- GRM
- 8.5
CMA / ARV
- ARV (on-the-fly)
- $129,600
- Comps found
- 12
Show comp detail 12 sales within ~0.75 mi
| Address | Dist | Beds/Ba | Sqft | Sold | Price | $/sf | Match |
|---|---|---|---|---|---|---|---|
| 407 Dove St | 0.26mi | 3/1.0 | 1,382 (+2%) | 4mo | $110,000 | $80 | 80 |
| 416 Robin St | 0.26mi | 3/1.0 | 1,436 (+6%) | 9mo | $137,800 | $96 | 70 |
| 740 Deer St | 0.46mi | 3/1.5 | 1,360 (+1%) | 7mo | $162,000 | $119 | 70 |
| 320 Temple St | 0.48mi | 3/1.0 | 1,250 (-7%) | 2mo | $158,894 | $127 | 64 |
| 754 Main St | 0.56mi | 3/1.5 | 1,430 (+6%) | 4mo | $129,900 | $91 | 59 |
| 222 Brigham Rd | 0.57mi | 3/1.0 | 1,287 (-5%) | 10mo | $150,100 | $117 | 58 |
| 69 W 5th St | 0.17mi | 2/1.0 (-1) | 1,546 (+14%) | 7mo | $66,950 | $43 | 56 |
| 629 Deer St | 0.41mi | 4/1.0 (+1) | 1,488 (+10%) | 8mo | $105,000 | $71 | 52 |
| 746 Park Ave | 0.40mi | 3/2.0 | 1,505 (+12%) | 8mo | $99,500 | $66 | 52 |
| 717 Roosevelt Ave | 0.37mi | 4/1.5 (+1) | 1,499 (+11%) | 10mo | $171,000 | $114 | 49 |
| 744 Grant Ave | 0.60mi | 3/1.0 | 1,197 (-11%) | 8mo | $159,000 | $133 | 47 |
| 32 Albany Ave | 0.71mi | 3/1.5 | 1,532 (+14%) | 3mo | $145,000 | $95 | 40 |
Match score weights: distance 35% · size 25% · config 20% · recency 20%. Top-matched comps best support the ARV.
Projected returns pro-forma
4.93% appreciation · 3.0% rent growth · sell at horizon
- IRR
- 17.7%
- Equity multiple
- 2.12×
- Total profit
- $31,269
- Equity at exit
- $56,192
- IRR
- 17.9%
- Equity multiple
- 4.12×
- Total profit
- $87,219
- Equity at exit
- $96,635
Cash invested: $27,972 (down + closing). Projections, not guarantees.
Landlord ↔ Tenant lean methodology
- Overall (STATE)
- 15 Strongly Tenant-Friendly
- State New York
- 15 Strongly Tenant-Friendly · D+10
- County
- — inherits STATE
- City
- — inherits STATE
ZIP-level market 14048
- Home prices YoY
- 1.5%
- Active inventory
- 70
- Price-to-rent
- 8.5×
Monthly cashflow live
- Estimated rent
- $980 medium interval (Pro) →
- Mortgage (P&I)
- −$524
- Tax from tax record
- −$73 /mo · $873/yr
- Insurance
- −$42
- HOA
- −$0
- Vacancy / Maint / Mgmt
- −$206
- Net cashflow
- $136
Break-even live
UW: 25.0% down · 7.5% · 30yr · 1.5% tax · 5.0% vac · 8.0% maint · 8.0% mgmt
Financing live
Cash to close
- Down payment
- $24,975
- Closing costs
- $2,997
- Reserves months
- —
- Total cash needed
- —
Loan-product check · same deal, 3 products live
Conventional
25% down · 7.5% · 30yr
- Down + closing
- —
- Monthly P&I
- —
- Monthly cashflow
- —
- DSCR
- —
- Eligible?
- —
Personal DTI + credit; lowest rate.
DSCR
20% down · 8.5% · 30yr
- Down + closing
- —
- Monthly P&I
- —
- Monthly cashflow
- —
- DSCR
- —
- Eligible?
- —
No personal income docs; deal must DSCR.
Hard money
10% down · 12.0% · 12mo
- Down + closing
- —
- Monthly P&I
- —
- Monthly cashflow
- —
- DSCR
- —
- Eligible?
- —
Short-term bridge; refi at stabilization.
Rent comps 1 comps
| Address | Beds | Baths | Sqft | Rent | $/sqft | DOM | Units | Dist |
|---|---|---|---|---|---|---|---|---|
| 70 Greco Ln Dunkirk, NY | 2.0 | 1.0 | 1079 | $980 | $0.91 | 43d | 1 | 1.32mi |
Listing history 6 events
-
2026-04-28status Pending
-
2026-04-19$99,900 Active
-
2024-10-31historical
-
2024-10-13$119,000 Active
-
2003-07-18$32,500
-
1995-04-12soldstatus $20,000
ⓘ Source: listings_history table (triggers on properties + properties_extension) + one-shot
backfill from property_details.listing_events for pre-trigger history.
Tax reassessment forecast NY · Partial reset (capped growth)
- Current annual tax
- $873 · $73/mo
- Projected year-2 tax
- $1,281 · $107/mo
- Expected delta
- +$407/yr (+$34/mo · 46.6%)
ⓘ Screening estimate from a state-policy table — verify with the county assessor before closing.
Climate risk First Street
- Flood 1/10 Low FEMA zone X · 0% chance over 30 yrs
- Wildfire 1/10 Low
- Heat 2/10 Low 7 d/yr ≥94°F today · 16 d/yr by 30 yrs out
- Wind 1/10 Low
- Air quality 2/10 Low 2 unhealthy d/yr today · 2 by 30 yrs out
Nearby sold comps map
Loading sold comps map…
Walkable amenities ~0.75 mi
Loading nearby amenities…
Taxation est. · year 1
- Rental income
- $11,760
- − Mortgage interest
- −$5,596
- − Property taxes
- −$873
- − Insurance
- −$500
- − Repairs & maintenance
- −$941
- − Management
- −$941
- − Depreciation
- −$2,906
- Taxable income
- $3
- Est. tax owed @ 24.0%
- −$1
- After-tax cash flow
- $1,630/yr
For passive investors: Depreciation is non-cash, so a rental often shows a tax loss while cash-flowing — sheltering income. Rental losses are passive: they offset passive income freely, and up to $25,000/yr can offset ordinary (W-2) income if you actively participate and your MAGI is under $100k (phasing out to $0 by $150k); unused losses carry forward. On sale, claimed depreciation is recaptured at up to 25%, and gains may owe capital-gains tax (a 1031 exchange can defer both). Figures are a year-1 estimate at your 24.0% rate — not tax advice; consult a CPA.
Schools (NCES district)
- District
- Dunkirk City School District
- NCES district ID
- 3609420
- Math proficiency
- 30% ▼ -11.00%
- Reading proficiency
- 34% ▬ 0.00%
- Median HH income
- $36,345
- Composite
- 26.55/100
- National rank
- #7190
- State rank
- #575 of 590 in NY
Livability — Dunkirk
- Score
- 70/100
- State rank
- #426
- US rank
- #7421
Category grades
Schools grade is shown separately in the Schools card above.
Census & demographics
- Census place
- Dunkirk, NY
- City population
- 14,949
- Population (ZIP)
- 14,949
Population outlook (Chautauqua County) Hauer SSP2
- Today (2025)
- 123,454 people
- By 2030
- 118,509 · -4.0%
- By 2040
- 107,311 · -13.1%
- By 2050
- 96,703 · -21.7%
- By 2075
- 76,757 · -37.8%
- By 2100
- 60,984 · -50.6%
Race, ethnicity, and origin ACS 2023
- Neighborhood character
- Majority White (63%)
- Race & ethnicity
- White 63% Hispanic / Latino 30% Two or more races 12% Black 3%
- Hispanic origin (detail)
- Mexican 2% Puerto Rican 25% Dominican 1%
- Common ancestry
- Romanian 20% Lithuanian 3% Iranian 1%
- Foreign-born
- 3% · Canada
- Languages at home
- 80% English-only · Spanish 18% Other Indo-European 1%
Political lean MEDSL · Chautauqua
- 2024 margin
- Strong R (+22.0) · D 39.0% · R 61.0%
- 2008→2024 swing
- -22.9pp toward R · 2008: 0.9pp · 2024: -22.0pp
- All cycles
- 2024: R+22.0 2020: R+19.8 2016: R+24.6 2012: R+8.2 2008: D+0.9
Not yet ingested
- Civics
- —
Market trends
- HPI YoY
- ▲ 4.93%
- Current HPI
- 325.9188
- Rent YoY
- —
- Metro
- —
- State GDP YoY
- ▲ 2.60%
- F500 in state
- 92
Industry mix (Fortune 500 HQ in NY)
| Industry | F500 HQs | Revenue |
|---|---|---|
| Financial Services | 10 | $950B |
|
||
| Consumer Goods | 9 | $162B |
|
||
| Insurance | 4 | $225B |
|
||
| Telecommunications | 2 | $144B |
|
||
| Pharmaceuticals | 2 | $112B |
|
||
| Media / Entertainment | 2 | $69B |
|
||
Price history
+399.5% since first listed6 events — show timeline
- 2026-04-28 Pending — UNYREIS
- 2026-04-19 Listed $99,900 UNYREIS
- 2024-10-31 Listing Removed — UNYREIS
- 2024-10-13 Listed $119,000 UNYREIS
- 2003-07-18 Listed $32,500 UNYREIS
- 1995-04-12 Sold (Public Records) $20,000 Public Records
Property tax history
-0.6%/yrLatest (2025): $873 · +3.3% YoY. Source: county tax records.
Cash-flow waterfall
monthlySold comps — $/sqft
last 12 mo · ≤1 miLoading sold comps…