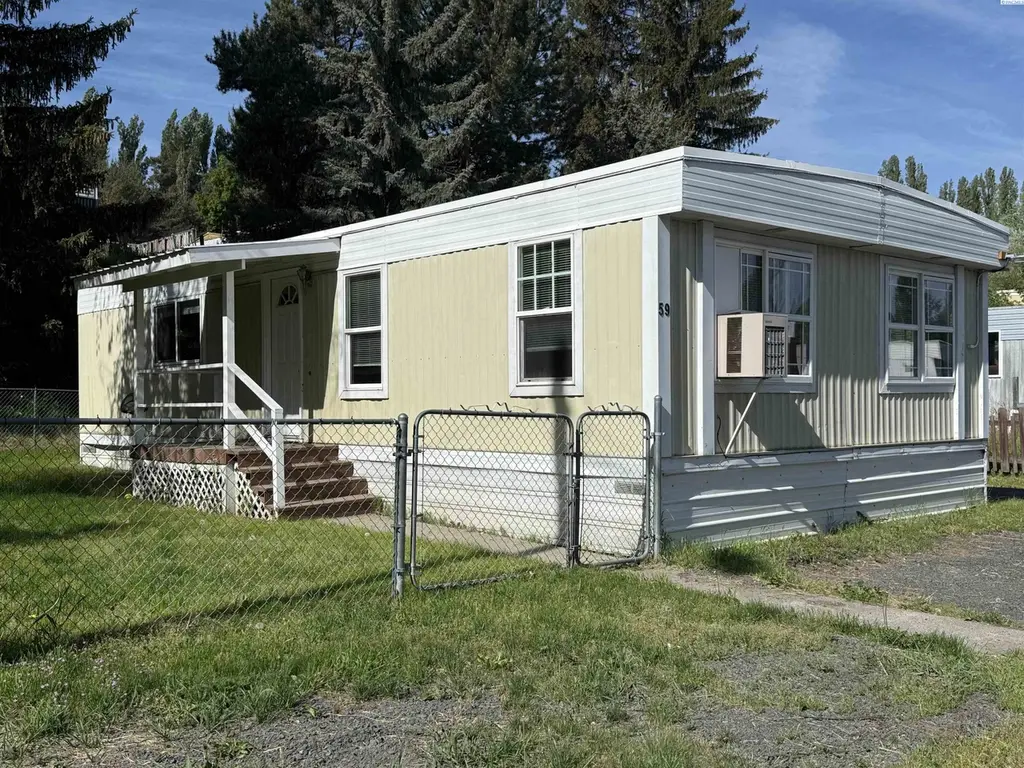
1165 S Grand Ave #59 · Pullman, WA
Flood risk No data
- FEMA flood zone
- —
- Chance of flooding over 30 yrs
- —
- Est. flood insurance / yr
- —
Fire risk No data
- Est. fire insurance / yr
- —
Heat risk No data
- Hot days now (above threshold)
- —
- Hot days in 30 yrs
- —
Wind risk No data
- Chance of severe wind over 30 yrs
- —
Air-quality risk No data
- Unhealthy air days now
- —
- Unhealthy air days in 30 yrs
- —
Risk factors via First Street. Map © Google.
Why this score? — see what drove the B- grade
The composite is a weighted blend of 9 inputs, each scored 0–100. Each bar is that input's sub-score; the figure is the points it added to the 100-point composite (weight × sub-score).
- Cash flow +30.0/30.0
- 1% rule +10.0/10.0
- DSCR +10.0/10.0
- Schools +5.8/10.0
- Livability +4.2/5.0
- Rent growth +3.4/5.0
- Condition / age +2.5/5.0
- ARV discount +0.0/15.0
- Appreciation +0.0/10.0
$49,500
🖨 Deal sheet 📄 Offer letter ✓ Due diligence
Listing remarks MLS
MLS# 292256 This very clean mobile home offers a bright and welcoming living space, perfect for comfortable everyday living. Featuring well-maintained interiors and modern updates, the home boasts spacious rooms, ample natural light, and a move-in ready condition. Enjoy a peaceful setting with a fully fenced yard], shed for storage, and convenient access to local amenities. Surrounded by gorgeous established evergreens on a corner lot with lot rent at $550 (includes water and sewer) this property is a must see! Living room photo shown with virtual staging to show potential for layout.
Key facts
- Built 1970
- Listed 41 days
Neighborhood map
What this means for you Summary
Snapshot
- This is a 3-bed/2.0-bath manufactured listed at $50k.
Deal economics
- At list price, monthly cash flow is $717 ($9k/yr) — positive.
- The deal already cash-flows at list — no discount required.
- Meets the 1% rule at list price ($1k rent vs $50k).
- Recommended offer: $48k (3.0% below list) — sets the bar for market timing.
- Cap rate 23.7% vs local median 2.2% in Pullman — top-decile yield for the area; either an underpriced asset or a hidden risk that comps aren't pricing in. Stress-test before assuming the spread holds.
Location & tenants
- Location reads 85/100 on livability (#32 in WA, #542 nationally) — a professional / high-income tenant draw. Strengths: crime A+, amenities A+, commute A+; Watch: housing C-, employment F.
- Pullman School District (town): math 63% / reading 76% proficiency, ranked #30 of 291 in WA (top 10%) — acceptable for families but not a draw, mixed tenant base, ~2y average lease.
- Market conditions: Rents rising (+3.4%/yr); 192 active listings in the ZIP; 6 comparable units currently listed for rent nearby; rentals lingering (median 44d on market — plan ~5-8 weeks vacancy on turnover, expect pricing pressure); 100% of comp listings sitting > 30 days — soft ceiling on asking rent; 49 units permitted in Whitman County in 2024 (0 in 5+ unit buildings).
- This rent runs 32% of the median local income ($48k/yr) — at the standard rent-burdened threshold; future hikes will face affordability resistance.
Forward outlook
- Local home prices are declining (-3.0%/yr); year-one equity from $342 of loan paydown is wiped out by about $1k of value loss. Plan a longer hold.
- Whitman County population projected at +57% by 2050 — long-run rental-demand tailwind backs the buy-and-hold thesis.
- At projected returns (-3.0% appreciation + 3.4% rent growth), your $14k cash investment doubles in ~2 years — after that, you're playing with house money.
Negotiation context
- It's been on market 41 days — a 3% lower offer ($48k) is reasonable based on typical stale-listing flexibility.
- 2 sale attempts since 3y ago; this cycle's ask has dropped $10k (18%) from the opening price — seller is motivated, your offer sets the floor, not the list.
Questions for the listing agent
- It's been on market 41 days. Have you received any prior offers? Is the seller open to a 3% concession, seller financing, or rate buy-down credit?
- Built in 1970 — when were the roof, HVAC, electrical panel, plumbing, and water heater last replaced?
- Is there a deadline driving the sale (1031 exchange, divorce, estate, relocation)? That informs how much negotiation room exists.
- Schools are A-rated — typically a magnet for longer-tenancy family renters. What's the average tenant stay here, and is there a school-zone premium baked into asking?
- What's the average days-on-market for RENTAL listings here right now (not sales)? A rising rental-DOM trend means longer vacancies and softer asking-rent achievability than the comps imply.
- What's the recent tenant-quality profile in this submarket — average credit score on applications, eviction rate, late-payment / NSF rate, and stable-employment percentage? A property-management company in the area should have these aggregated.
- How much new for-sale + rental construction is in the pipeline within 1–3 miles? Heavy new supply typically softens prices + rents 12–24 months out; constrained supply supports both.
Investment metrics
- 1% rule
- 2.58% ✓
- Cap rate
- 23.69%
- Cash-on-cash
- 62.12%
- DSCR
- 3.76
- GRM
- 3.2
CMA / ARV
- ARV (median comp)
- $42,000
- List price
- $49,500
- Delta
- 17.86%
- Verdict
- OVERPRICED
- Comps
- 6 within 1.0 mi
Show comp detail 5 sales within ~0.75 mi
| Address | Dist | Beds/Ba | Sqft | Sold | Price | $/sf | Match |
|---|---|---|---|---|---|---|---|
| 1165 S Grand Ave #97 Ave #97 | 0.00mi | 3/2.0 | 924 (+5%) | 12mo | $55,000 | $60 | 82 |
| 1165 S Grand Ave #81 Ave #81 | 0.00mi | 2/1.0 (-1) | 940 (+7%) | 4mo | $55,000 | $59 | 76 |
| 1165 S Grand Ave #108 Ave #108 | 0.00mi | 2/1.0 (-1) | 896 (+2%) | 23mo | $32,000 | $36 | 69 |
| 1165 S Grand Ave., #35 Ave #35 | 0.00mi | 3/1.5 | 980 (+11%) | 18mo | $35,000 | $36 | 64 |
| 1165 S Grand Ave #22 | 0.00mi | 3/1.5 | 980 (+11%) | 18mo | $58,000 | $59 | 64 |
Match score weights: distance 35% · size 25% · config 20% · recency 20%. Top-matched comps best support the ARV.
Projected returns pro-forma
-3.0% appreciation · 3.43% rent growth · sell at horizon
- IRR
- 61.5%
- Equity multiple
- 3.76×
- Total profit
- $38,216
- Equity at exit
- $7,381
- IRR
- 66.2%
- Equity multiple
- 7.81×
- Total profit
- $94,365
- Equity at exit
- $4,280
Cash invested: $13,860 (down + closing). Projections, not guarantees.
Landlord ↔ Tenant lean methodology
- Overall (STATE)
- 28 Tenant-Leaning
- State Washington
- 28 Tenant-Leaning · D+8
- County
- — inherits STATE
- City
- — inherits STATE
ZIP-level market 99163
- Rents YoY
- 3.4%
- Active inventory
- 192
- Price-to-rent
- 3.2×
Monthly cashflow live
- Estimated rent
- $1,277 high interval (Pro) →
- Mortgage (P&I)
- −$260
- Tax from tax record
- −$11 /mo · $133/yr
- Insurance
- −$21
- HOA
- −$0
- Vacancy / Maint / Mgmt
- −$268
- Net cashflow
- $717
Break-even live
UW: 25.0% down · 7.5% · 30yr · 1.5% tax · 5.0% vac · 8.0% maint · 8.0% mgmt
Financing live
Cash to close
- Down payment
- $12,375
- Closing costs
- $1,485
- Reserves months
- —
- Total cash needed
- —
Loan-product check · same deal, 3 products live
Conventional
25% down · 7.5% · 30yr
- Down + closing
- —
- Monthly P&I
- —
- Monthly cashflow
- —
- DSCR
- —
- Eligible?
- —
Personal DTI + credit; lowest rate.
DSCR
20% down · 8.5% · 30yr
- Down + closing
- —
- Monthly P&I
- —
- Monthly cashflow
- —
- DSCR
- —
- Eligible?
- —
No personal income docs; deal must DSCR.
Hard money
10% down · 12.0% · 12mo
- Down + closing
- —
- Monthly P&I
- —
- Monthly cashflow
- —
- DSCR
- —
- Eligible?
- —
Short-term bridge; refi at stabilization.
Rent comps 6 comps
| Address | Beds | Baths | Sqft | Rent | $/sqft | DOM | Units | Dist |
|---|---|---|---|---|---|---|---|---|
| 605 S Grand Ave Apt M Pullman, WA | 2.0 | 2.0 | 1000 | $1,350 | $1.35 | 43d | 1 | 0.44mi |
| 455 E Main St Pullman, WA | 2.0–5.0 | 2.0–5.0 | 975 | $669 | $0.69 | 43d | 1 | 0.77mi |
| 1016 SE Latah St Pullman, WA | 2.0 | 1.0 | 735 | $1,050 | $1.43 | 43d | 4 | 0.91mi |
| 620 NE Kamiaken St Pullman, WA | 2.0–3.0 | 1.0–2.0 | 895 | $1,050 | $1.17 | 43d | 12 | 1.14mi |
| 640 SW Golden Hills Dr Pullman, WA | 1.0–3.0 | 1.0–2.0 | 1002 | $2,124 | $2.12 | 43d | 1 | 1.19mi |
| 820 NE Colorado St Pullman, WA | 1.0–8.0 | 1.0–3.0 | 723 | $556 | $0.77 | 43d | 62 | 1.26mi |
Listing history 10 events
-
2026-06-01status $49,500 Pending 41 DOM
-
2026-05-31days on market $49,500 Active 41 DOM
-
2026-05-30days on market $49,500 Active 40 DOM
-
2026-05-12price $55,000 591-char remark
Show marketing remark (591 chars)
MLS# 292256 This very clean mobile home offers a bright and welcoming living space, perfect for comfortable everyday living. Featuring well-maintained interiors and modern updates, the home boasts spacious rooms, ample natural light, and a move-in ready condition. Enjoy a peaceful setting with a fully fenced yard], shed for storage, and convenient access to local amenities. Surrounded by gorgeous established evergreens on a corner lot with lot rent at $550 (includes water and sewer) this property is a must see! Living room photo shown with virtual staging to show potential for layout.
-
2026-04-20$60,000 Active 591-char remark
Show marketing remark (591 chars)
MLS# 292256 This very clean mobile home offers a bright and welcoming living space, perfect for comfortable everyday living. Featuring well-maintained interiors and modern updates, the home boasts spacious rooms, ample natural light, and a move-in ready condition. Enjoy a peaceful setting with a fully fenced yard], shed for storage, and convenient access to local amenities. Surrounded by gorgeous established evergreens on a corner lot with lot rent at $550 (includes water and sewer) this property is a must see! Living room photo shown with virtual staging to show potential for layout.
-
2026-01-18price $49,900
-
2025-12-10price $58,000
-
2023-06-27soldstatus $55,000 Closed
-
2023-06-13historical Active Under Contract
-
2023-05-31$55,000 Active
ⓘ Source: listings_history table (triggers on properties + properties_extension) + one-shot
backfill from property_details.listing_events for pre-trigger history.
Tax reassessment forecast WA · Resets to sale price
- Current annual tax
- $133 · $11/mo
- Projected year-2 tax
- $485 · $40/mo
- Expected delta
- +$352/yr (+$29/mo · 264.7%)
ⓘ Screening estimate from a state-policy table — verify with the county assessor before closing.
Nearby sold comps map
Loading sold comps map…
Walkable amenities ~0.75 mi
Loading nearby amenities…
Taxation est. · year 1
- Rental income
- $15,323
- − Mortgage interest
- −$2,773
- − Property taxes
- −$133
- − Insurance
- −$248
- − Repairs & maintenance
- −$1,226
- − Management
- −$1,226
- − Depreciation
- −$1,440
- Taxable income
- $8,278
- Est. tax owed @ 24.0%
- −$1,987
- After-tax cash flow
- $6,623/yr
For passive investors: Depreciation is non-cash, so a rental often shows a tax loss while cash-flowing — sheltering income. Rental losses are passive: they offset passive income freely, and up to $25,000/yr can offset ordinary (W-2) income if you actively participate and your MAGI is under $100k (phasing out to $0 by $150k); unused losses carry forward. On sale, claimed depreciation is recaptured at up to 25%, and gains may owe capital-gains tax (a 1031 exchange can defer both). Figures are a year-1 estimate at your 24.0% rate — not tax advice; consult a CPA.
Schools (NCES district)
- District
- Pullman School District
- NCES district ID
- 5306930
- Math proficiency
- 63% ▼ -1.00%
- Reading proficiency
- 76% ▲ 1.00%
- Median HH income
- $29,034
- Composite
- 58.15/100
- National rank
- #2131
- State rank
- #30 of 291 in WA
Livability — Pullman
- Score
- 85/100
- State rank
- #32
- US rank
- #542
Category grades
Schools grade is shown separately in the Schools card above.
Census & demographics
- Census place
- Pullman, WA
- County
- Whitman County · 34,022 people
- City population
- 34,022
- Metro
- Pullman, WA
- Population (ZIP)
- 34,022
- Household income
- $48,231
- Rent vs Own
- Severe rent burden
- 3453.0
Population outlook (Whitman County) Hauer SSP2
- Today (2025)
- 57,639 people
- By 2030
- 63,440 · +10.1%
- By 2040
- 75,870 · +31.6%
- By 2050
- 90,294 · +56.7%
- By 2075
- 131,756 · +128.6%
- By 2100
- 169,239 · +193.6%
Race, ethnicity, and origin ACS 2023
- Neighborhood character
- Predominantly White (69%)
- Race & ethnicity
- White 69% Two or more races 12% Asian 10% Hispanic / Latino 9% Black 2%
- Hispanic origin (detail)
- Mexican 6%
- Common ancestry
- Italian 5% Portuguese 5% Slovak 3%
- Foreign-born
- 10% · China, Canada, Vietnam
- Languages at home
- 86% English-only · Spanish 4% Chinese 4% Other Indo-European 2%
Political lean MEDSL · Whitman
- 2024 margin
- Lean D (+9.0) · D 52.8% · R 43.8% · Other 3.4%
- 2008→2024 swing
- +3.5pp toward D · 2008: 5.5pp · 2024: 9.0pp
- All cycles
- 2024: D+9.0 2020: D+10.0 2016: D+0.5 2012: R+3.7 2008: D+5.5
Not yet ingested
- Civics
- —
Market trends
- HPI YoY
- ▼ -367.44%
- Current HPI
- 153.4778
- Rent YoY
- ▲ 3.43%
- Metro
- Pullman, WA
- State GDP YoY
- ▲ 4.65%
- F500 in state
- 22
Industry mix (Fortune 500 HQ in WA)
| Industry | F500 HQs | Revenue |
|---|---|---|
| Retail | 2 | $269B |
|
||
| Technology / Retail | 1 | $638B |
|
||
| Technology | 1 | $245B |
|
||
| Telecommunications | 1 | $38B |
|
||
| Food / Beverage | 1 | $36B |
|
||
| Automotive / Trucks | 1 | $34B |
|
||
Price history
+0.0% since first listed7 events — show timeline
- 2026-05-12 Price Changed $55,000 PACMLS
- 2026-04-20 Listed $60,000 PACMLS
- 2026-01-18 Price Changed $49,900 PACMLS
- 2025-12-10 Price Changed $58,000 PACMLS
- 2023-06-27 Sold (MLS) $55,000 PACMLS
- 2023-06-13 Contingent — PACMLS
- 2023-05-31 Listed $55,000 PACMLS
Property tax history
-2.3%/yrLatest (2026): $133 · -5.2% YoY. Source: county tax records.
Cash-flow waterfall
monthlySold comps — $/sqft
last 12 mo · ≤1 miLoading sold comps…