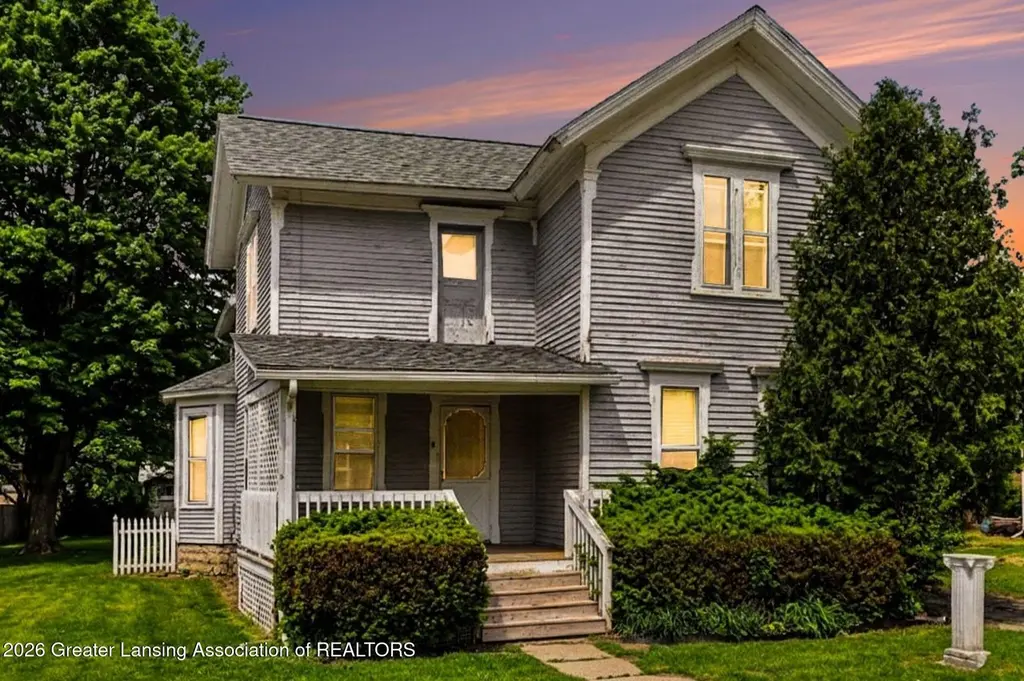
327 E Middle St · Williamston, MI
Flood risk 1/10 · Minimal
- FEMA flood zone
- X (unshaded)
- Chance of flooding over 30 yrs
- 0.0%
- Est. flood insurance / yr
- $507 – $1,088
Fire risk 1/10 · Minimal
- Est. fire insurance / yr
- $784 – $1,456
Heat risk 2/10 · Minimal
- Hot days now (above 97°F)
- 7 days/yr
- Hot days in 30 yrs
- 15 days/yr
Wind risk 2/10 · Minimal
- Chance of severe wind over 30 yrs
- —
Air-quality risk 2/10 · Minimal
- Unhealthy air days now
- 1 days/yr
- Unhealthy air days in 30 yrs
- 2 days/yr
Risk factors via First Street. Map © Google.
Why this score? — see what drove the C+ grade
The composite is a weighted blend of 9 inputs, each scored 0–100. Each bar is that input's sub-score; the figure is the points it added to the 100-point composite (weight × sub-score).
- Cash flow +23.6/30.0
- DSCR +7.6/10.0
- ARV discount +7.5/15.0
- 1% rule +7.2/10.0
- Schools +5.0/10.0
- Livability +4.3/5.0
- Rent growth +2.5/5.0
- Condition / age +2.5/5.0
- Appreciation +0.0/10.0
$174,900
🖨 Deal sheet (PDF) 📄 Offer letter ✓ Due diligence
Key facts
- 0.3 acre lot
- 4 parking spots
- Built 1900
Neighborhood map
What this means for you Summary
Snapshot
- This is a single-family listed at $175k.
Deal economics
- At list price, monthly cash flow is $331 ($4k/yr) — positive.
- The deal already cash-flows at list — no discount required.
- Meets the 1% rule at list price ($2k rent vs $175k).
- Recommended offer: $172k (1.5% below list) — sets the bar for market timing.
Location & tenants
- Location reads 86/100 on livability (#19 in MI, #359 nationally) — a professional / high-income tenant draw. Strengths: crime A+, employment A+, cost of living A+; Watch: amenities D-, health & safety D-.
- Williamston Community Schools (town): math 49% / reading 62% proficiency, ranked #55 of 540 in MI (top 10%) — acceptable for families but not a draw, mixed tenant base, ~2y average lease; only 16% free/reduced lunch — higher-income household profile.
- Market conditions: 60 active listings in the ZIP; 2 comparable units currently listed for rent nearby; 350 units permitted in Ingham County in 2024 (186 in 5+ unit buildings).
Forward outlook
- Local home prices are declining (-3.0%/yr); year-one equity from $1k of loan paydown is wiped out by about $5k of value loss. Plan a longer hold.
- Ingham County population projected at +11% by 2050 — modest demand growth; plan on rents tracking national, not racing it.
Negotiation context
- It's been on market 24 days — a 2% lower offer ($172k) is reasonable based on typical stale-listing flexibility.
Risks & watch-outs
- Watch-outs: property tax is 2.5% of price; built in 1900 — expect roof / HVAC / electrical / plumbing capex.
Questions for the listing agent
- Built in 1900 — when were the roof, HVAC, electrical panel, plumbing, and water heater last replaced?
- Property tax is high relative to price — has the assessment been appealed recently, and will the sale trigger a re-assessment?
- Is there a deadline driving the sale (1031 exchange, divorce, estate, relocation)? That informs how much negotiation room exists.
- Schools are B-rated — typically a magnet for longer-tenancy family renters. What's the average tenant stay here, and is there a school-zone premium baked into asking?
- What's the average days-on-market for RENTAL listings here right now (not sales)? A rising rental-DOM trend means longer vacancies and softer asking-rent achievability than the comps imply.
- What's the recent tenant-quality profile in this submarket — average credit score on applications, eviction rate, late-payment / NSF rate, and stable-employment percentage? A property-management company in the area should have these aggregated.
- How much new for-sale + rental construction is in the pipeline within 1–3 miles? Heavy new supply typically softens prices + rents 12–24 months out; constrained supply supports both.
Investment metrics
- 1% rule
- 1.22% ✓
- Cap rate
- 8.57%
- Cash-on-cash
- 8.12%
- DSCR
- 1.36
- GRM
- 6.8
CMA / ARV
No comps found within radius.
Show comp detail 12 sales within ~0.75 mi
| Address | Dist | Beds/Ba | Sqft | Sold | Price | $/sf | Match |
|---|---|---|---|---|---|---|---|
| 501 High St | 0.13mi | 3/1.0 | 1,073 | 1mo | $180,000 | $168 | 81 |
| 407 S Cedar St | 0.18mi | 3/1.0 | 1,120 | 1mo | $210,000 | $188 | 78 |
| 370 S Cedar St | 0.20mi | 4/2.0 | 1,491 | 1mo | $187,500 | $126 | 78 |
| 529 High St | 0.16mi | 3/2.0 | 1,820 | 7mo | $265,000 | $146 | 74 |
| 824 E Grand Riv | 0.25mi | 3/1.0 | 1,302 | 4mo | $230,000 | $177 | 72 |
| 131 W South St | 0.27mi | 2/1.0 | 1,296 | 6mo | $203,000 | $157 | 70 |
| 880 Holly Ct | 0.32mi | 3/2.0 | 2,642 | 5mo | $600,000 | $227 | 69 |
| 324 E Church St | 0.41mi | 4/2.0 | 1,353 | 1mo | $265,000 | $196 | 68 |
| 425 N Putnam St | 0.40mi | 4/2.0 | 1,768 | 3mo | $309,900 | $175 | 66 |
| 945 Southfield Dr | 0.55mi | 4/2.0 | 1,920 | 2mo | $335,000 | $174 | 60 |
| 868 Southfield Dr | 0.53mi | 3/2.0 | 1,828 | 6mo | $242,000 | $132 | 58 |
| 318 N Circle Dr | 0.66mi | 3/2.0 | 2,152 | 1mo | $407,000 | $189 | 56 |
Match score weights: distance 35% · size 25% · config 20% · recency 20%. Top-matched comps best support the ARV.
Projected returns pro-forma
-3.0% appreciation · 3.0% rent growth · sell at horizon
- IRR
- -3.9%
- Equity multiple
- 0.85×
- Total profit
- $-7,123
- Equity at exit
- $26,078
- IRR
- 5.9%
- Equity multiple
- 1.44×
- Total profit
- $21,460
- Equity at exit
- $15,122
Cash invested: $48,972 (down + closing). Projections, not guarantees.
Landlord ↔ Tenant lean methodology
- Overall (STATE)
- 62 Landlord-Friendly
- State Michigan
- 62 Landlord-Friendly · EVEN
- County
- — inherits STATE
- City
- — inherits STATE
ZIP-level market 48895
- Active inventory
- 60
- Price-to-rent
- 6.8×
Monthly cashflow live
- Estimated rent
- $2,136 medium interval (Pro) →
- Mortgage (P&I)
- −$917
- Tax from tax record
- −$366 /mo · $4,392/yr
- Insurance
- −$73
- HOA
- −$0
- Vacancy / Maint / Mgmt
- −$449
- Net cashflow
- $331
Break-even live
Sensitivity live
| Price | -10% $430 | -5% $381 | +0% $331 | +5% $282 | +10% $232 |
|---|---|---|---|---|---|
| Rent | -10% $162 | -5% $247 | +0% $331 | +5% $416 | +10% $500 |
| Rate | -1.0pp $419 | -0.5pp $376 | base $331 | +0.5pp $286 | +1.0pp $240 |
UW: 25.0% down · 7.5% · 30yr · 1.5% tax · 5.0% vac · 8.0% maint · 8.0% mgmt
Financing live
Cash to close
- Down payment
- $43,725
- Closing costs
- $5,247
- Reserves months
- —
- Total cash needed
- —
Loan-product check · same deal, 3 products live
Conventional
25% down · 7.5% · 30yr
- Down + closing
- —
- Monthly P&I
- —
- Monthly cashflow
- —
- DSCR
- —
- Eligible?
- —
Personal DTI + credit; lowest rate.
DSCR
20% down · 8.5% · 30yr
- Down + closing
- —
- Monthly P&I
- —
- Monthly cashflow
- —
- DSCR
- —
- Eligible?
- —
No personal income docs; deal must DSCR.
Hard money
10% down · 12.0% · 12mo
- Down + closing
- —
- Monthly P&I
- —
- Monthly cashflow
- —
- DSCR
- —
- Eligible?
- —
Short-term bridge; refi at stabilization.
Rent comps 2 comps
| Address | Beds | Baths | Sqft | Rent | $/sqft | DOM | Units | Dist |
|---|---|---|---|---|---|---|---|---|
| 123 E Riverside St Williamston, MI | 3.0 | 2.0 | 1292 | $1,975 | $1.53 | 14d | 1 | 0.37mi |
| 2155 Mitchell Rd Williamston, MI | 3.0 | 2.0 | 1492 | $2,530 | $1.70 | 14d | 1 | 0.91mi |
Listing history 17 events
-
2026-06-18days on market $174,900 Active 24 DOM
-
2026-06-17days on market $174,900 Active 23 DOM
-
2026-06-16days on market $174,900 Active 22 DOM
-
2026-06-15days on market $174,900 Active 21 DOM
-
2026-06-14days on market $174,900 Active 19 DOM
-
2026-06-13days on market $174,900 Active 18 DOM
-
2026-06-10days on market $174,900 Active 16 DOM
-
2026-06-09days on market $174,900 Active 15 DOM
-
2026-06-08days on market $174,900 Active 14 DOM
-
2026-06-07days on market $174,900 Active 13 DOM
-
2026-06-05days on market $174,900 Active 10 DOM
-
2026-06-03days on market $174,900 Active 9 DOM
-
2026-06-02days on market $174,900 Active 8 DOM
-
2026-06-01days on market $174,900 Active 7 DOM
-
2026-05-31days on market $174,900 Active 6 DOM
-
2026-05-30days on market $174,900 Active 5 DOM
-
2026-05-19historical $174,900
ⓘ Source: listings_history table (triggers on properties + properties_extension) + one-shot
backfill from property_details.listing_events for pre-trigger history.
Tax reassessment forecast MI · Partial reset (capped growth)
- Current annual tax
- $4,392 · $366/mo
- Projected year-2 tax
- $4,392 · $366/mo
- Expected delta
- $0/yr ($0/mo · 0.0%)
ⓘ Screening estimate from a state-policy table — verify with the county assessor before closing.
Climate risk First Street
- Flood 1/10 Low FEMA zone X (unshaded) · 0% chance over 30 yrs
- Wildfire 1/10 Low
- Heat 2/10 Low 7 d/yr ≥97°F today · 15 d/yr by 30 yrs out
- Wind 2/10 Low
- Air quality 2/10 Low 1 unhealthy d/yr today · 2 by 30 yrs out
Nearby sold comps map
Loading sold comps map…
Walkable amenities ~0.75 mi
Loading nearby amenities…
Taxation est. · year 1
- Rental income
- $25,630
- − Mortgage interest
- −$9,797
- − Property taxes
- −$4,392
- − Insurance
- −$874
- − Repairs & maintenance
- −$2,050
- − Management
- −$2,050
- − Depreciation
- −$5,088
- Taxable income
- $1,377
- Est. tax owed @ 24.0%
- −$331
- After-tax cash flow
- $3,644/yr
For passive investors: Depreciation is non-cash, so a rental often shows a tax loss while cash-flowing — sheltering income. Rental losses are passive: they offset passive income freely, and up to $25,000/yr can offset ordinary (W-2) income if you actively participate and your MAGI is under $100k (phasing out to $0 by $150k); unused losses carry forward. On sale, claimed depreciation is recaptured at up to 25%, and gains may owe capital-gains tax (a 1031 exchange can defer both). Figures are a year-1 estimate at your 24.0% rate — not tax advice; consult a CPA.
Schools (NCES district)
- District
- Williamston Community Schools
- NCES district ID
- 2636420
- Math proficiency
- 49% ▼ -15.00%
- Reading proficiency
- 62% ▼ -8.00%
- Median HH income
- $79,113
- Composite
- 50.08/100
- National rank
- #1909
- State rank
- #55 of 540 in MI
Livability — Williamston
- Score
- 86/100
- State rank
- #19
- US rank
- #359
Category grades
Schools grade is shown separately in the Schools card above.
Census & demographics
- Census place
- Williamston, MI
- City population
- 11,294
- Population (ZIP)
- 11,294
Population outlook (Ingham County) Hauer SSP2
- Today (2025)
- 300,362 people
- By 2030
- 307,808 · +2.5%
- By 2040
- 320,492 · +6.7%
- By 2050
- 333,223 · +10.9%
- By 2075
- 373,693 · +24.4%
- By 2100
- 392,021 · +30.5%
Race, ethnicity, and origin ACS 2023
- Neighborhood character
- Predominantly White (93%)
- Race & ethnicity
- White 93% Two or more races 3% Hispanic / Latino 3%
- Common ancestry
- Italian 7% Romanian 6% Lithuanian 5%
- Foreign-born
- 1%
- Languages at home
- 97% English-only · Spanish 1% French/Haitian/Cajun 1% German/W. Germanic 1%
Political lean MEDSL · Ingham
- 2024 margin
- Strong D (+29.7) · D 63.9% · R 34.2% · Other 2.0%
- 2008→2024 swing
- -3.6pp toward R · 2008: 33.3pp · 2024: 29.7pp
- All cycles
- 2024: D+29.7 2020: D+32.2 2016: D+27.6 2012: D+27.9 2008: D+33.3
Not yet ingested
- Civics
- —
Market trends
- HPI YoY
- ▼ -175.37%
- Current HPI
- 202.0808
- Rent YoY
- —
- Metro
- —
- State GDP YoY
- ▲ 1.37%
- F500 in state
- 28
Industry mix (Fortune 500 HQ in MI)
| Industry | F500 HQs | Revenue |
|---|---|---|
| Automotive Parts | 3 | $48B |
|
||
| Automotive | 2 | $372B |
|
||
| Chemicals | 1 | $45B |
|
||
| Automotive Retail | 1 | $29B |
|
||
| Healthcare / Medical Devices | 1 | $23B |
|
||
| Automotive Technology | 1 | $20B |
|
||
Price history
1 event — show timeline
- 2026-05-19 Coming Soon $174,900 Greater Lansing AoR
Property tax history
+2.6%/yrLatest (2025): $4,392 · +3.0% YoY. Source: county tax records.
Cash-flow waterfall
monthlySold comps — $/sqft
last 12 mo · ≤1 miLoading sold comps…