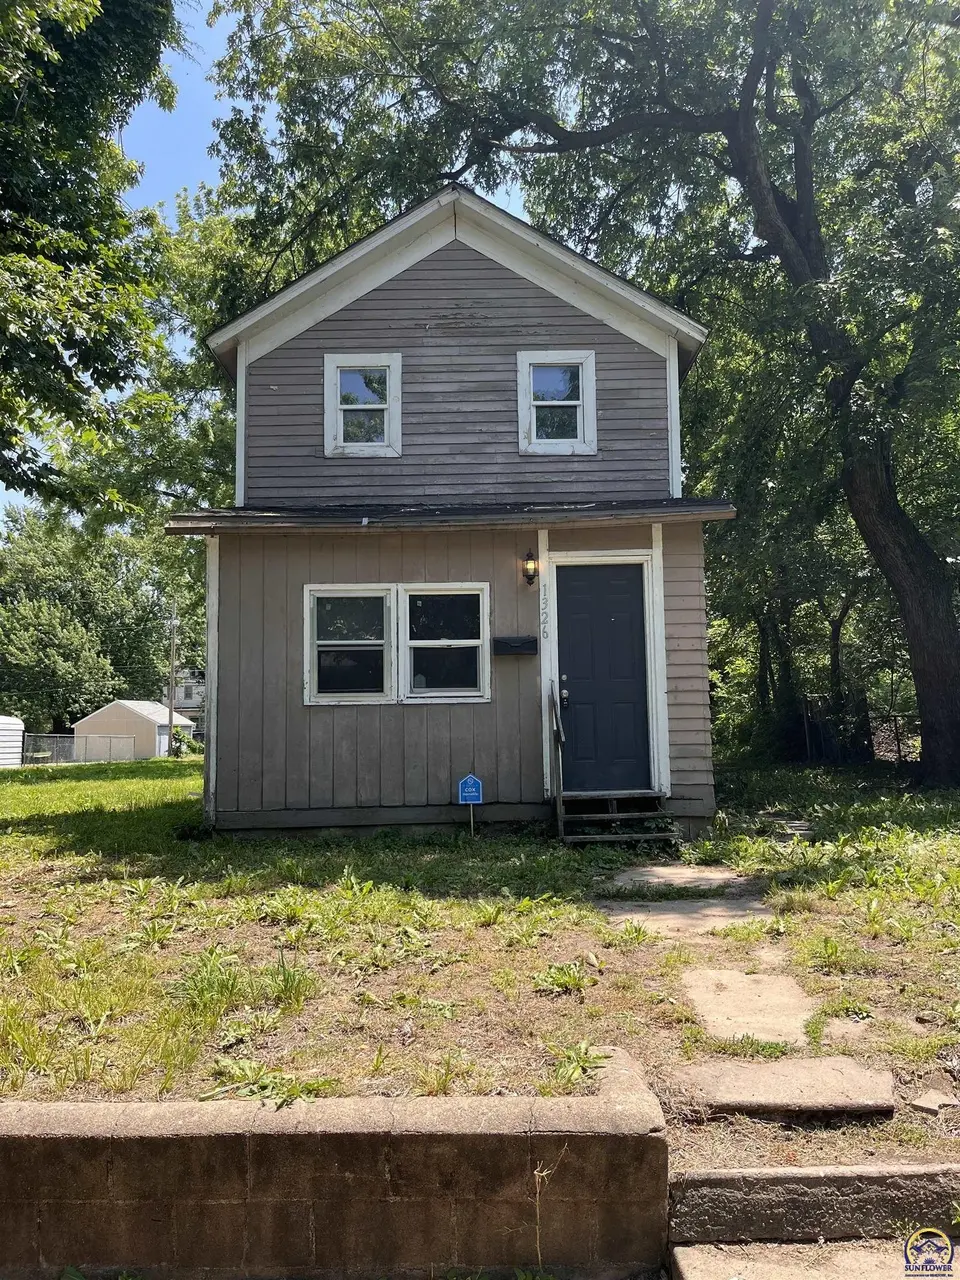
1326 NE Quincy St · Topeka, KS
Flood risk 5/10 · Moderate
- FEMA flood zone
- X
- Chance of flooding over 30 yrs
- 0.27%
- Est. flood insurance / yr
- $473 – $860
Fire risk 3/10 · Minor
- Est. fire insurance / yr
- $1,154 – $2,142
Heat risk 5/10 · Moderate
- Hot days now (above 108°F)
- 7 days/yr
- Hot days in 30 yrs
- 17 days/yr
Wind risk 2/10 · Minimal
- Chance of severe wind over 30 yrs
- —
Air-quality risk 2/10 · Minimal
- Unhealthy air days now
- 1 days/yr
- Unhealthy air days in 30 yrs
- 2 days/yr
Risk factors via First Street. Map © Google.
Why this score? — see what drove the B+ grade
The composite is a weighted blend of 9 inputs, each scored 0–100. Each bar is that input's sub-score; the figure is the points it added to the 100-point composite (weight × sub-score).
- Cash flow +30.0/30.0
- 1% rule +10.0/10.0
- DSCR +10.0/10.0
- ARV discount +7.5/15.0
- Appreciation +7.5/10.0
- Livability +3.5/5.0
- Rent growth +2.5/5.0
- Condition / age +2.5/5.0
- Schools +1.7/10.0
$37,500
🖨 Deal sheet (PDF) 📄 Offer letter ✓ Due diligence
Listing remarks
1326 NE Quincy Street offers a great opportunity just a few blocks from the heart of the vibrant NOTO Arts & Entertainment District! This two-story home features 2 bedrooms, 1 bathroom, and plenty of potential for an investor or buyer looking to add value. Conveniently located near local shops, dining, and entertainment, this property could make an excellent rental, flip opportunity, or affordable home. With repairs and upgrades, this property has the potential to shine again. Don’t miss your chance to invest in an area full of growth and character!
Key facts
- Vibrant noto arts
- Entertainment
- Area full of growth
Tags
Property features AI
Exterior
- Utilities: Public water; Public sewer
- Home design: Single-family residence
- Construction: Above-grade finished area: 1,074 (living space)
- Exterior features: Lot approximately 0.14 acres; Subdivision: Paramores
Interior
- Bathrooms: 1 full bathroom
- Heating & cooling: Central air conditioning
- Interior features: Gas water heater; Partial basement
- Laundry & utility: Laundry on the main level
Neighborhood map
What this means for you Summary
Snapshot
- This is a 2-bed/1.0-bath single-family listed at $38k.
Deal economics
- At list price, monthly cash flow is $543 ($7k/yr) — positive.
- The deal already cash-flows at list — no discount required.
- Meets the 1% rule at list price ($1k rent vs $38k).
- Recommended offer: $36k (3.0% below list) — sets the bar for market timing.
- Cap rate 23.7% vs local median 4.3% in Topeka — top-decile yield for the area; either an underpriced asset or a hidden risk that comps aren't pricing in. Stress-test before assuming the spread holds.
Location & tenants
- Location reads 69/100 on livability (#195 in KS) — a middle-class / working-renter tenant base. Strengths: cost of living A+, housing A+, health & safety A+; Watch: employment C-, crime F, commute F.
- Topeka Public Schools (urban): math 17% / reading 23% proficiency, ranked #158 of 169 in KS (top 94%) — low school quality limits family demand, transient renter base, plan for 1-2y turnover; 69% free/reduced lunch — lower-income household profile, screen leases tightly.
- Zoned schools: Chase Middle School (math 11% / reading 15%, grade F, #188 of 219 statewide, top 87%, 378 students, 93% FRL); Topeka High (math 11% / reading 20%, grade F, #248 of 327 statewide, top 76%, 1,514 students, 72% FRL).
- Market conditions: 32 active listings in the ZIP; 7 comparable units currently listed for rent nearby; rentals at typical pace (median 23d on market — plan ~3-4 weeks tenant-placement turnaround); 219 units permitted in Shawnee County in 2024 (25 in 5+ unit buildings).
Forward outlook
- In year one you build about $2k of equity ($259 loan paydown + $2k appreciation (5.0% local appreciation)).
- Shawnee County population projected to shrink 7% by 2050 — rents likely to lag national; underwrite the cash flow, not the appreciation.
- At projected returns (5.0% appreciation + 3.0% rent growth), your $10k cash investment doubles in ~2 years — after that, you're playing with house money.
Negotiation context
- It's been on market 34 days — a 3% lower offer ($36k) is reasonable based on typical stale-listing flexibility.
- Current owner paid $22k; list at $38k implies a 67% gain — meaningful room to come down on a strong offer.
Risks & watch-outs
- Watch-outs: built in 1920 — expect roof / HVAC / electrical / plumbing capex.
- Climate carrying-cost: moderate flood risk; extreme-heat days projected 7→17/yr by 2055 (HVAC capex compounding) — expect insurance premiums to compound above CPI over the hold.
Questions for the listing agent
- It's been on market 34 days. Have you received any prior offers? Is the seller open to a 3% concession, seller financing, or rate buy-down credit?
- Built in 1920 — when were the roof, HVAC, electrical panel, plumbing, and water heater last replaced?
- Is there a deadline driving the sale (1031 exchange, divorce, estate, relocation)? That informs how much negotiation room exists.
- Schools are D-rated, which usually means shorter tenancies and higher turnover. Who's the typical renter profile here, and what's been the actual vacancy rate?
- Crime grade is F in this area — have there been break-ins, vandalism, or insurance claims at this property in the last 3 years? What carrier currently insures it and at what premium?
- What's the average days-on-market for RENTAL listings here right now (not sales)? A rising rental-DOM trend means longer vacancies and softer asking-rent achievability than the comps imply.
- What's the recent tenant-quality profile in this submarket — average credit score on applications, eviction rate, late-payment / NSF rate, and stable-employment percentage? A property-management company in the area should have these aggregated.
- How much new for-sale + rental construction is in the pipeline within 1–3 miles? Heavy new supply typically softens prices + rents 12–24 months out; constrained supply supports both.
Investment metrics
- 1% rule
- 2.75% ✓
- Cap rate
- 23.66%
- Cash-on-cash
- 62.03%
- DSCR
- 3.76
- GRM
- 3.0
CMA / ARV
No comps found within radius.
Projected returns pro-forma
5.04% appreciation · 3.0% rent growth · sell at horizon
- IRR
- 68.9%
- Equity multiple
- 5.13×
- Total profit
- $43,315
- Equity at exit
- $21,334
- IRR
- 66.8%
- Equity multiple
- 10.63×
- Total profit
- $101,072
- Equity at exit
- $36,889
Cash invested: $10,500 (down + closing). Projections, not guarantees.
Landlord ↔ Tenant lean methodology
- Overall (STATE)
- 83 Strongly Landlord-Friendly
- State Kansas
- 83 Strongly Landlord-Friendly · R+10
- County
- — inherits STATE
- City
- — inherits STATE
ZIP-level market 66608
- Home prices YoY
- 2.3%
- Active inventory
- 32
- Price-to-rent
- 3.0×
Monthly cashflow live
- Estimated rent
- $1,033 high interval (Pro) →
- Mortgage (P&I)
- −$197
- Tax from tax record
- −$61 /mo · $729/yr
- Insurance
- −$16
- HOA
- −$0
- Vacancy / Maint / Mgmt
- −$217
- Net cashflow
- $543
Break-even live
Sensitivity live
| Price | -10% $564 | -5% $553 | +0% $543 | +5% $532 | +10% $522 |
|---|---|---|---|---|---|
| Rent | -10% $461 | -5% $502 | +0% $543 | +5% $584 | +10% $624 |
| Rate | -1.0pp $562 | -0.5pp $552 | base $543 | +0.5pp $533 | +1.0pp $523 |
UW: 25.0% down · 7.5% · 30yr · 1.5% tax · 5.0% vac · 8.0% maint · 8.0% mgmt
Financing live
Cash to close
- Down payment
- $9,375
- Closing costs
- $1,125
- Reserves months
- —
- Total cash needed
- —
Loan-product check · same deal, 3 products live
Conventional
25% down · 7.5% · 30yr
- Down + closing
- —
- Monthly P&I
- —
- Monthly cashflow
- —
- DSCR
- —
- Eligible?
- —
Personal DTI + credit; lowest rate.
DSCR
20% down · 8.5% · 30yr
- Down + closing
- —
- Monthly P&I
- —
- Monthly cashflow
- —
- DSCR
- —
- Eligible?
- —
No personal income docs; deal must DSCR.
Hard money
10% down · 12.0% · 12mo
- Down + closing
- —
- Monthly P&I
- —
- Monthly cashflow
- —
- DSCR
- —
- Eligible?
- —
Short-term bridge; refi at stabilization.
Rent comps 7 comps
| Address | Beds | Baths | Sqft | Rent | $/sqft | DOM | Units | Dist |
|---|---|---|---|---|---|---|---|---|
| 1920 NW Wilcox Ct Unit 1920 Topeka, KS | 3.0 | 2.0 | 1000 | $850 | $0.85 | 22d | 1 | 0.79mi |
| 1700 NW Polk St Topeka, KS | 3.0 | 1.0 | 988 | $1,350 | $1.37 | 22d | 1 | 0.80mi |
| 1104 NW Starlight Cir Topeka, KS | 3.0 | 2.0 | 1024 | $960 | $0.94 | 22d | 1 | 0.90mi |
| 101 N Kansas Ave Topeka, KS | 2.0 | 1.0 | 1009 | $1,325 | $1.31 | 22d | 3 | 1.06mi |
| 1141 NE Chester Ave Topeka, KS | 2.0 | 1.0 | 750 | $850 | $1.13 | 22d | 1 | 1.13mi |
| 502 NE Freeman Ave Topeka, KS | 2.0 | 1.0 | 750 | $875 | $1.17 | 22d | 1 | 1.15mi |
| 1001 NE Atchison Ave Topeka, KS | 2.0 | 1.0 | 689 | $809 | $1.17 | 22d | 19 | 1.17mi |
Listing history 21 events
-
2026-06-21days on market $37,500 Active 34 DOM
-
2026-06-19days on market $37,500 Active 32 DOM
-
2026-06-18price $37,500 Active 31 DOM
-
2026-06-18days on market $42,000 Active 31 DOM
-
2026-06-17days on market $42,000 Active 30 DOM
-
2026-06-16days on market $42,000 Active 29 DOM
-
2026-06-15days on market $42,000 Active 28 DOM
-
2026-06-14days on market $42,000 Active 26 DOM
-
2026-06-13days on market $42,000 Active 25 DOM
-
2026-06-10days on market $42,000 Active 23 DOM
-
2026-06-09days on market $42,000 Active 22 DOM
-
2026-06-08days on market $42,000 Active 21 DOM
-
2026-06-07days on market $42,000 Active 20 DOM
-
2026-06-02days on market $42,000 Active 15 DOM
-
2026-06-01days on market $42,000 Active 14 DOM
-
2026-05-31days on market $42,000 Active 13 DOM
-
2026-05-30days on market $42,000 Active 12 DOM
-
2026-05-18$42,000 Active
-
2026-01-16soldstatus
-
2012-10-01soldstatus
-
1988-02-01soldstatus $22,500
ⓘ Source: listings_history table (triggers on properties + properties_extension) + one-shot
backfill from property_details.listing_events for pre-trigger history.
Tax reassessment forecast KS · Resets to sale price
- Current annual tax
- $729 · $61/mo
- Projected year-2 tax
- $729 · $61/mo
- Expected delta
- $0/yr ($0/mo · 0.0%)
ⓘ Screening estimate from a state-policy table — verify with the county assessor before closing.
Climate risk First Street
- Flood 5/10 Major FEMA zone X · 27% chance over 30 yrs
- Wildfire 3/10 Moderate
- Heat 5/10 Major 7 d/yr ≥108°F today · 17 d/yr by 30 yrs out
- Wind 2/10 Low
- Air quality 2/10 Low 1 unhealthy d/yr today · 2 by 30 yrs out
Nearby sold comps map
Loading sold comps map…
Walkable amenities ~0.75 mi
Loading nearby amenities…
Taxation est. · year 1
- Rental income
- $12,392
- − Mortgage interest
- −$2,101
- − Property taxes
- −$729
- − Insurance
- −$188
- − Repairs & maintenance
- −$991
- − Management
- −$991
- − Depreciation
- −$1,091
- Taxable income
- $6,301
- Est. tax owed @ 24.0%
- −$1,512
- After-tax cash flow
- $5,001/yr
For passive investors: Depreciation is non-cash, so a rental often shows a tax loss while cash-flowing — sheltering income. Rental losses are passive: they offset passive income freely, and up to $25,000/yr can offset ordinary (W-2) income if you actively participate and your MAGI is under $100k (phasing out to $0 by $150k); unused losses carry forward. On sale, claimed depreciation is recaptured at up to 25%, and gains may owe capital-gains tax (a 1031 exchange can defer both). Figures are a year-1 estimate at your 24.0% rate — not tax advice; consult a CPA.
Schools (NCES district)
- District
- Topeka Public Schools
- NCES district ID
- 2012260
- Math proficiency
- 17% ▼ -8.00%
- Reading proficiency
- 23% ▼ -2.00%
- Median HH income
- $37,405
- Composite
- 16.69/100
- National rank
- #9167
- State rank
- #158 of 169 in KS
Livability — Topeka
- Score
- 69/100
- State rank
- #195
- US rank
- #8848
Category grades
Schools grade is shown separately in the Schools card above.
Census & demographics
- Census place
- Topeka, KS
- City population
- 118,130
- Population (ZIP)
- 4,789
Population outlook (Shawnee County) Hauer SSP2
- Today (2025)
- 179,277 people
- By 2030
- 177,762 · -0.8%
- By 2040
- 172,341 · -3.9%
- By 2050
- 166,330 · -7.2%
- By 2075
- 152,417 · -15.0%
- By 2100
- 134,782 · -24.8%
Race, ethnicity, and origin ACS 2023
- Neighborhood character
- Predominantly White (78%)
- Race & ethnicity
- White 78% Black 10% Two or more races 8% Hispanic / Latino 7%
- Hispanic origin (detail)
- Mexican 6%
- Common ancestry
- Lithuanian 2% Romanian 2% Iranian 2%
- Foreign-born
- 1% · Canada, South Korea
- Languages at home
- 95% English-only · Spanish 4% Korean 1%
Political lean MEDSL · Shawnee
- 2024 margin
- Toss-up / Even · D 49.3% · R 48.8% · Other 2.0%
- 2008→2024 swing
- +0.8pp no change · 2008: -0.3pp · 2024: 0.5pp
- All cycles
- 2024: D+0.5 2020: D+3.0 2016: R+2.8 2012: R+1.7 2008: R+0.3
Not yet ingested
- Civics
- —
Market trends
- HPI YoY
- ▲ 5.04%
- Current HPI
- 223.2676
- Rent YoY
- —
- Metro
- —
- State GDP YoY
- —
- F500 in state
- 0
Price history
+86.7% since first listed4 events — show timeline
- 2026-05-18 Listed $42,000 Sunflower MLS as distributed by MLS GRID
- 2026-01-16 Sold (Public Records) — Public Records
- 2012-10-01 Sold (Public Records) — Public Records
- 1988-02-01 Sold (Public Records) $22,500 Public Records
Property tax history
+8.1%/yrLatest (2025): $729 · +4.8% YoY. Source: county tax records.
Cash-flow waterfall
monthlySold comps — $/sqft
last 12 mo · ≤1 miLoading sold comps…