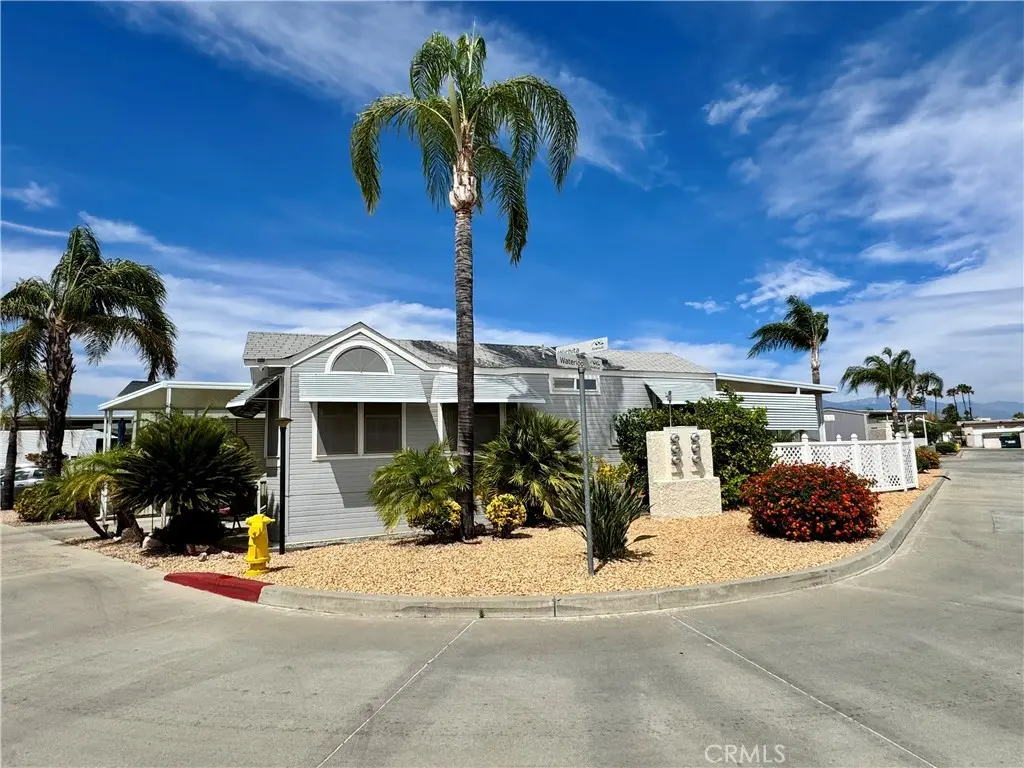
1295 S Cawston Ave · Hemet, CA
Flood risk 5/10 · Moderate
- FEMA flood zone
- X (shaded)
- Chance of flooding over 30 yrs
- 0.57%
- Est. flood insurance / yr
- $507 – $1,088
Fire risk 6/10 · Moderate
- Est. fire insurance / yr
- $659 – $1,223
Heat risk 7/10 · Major
- Hot days now (above 104°F)
- 6 days/yr
- Hot days in 30 yrs
- 17 days/yr
Wind risk 1/10 · Minimal
- Chance of severe wind over 30 yrs
- —
Air-quality risk 6/10 · Moderate
- Unhealthy air days now
- 9 days/yr
- Unhealthy air days in 30 yrs
- 11 days/yr
Risk factors via First Street. Map © Google.
Why this score? — see what drove the B- grade
The composite is a weighted blend of 9 inputs, each scored 0–100. Each bar is that input's sub-score; the figure is the points it added to the 100-point composite (weight × sub-score).
- Cash flow +30.0/30.0
- 1% rule +10.0/10.0
- DSCR +10.0/10.0
- ARV discount +4.0/15.0
- Rent growth +3.4/5.0
- Livability +2.6/5.0
- Schools +2.5/10.0
- Condition / age +2.5/5.0
- Appreciation +0.0/10.0
$57,000
🖨 Deal sheet 📄 Offer letter ✓ Due diligence
Listing remarks
Welcome to Mountain Shadows Community! This approximately 480 sq. ft. furnished single-wide home offers a fantastic opportunity for a seasonal getaway, retirement retreat, or investment property. Featuring 1 bedroom and 1 bathroom, this cozy residence is move-in ready and designed for easy, low-maintenance living. Located in the heart of Hemet, Mountain Shadows offers an array of amenities including a pool, gym, tennis courts, and more. Enjoy convenient access to nearby shopping, dining, fishing, and outdoor recreation, all while being just a short drive to both Temecula Wine Country and Palm Springs. Whether you're looking for an affordable full-time residence, vacation home, or income-pro
Key facts
- Gated community
- Main clubhouse
- Generous shed
Tags
Property features AI
Finance
- Other: Located in the Mountain shadows park; Latitude 33.726258, Longitude -117.018675
- HOA & community: Part of an association (Mountain shadows); Monthly association fee of $292; Association amenities include pool and spa; Senior community; Community features include biking paths and street lighting
Exterior
- Parking: 2 parking spaces; 2-car garage
- Utilities: Public (district) water; Sewer or septic (unknown)
- Home design: Mobile home (model CCH); Mobile dimensions approximately 12 ft by 35 ft; Mobile home remains on site; Single-story; Located in a gated community (Mountain shadows)
- Construction: Year built per assessor; Estimated living area
- Exterior features: Community pool and spa; One shed on the property; Higher density lot (16–20 units/acre)
Interior
- Bathrooms: 1 full bathroom
- Interior features: One-level entry; One story home
- Laundry & utility: Laundry available; Outside laundry area; Stackable washer/dryer (see remarks)
Neighborhood map
What this means for you Summary
Snapshot
- This is a manufactured listed at $57k.
Deal economics
- At list price, monthly cash flow is $1k ($18k/yr) — positive.
- The deal already cash-flows at list — no discount required.
- Meets the 1% rule at list price ($2k rent vs $57k).
- Recommended offer: $55k (3.0% below list) — sets the bar for market timing.
- Cap rate 37.3% vs local median 4.9% in Hemet — top-decile yield for the area; either an underpriced asset or a hidden risk that comps aren't pricing in. Stress-test before assuming the spread holds.
Location & tenants
- Location reads 51/100 on livability (#1,056 in CA) — a working-class tenant base; expect higher turnover. Strengths: housing A+; Watch: crime D+, schools F, amenities F.
- Hemet Unified (suburban): math 19% / reading 41% proficiency, ranked #360 of 517 in CA (top 70%) — families likely to look elsewhere, expect single-tenant / working-renter base with shorter leases; 66% free/reduced lunch — lower-income household profile, screen leases tightly.
- Market conditions: Rents rising (+3.7%/yr); 290 active listings in the ZIP; 11 comparable units currently listed for rent nearby; rentals at typical pace (median 24d on market — plan ~3-4 weeks tenant-placement turnaround); 9,195 units permitted in Riverside County in 2024 (1,512 in 5+ unit buildings).
- This rent runs 44% of the median local income ($64k/yr) — at the standard rent-burdened threshold; future hikes will face affordability resistance.
Forward outlook
- Local home prices are declining (-3.0%/yr); year-one equity from $394 of loan paydown is wiped out by about $2k of value loss. Plan a longer hold.
- Riverside County population projected at +22% by 2050 — long-run rental-demand tailwind backs the buy-and-hold thesis.
- At projected returns (-3.0% appreciation + 3.7% rent growth), your $16k cash investment doubles in ~1 year — after that, you're playing with house money.
Negotiation context
- It's been on market 38 days — a 3% lower offer ($55k) is reasonable based on typical stale-listing flexibility.
- 12 sale attempts since 17y ago; this cycle's ask is 5105% above the opening price — seller raised mid-cycle; expect resistance to lowballs.
- Current owner paid $26k; list at $57k implies a 115% gain — meaningful room to come down on a strong offer.
Risks & watch-outs
- Climate carrying-cost: moderate flood risk; major wildfire risk; extreme-heat days projected 6→17/yr by 2055 (HVAC capex compounding) — expect insurance premiums to compound above CPI over the hold.
Questions for the listing agent
- It's been on market 38 days. Have you received any prior offers? Is the seller open to a 3% concession, seller financing, or rate buy-down credit?
- Is there a deadline driving the sale (1031 exchange, divorce, estate, relocation)? That informs how much negotiation room exists.
- Schools are F-rated, which usually means shorter tenancies and higher turnover. Who's the typical renter profile here, and what's been the actual vacancy rate?
- Crime grade is D in this area — have there been break-ins, vandalism, or insurance claims at this property in the last 3 years? What carrier currently insures it and at what premium?
- What's the average days-on-market for RENTAL listings here right now (not sales)? A rising rental-DOM trend means longer vacancies and softer asking-rent achievability than the comps imply.
- What's the recent tenant-quality profile in this submarket — average credit score on applications, eviction rate, late-payment / NSF rate, and stable-employment percentage? A property-management company in the area should have these aggregated.
- How much new for-sale + rental construction is in the pipeline within 1–3 miles? Heavy new supply typically softens prices + rents 12–24 months out; constrained supply supports both.
Investment metrics
- 1% rule
- 4.09% ✓
- Cap rate
- 37.29%
- Cash-on-cash
- 110.72%
- DSCR
- 5.93
- GRM
- 2.0
CMA / ARV
- ARV (median comp)
- $52,900
- List price
- $57,000
- Delta
- 7.75%
- Verdict
- FAIR
- Comps
- 3 within 1.0 mi
Show comp detail 12 sales within ~0.75 mi
| Address | Dist | Beds/Ba | Sqft | Sold | Price | $/sf | Match |
|---|---|---|---|---|---|---|---|
| 1295 S Cawston Ave #359 | 0.00mi | 1/1.0 | 400 | 0mo | $75,000 | $188 | 87 |
| 1295 S Cawston Ave #490 | 0.00mi | 2/1.0 | 650 | 1mo | $94,500 | $145 | 87 |
| 1295 S Cawston Ave #391 | 0.00mi | 1/1.0 | 750 | 2mo | $147,500 | $197 | 86 |
| 1295 S Cawston Ave #344 | 0.00mi | 1/1.0 | 480 | 5mo | $55,000 | $115 | 84 |
| 1295 S Cawston #102 | 0.05mi | 1/1.0 | 650 | 2mo | $136,000 | $209 | 84 |
| 1295 S Cawston Ave #340 | 0.00mi | 1/1.0 | 600 | 6mo | $120,000 | $200 | 83 |
| 1295 S Cawston #263 | 0.08mi | 1/1.0 | 600 | 2mo | $128,000 | $213 | 82 |
| 1295 S Cawston #246 | 0.08mi | 1/1.0 | — | 3mo | $132,900 | — | 82 |
| 1295 S Cawston Ave #6 | 0.08mi | 1/1.0 | 700 | 3mo | $115,000 | $164 | 82 |
| 1295 S Cawston Ave #249 | 0.06mi | 1/1.0 | 400 | 5mo | $110,000 | $275 | 81 |
| 1295 S Cawston #271 | 0.07mi | 1/1.0 | 400 | 5mo | $115,000 | $288 | 80 |
| 1295 S Cawston #67 | 0.09mi | 2/1.0 | 750 | 4mo | $143,499 | $191 | 80 |
Match score weights: distance 35% · size 25% · config 20% · recency 20%. Top-matched comps best support the ARV.
Projected returns pro-forma
-3.0% appreciation · 3.74% rent growth · sell at horizon
- IRR
- —
- Equity multiple
- 6.41×
- Total profit
- $86,314
- Equity at exit
- $8,499
- IRR
- —
- Equity multiple
- 13.74×
- Total profit
- $203,276
- Equity at exit
- $4,928
Cash invested: $15,960 (down + closing). Projections, not guarantees.
Landlord ↔ Tenant lean methodology
- Overall (STATE)
- 18 Strongly Tenant-Friendly
- State California
- 18 Strongly Tenant-Friendly · D+13
- County
- — inherits STATE
- City
- — inherits STATE
ZIP-level market 92545
- Home prices YoY
- -24.6%
- Rents YoY
- 3.7%
- Active inventory
- 290
- Price-to-rent
- 2.0×
Monthly cashflow live
- Estimated rent
- $2,329 high interval (Pro) →
- Mortgage (P&I)
- −$299
- Tax from tax record
- −$44 /mo · $533/yr
- Insurance
- −$24
- HOA
- −$0
- Vacancy / Maint / Mgmt
- −$489
- Net cashflow
- $1,473
Break-even live
UW: 25.0% down · 7.5% · 30yr · 1.5% tax · 5.0% vac · 8.0% maint · 8.0% mgmt
Financing live
Cash to close
- Down payment
- $14,250
- Closing costs
- $1,710
- Reserves months
- —
- Total cash needed
- —
Loan-product check · same deal, 3 products live
Conventional
25% down · 7.5% · 30yr
- Down + closing
- —
- Monthly P&I
- —
- Monthly cashflow
- —
- DSCR
- —
- Eligible?
- —
Personal DTI + credit; lowest rate.
DSCR
20% down · 8.5% · 30yr
- Down + closing
- —
- Monthly P&I
- —
- Monthly cashflow
- —
- DSCR
- —
- Eligible?
- —
No personal income docs; deal must DSCR.
Hard money
10% down · 12.0% · 12mo
- Down + closing
- —
- Monthly P&I
- —
- Monthly cashflow
- —
- DSCR
- —
- Eligible?
- —
Short-term bridge; refi at stabilization.
Rent comps 11 comps
| Address | Beds | Baths | Sqft | Rent | $/sqft | DOM | Units | Dist |
|---|---|---|---|---|---|---|---|---|
| 5077 Hoss Cir Hemet, CA | 3.0 | 2.0 | 1935 | $3,050 | $1.58 | 19d | 1 | 0.84mi |
| 1429 Camino Sueno Hemet, CA | 3.0 | 3.0 | 2796 | $2,750 | $0.98 | 23d | 1 | 0.87mi |
| 1354 Jasmine Way Hemet, CA | 2.0 | 2.0 | 1440 | $1,650 | $1.15 | 43d | 1 | 0.90mi |
| 2971 Pembroke Ave Hemet, CA | 3.0 | 2.0 | 1572 | $3,000 | $1.91 | 18d | 1 | 0.97mi |
| 2971 Peach Tree St Hemet, CA | 3.0 | 2.0 | 1834 | $2,395 | $1.31 | 43d | 1 | 0.99mi |
| 828 Greenwich Ct Hemet, CA | 3.0 | 3.0 | 1977 | $2,700 | $1.37 | 18d | 1 | 0.99mi |
| 1955 Silver Oak Way Hemet, CA | 3.0 | 2.0 | 1318 | $2,250 | $1.71 | 43d | 1 | 1.30mi |
| 683 Jonquil St Hemet, CA | 3.0 | 2.0 | 1150 | $2,448 | $2.13 | 24d | 1 | 1.36mi |
| 4400 W Florida Ave Spc 26 Hemet, CA | 3.0 | 2.0 | 1193 | $1,699 | $1.42 | 14d | 1 | 1.37mi |
| 4400 W Florida Ave Unit 86 Hemet, CA | 3.0 | 2.0 | 1310 | $1,800 | $1.37 | 43d | 1 | 1.40mi |
| 2277 Oak Ave Hemet, CA | 2.0 | 2.0 | — | $2,095 | — | 2d | 1 | 1.49mi |
Listing history 15 events
-
2026-06-18days on market $57,000 Active 38 DOM
-
2026-06-17days on market $57,000 Active 37 DOM
-
2026-06-16days on market $57,000 Active 36 DOM
-
2026-06-15pricedays on market $57,000 Active 35 DOM
-
2026-06-13days on market $95,900 Active 4 DOM
-
2026-06-10$95,900 Active 1 DOM
-
2026-06-08remarks 699-char remark
-
2026-06-08pricedays on market $95,900 Active 1 DOM
-
2026-06-07days on market $57,000 Active 27 DOM
-
2026-06-04remarks 669-char remark
-
2026-06-04days on market $57,000 Active 24 DOM
-
2026-06-03days on market $57,000 Active 23 DOM
-
2026-06-02days on market $57,000 Active 22 DOM
-
2026-06-01days on market $57,000 Active 21 DOM
-
2026-05-31days on market $57,000 Active 20 DOM
ⓘ Source: listings_history table (triggers on properties + properties_extension) + one-shot
backfill from property_details.listing_events for pre-trigger history.
Tax reassessment forecast CA · Resets to sale price
- Current annual tax
- $533 · $44/mo
- Projected year-2 tax
- $533 · $44/mo
- Expected delta
- $0/yr ($0/mo · 0.0%)
ⓘ Screening estimate from a state-policy table — verify with the county assessor before closing.
Climate risk First Street
- Flood 5/10 Major FEMA zone X (shaded) · 57% chance over 30 yrs
- Wildfire 6/10 Major
- Heat 7/10 Severe 6 d/yr ≥104°F today · 17 d/yr by 30 yrs out
- Wind 1/10 Low
- Air quality 6/10 Major 9 unhealthy d/yr today · 11 by 30 yrs out
Nearby sold comps map
Loading sold comps map…
Walkable amenities ~0.75 mi
Loading nearby amenities…
Taxation est. · year 1
- Rental income
- $27,943
- − Mortgage interest
- −$3,193
- − Property taxes
- −$533
- − Insurance
- −$285
- − Repairs & maintenance
- −$2,235
- − Management
- −$2,235
- − Depreciation
- −$1,658
- Taxable income
- $17,803
- Est. tax owed @ 24.0%
- −$4,273
- After-tax cash flow
- $13,397/yr
For passive investors: Depreciation is non-cash, so a rental often shows a tax loss while cash-flowing — sheltering income. Rental losses are passive: they offset passive income freely, and up to $25,000/yr can offset ordinary (W-2) income if you actively participate and your MAGI is under $100k (phasing out to $0 by $150k); unused losses carry forward. On sale, claimed depreciation is recaptured at up to 25%, and gains may owe capital-gains tax (a 1031 exchange can defer both). Figures are a year-1 estimate at your 24.0% rate — not tax advice; consult a CPA.
Schools (NCES district)
- District
- Hemet Unified
- NCES district ID
- 0616920
- Math proficiency
- 19% ▼ -3.00%
- Reading proficiency
- 41% ▲ 4.00%
- Median HH income
- $39,962
- Composite
- 25.16/100
- National rank
- #7517
- State rank
- #360 of 517 in CA
Livability — Hemet
- Score
- 51/100
- State rank
- #1056
- US rank
- #25208
Category grades
Schools grade is shown separately in the Schools card above.
Census & demographics
- Census place
- Hemet, CA
- County
- Riverside County · 2,287,001 people
- City population
- 137,670
- Metro
- Riverside-San Bernardino-Ontario, CA
- Population (ZIP)
- 45,982
- Household income
- $63,770
- Rent vs Own
- Severe rent burden
- 1813.0
Population outlook (Riverside County) Hauer SSP2
- Today (2025)
- 2,664,475 people
- By 2030
- 2,802,692 · +5.2%
- By 2040
- 3,050,904 · +14.5%
- By 2050
- 3,256,783 · +22.2%
- By 2075
- 3,655,058 · +37.2%
- By 2100
- 3,766,594 · +41.4%
Race, ethnicity, and origin ACS 2023
- Neighborhood character
- Diverse neighborhood (Simpson 0.65)
- Race & ethnicity
- Hispanic / Latino 46% White 35% Two or more races 17% Black 8% Asian 5% Native American 1%
- Hispanic origin (detail)
- Mexican 40%
- Common ancestry
- Slovak 2% Lithuanian 2% Portuguese 1%
- Foreign-born
- 19% · Canada, Vietnam, Jamaica
- Languages at home
- 69% English-only · Spanish 27% Tagalog/Filipino 1% Other Indo-European 1%
Political lean MEDSL · Riverside
- 2024 margin
- Toss-up / Even · D 48.0% · R 49.3% · Other 2.6%
- 2008→2024 swing
- -3.6pp toward R · 2008: 2.3pp · 2024: -1.3pp
- All cycles
- 2024: R+1.3 2020: D+8.0 2016: D+4.3 2012: R+0.4 2008: D+2.3
Not yet ingested
- Civics
- —
Market trends
- HPI YoY
- ▼ -116.25%
- Current HPI
- 356.9414
- Rent YoY
- ▲ 3.74%
- Metro
- Riverside-San Bernardino-Ontario, CA
- State GDP YoY
- ▲ 3.21%
- F500 in state
- 116
Industry mix (Fortune 500 HQ in CA)
| Industry | F500 HQs | Revenue |
|---|---|---|
| Technology | 27 | $1,492B |
|
||
| Financial Services | 3 | $174B |
|
||
| Retail | 3 | $44B |
|
||
| Insurance | 3 | $26B |
|
||
| Media / Entertainment | 2 | $115B |
|
||
| Pharmaceuticals / Biotech | 2 | $62B |
|
||
Price history
-99.1% since first listed46 events — show timeline
- 2025-03-14 Rental Removed $1,095 APPFOLIO
- 2025-03-07 Listed for Rent $1,095 APPFOLIO
- 2025-01-18 Rental Removed $1,250 BUILDIUM
- 2025-01-17 Listed for Rent $1,250 BUILDIUM
- 2025-01-17 Rental Removed $1,250 CRMLS
- 2024-12-24 Listed for Rent $1,250 CRMLS
- 2024-12-24 Rental Removed $1,250 BUILDIUM
- 2024-12-12 Listed for Rent $1,250 BUILDIUM
- 2023-07-13 Rental Removed — APPFOLIO
- 2013-05-13 Listing Removed — CRMLS
- 2013-05-13 Listing Removed — CRMLS
- 2013-03-01 Listing Removed — CRMLS
- 2012-11-13 Listed $23,000 CRMLS
- 2012-11-13 Listed $45,000 CRMLS
- 2012-11-01 Listed $23,900 CRMLS
- 2012-04-11 Sold (MLS) $26,500 CRMLS
- 2012-03-20 Pending — CRMLS
- 2012-01-11 Price Changed $29,900 CRMLS
- 2011-12-16 Price Changed $35,000 CRMLS
- 2011-10-17 Listed $45,000 CRMLS
- 2011-04-21 Sold (MLS) $35,000 CRMLS
- 2011-03-14 Pending — CRMLS
- 2011-03-09 Listed $35,000 CRMLS
- 2010-03-25 Sold (MLS) $16,500 CRMLS
- 2010-02-26 Listed $18,900 CRMLS
- 2010-01-22 Sold (MLS) $16,000 CRMLS
- 2009-12-31 Sold (MLS) $21,000 CRMLS
- 2009-12-18 Pending — CRMLS
- 2009-10-27 Price Changed $18,900 CRMLS
- 2009-08-17 Price Changed $25,000 CRMLS
- 2009-07-20 Listing Removed — CRMLS
- 2009-07-20 Listing Removed — CRMLS
- 2009-07-14 Listing Removed — CRMLS
- 2009-06-25 Price Changed $29,900 CRMLS
- 2009-06-15 Listing Removed — CRMLS
- 2009-04-30 Listing Removed — CRMLS
- 2009-04-30 Listing Removed — CRMLS
- 2009-04-07 Price Changed $19,900 CRMLS
- 2009-02-17 Price Changed $49,000 CRMLS
- 2009-02-14 Listed $74,500 CRMLS
- 2009-02-13 Listing Removed — CRMLS
- 2009-02-13 Listing Removed — CRMLS
- 2009-02-13 Listing Removed — CRMLS
- 2009-02-13 Listing Removed — CRMLS
- 2009-02-11 Listed $119,500 CRMLS
- 2009-02-10 Listing Removed — CRMLS
Property tax history
+8.6%/yrLatest (2014): $533 · +14.2% YoY. Source: county tax records.
Cash-flow waterfall
monthlySold comps — $/sqft
last 12 mo · ≤1 miLoading sold comps…