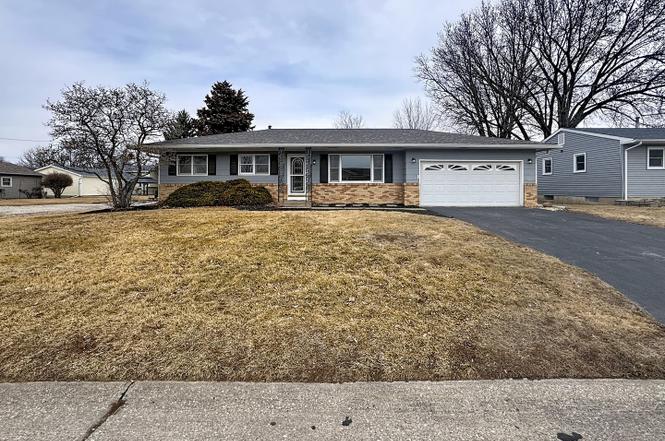
1005 5th Street A · Hampton, IL
Flood risk 1/10 · Minimal
- FEMA flood zone
- X (unshaded)
- Chance of flooding over 30 yrs
- 0.0%
- Est. flood insurance / yr
- $507 – $1,088
Fire risk 1/10 · Minimal
- Est. fire insurance / yr
- $804 – $1,492
Heat risk 3/10 · Minor
- Hot days now (above 103°F)
- 7 days/yr
- Hot days in 30 yrs
- 16 days/yr
Wind risk 2/10 · Minimal
- Chance of severe wind over 30 yrs
- —
Air-quality risk 2/10 · Minimal
- Unhealthy air days now
- 1 days/yr
- Unhealthy air days in 30 yrs
- 2 days/yr
Risk factors via First Street. Map © Google.
Why this score? — see what drove the C+ grade
The composite is a weighted blend of 9 inputs, each scored 0–100. Each bar is that input's sub-score; the figure is the points it added to the 100-point composite (weight × sub-score).
- Cash flow +30.0/30.0
- DSCR +10.0/10.0
- 1% rule +8.8/10.0
- Appreciation +6.3/10.0
- Livability +3.4/5.0
- Rent growth +2.5/5.0
- Condition / age +2.5/5.0
- Schools +1.2/10.0
- ARV discount +0.0/15.0
$239,900
🖨 Deal sheet 📄 Offer letter ✓ Due diligence
Listing remarks
3-bed, 1-bath move-in ready ranch in Hampton-an inviting layout paired with standout storage & a HEATED garage creates a home that delivers both comfort & function. The bright, airy living room leads to a well-equipped kitchen featuring lots of cabinetry and enough space to later add an island with seating! Just off the kitchen is a formal dining room. Down the hall are 3 bedrooms & a full bathroom, all conveniently located on the main level. The basement expands the living space with a huge finished rec room, a large bonus room ideal for future finishing or additional storage, & a dedicated mechanical/laundry room. Outside, the fenced backyard includes two 12x10 shed
Key facts
- Move-in ready
- Finished rec room
- Heated garage
Tags
Property features AI
Exterior
- Parking: Heated attached garage (2 spaces)
- Utilities: Public water; Public sewer; 100 amp electric service
- Home design: Detached single-family home; 1 story; Built 51–60 years ago; Built before 1978; Fee simple ownership
- Construction: Shingle roof; Wood siding; Concrete perimeter foundation
- Exterior features: Other exterior features; Level lot
Interior
- Kitchen: Dishwasher; Microwave; Range; Range hood; Refrigerator
- Bedrooms: 3 bedrooms
- Bathrooms: 1 full bathroom; Master bathroom
- Heating & cooling: Forced air heating (natural gas); Central air conditioning
- Interior features: Separate dining room; Full finished basement with egress window; Sump pump; Gas water heater
- Laundry & utility: Washer; Dryer
Neighborhood map
What this means for you Summary
Snapshot
- This is a 3-bed/1.0-bath single-family listed at $240k.
Deal economics
- At list price, monthly cash flow is $913 ($11k/yr) — positive.
- The deal already cash-flows at list — no discount required.
- Meets the 1% rule at list price ($3k rent vs $240k).
- Recommended offer: $226k (6.0% below list) — sets the bar for market timing.
Location & tenants
- Location reads 67/100 on livability (#508 in IL) — a middle-class / working-renter tenant base. Strengths: crime A+, cost of living A+, housing A+; Watch: amenities F, commute F, health & safety F.
- United Twp Hsd 30 (suburban): math 12% / reading 15% proficiency, ranked #536 of 620 in IL (top 86%) — low school quality limits family demand, transient renter base, plan for 1-2y turnover.
- Market conditions: 16 active listings in the ZIP; 1 comparable units currently listed for rent nearby; 116 units permitted in Rock Island County in 2024 (50 in 5+ unit buildings).
Forward outlook
- In year one you build about $8k of equity ($2k loan paydown + $6k appreciation (2.7% local appreciation)).
- Rock Island County population projected at -12% by 2050 — secular population decline; favor cash flow + early exit over multi-decade hold.
- At projected returns (2.7% appreciation + 3.0% rent growth), your $67k cash investment doubles in ~4 years — after that, you're playing with house money.
- By year 5, paydown + projected appreciation supports a ~$35k cash-out refi (75% LTV) — recoverable capital for the next deal without selling this one.
Negotiation context
- It's been on market 82 days — a 6% lower offer ($226k) is reasonable based on typical stale-listing flexibility.
- 6 sale attempts since 23y ago with the ask held roughly flat each time — persistent listings suggest the price (not the market) is what's stuck; bring a comps-based counter.
- Current owner paid $123k; list at $240k implies a 95% gain — meaningful room to come down on a strong offer.
Questions for the listing agent
- It's been on market 82 days. Have you received any prior offers? Is the seller open to a 6% concession, seller financing, or rate buy-down credit?
- Built in 1968 — when were the roof, HVAC, electrical panel, plumbing, and water heater last replaced?
- Why hasn't it sold? Are there any deal-killer items the seller is aware of (foundation, flood, title, zoning, code violations)?
- Is there a deadline driving the sale (1031 exchange, divorce, estate, relocation)? That informs how much negotiation room exists.
- What's the average days-on-market for RENTAL listings here right now (not sales)? A rising rental-DOM trend means longer vacancies and softer asking-rent achievability than the comps imply.
- What's the recent tenant-quality profile in this submarket — average credit score on applications, eviction rate, late-payment / NSF rate, and stable-employment percentage? A property-management company in the area should have these aggregated.
- How much new for-sale + rental construction is in the pipeline within 1–3 miles? Heavy new supply typically softens prices + rents 12–24 months out; constrained supply supports both.
Investment metrics
- 1% rule
- 1.38% ✓
- Cap rate
- 10.86%
- Cash-on-cash
- 16.31%
- DSCR
- 1.73
- GRM
- 6.1
CMA / ARV
- ARV (on-the-fly)
- $190,080
- Comps found
- 4
Show comp detail 4 sales within ~0.75 mi
| Address | Dist | Beds/Ba | Sqft | Sold | Price | $/sf | Match |
|---|---|---|---|---|---|---|---|
| 1005 5th Street A | 0.00mi | 3/1.0 | 1,320 (0%) | 2mo | $239,900 | $182 | 98 |
| 626 14th Ave | 0.28mi | 3/1.5 | 1,398 (+6%) | 5mo | $155,400 | $111 | 71 |
| 812 1st Ave | 0.67mi | 3/1.0 | 1,240 (-6%) | 16mo | $165,000 | $133 | 45 |
| 914 1st Ave | 0.73mi | 3/1.0 | 1,180 (-11%) | 5mo | $170,000 | $144 | 44 |
Match score weights: distance 35% · size 25% · config 20% · recency 20%. Top-matched comps best support the ARV.
Projected returns pro-forma
2.69% appreciation · 3.0% rent growth · sell at horizon
- IRR
- 22.1%
- Equity multiple
- 2.24×
- Total profit
- $83,145
- Equity at exit
- $103,643
- IRR
- 23.4%
- Equity multiple
- 4.27×
- Total profit
- $219,637
- Equity at exit
- $156,514
Cash invested: $67,172 (down + closing). Projections, not guarantees.
Landlord ↔ Tenant lean methodology
- Overall (STATE)
- 43 Moderately Tenant-Leaning
- State Illinois
- 43 Moderately Tenant-Leaning · D+7
- County
- — inherits STATE
- City
- — inherits STATE
ZIP-level market 61256
- Home prices YoY
- 1.6%
- Active inventory
- 16
- Price-to-rent
- 6.1×
Monthly cashflow live
- Estimated rent
- $3,300 medium interval (Pro) →
- Mortgage (P&I)
- −$1,258
- Tax from tax record
- −$336 /mo · $4,032/yr
- Insurance
- −$100
- HOA
- −$0
- Vacancy / Maint / Mgmt
- −$693
- Net cashflow
- $913
Break-even live
UW: 25.0% down · 7.5% · 30yr · 1.5% tax · 5.0% vac · 8.0% maint · 8.0% mgmt
Financing live
Cash to close
- Down payment
- $59,975
- Closing costs
- $7,197
- Reserves months
- —
- Total cash needed
- —
Loan-product check · same deal, 3 products live
Conventional
25% down · 7.5% · 30yr
- Down + closing
- —
- Monthly P&I
- —
- Monthly cashflow
- —
- DSCR
- —
- Eligible?
- —
Personal DTI + credit; lowest rate.
DSCR
20% down · 8.5% · 30yr
- Down + closing
- —
- Monthly P&I
- —
- Monthly cashflow
- —
- DSCR
- —
- Eligible?
- —
No personal income docs; deal must DSCR.
Hard money
10% down · 12.0% · 12mo
- Down + closing
- —
- Monthly P&I
- —
- Monthly cashflow
- —
- DSCR
- —
- Eligible?
- —
Short-term bridge; refi at stabilization.
Rent comps 1 comps
| Address | Beds | Baths | Sqft | Rent | $/sqft | DOM | Units | Dist |
|---|---|---|---|---|---|---|---|---|
| 821 1st Ave Hampton, IL | 3.0 | 2.5 | 1750 | $3,300 | $1.89 | 13d | 1 | 0.71mi |
Listing history 14 events
-
2026-05-24$239,900 Active
-
2026-05-24$239,900 Active
-
2026-05-22$239,900 Active
-
2026-04-08soldstatus Closed
-
2026-04-08soldstatus Closed
-
2026-04-08soldstatus Closed
-
2026-03-10status Pending
-
2026-03-03historical Contingent - Continue to Show
-
2026-01-15status Active
-
2026-01-14historical
-
2026-01-06historical
-
2025-12-11Active
-
2004-03-25soldstatus $123,000
-
2003-12-01$129,900
ⓘ Source: listings_history table (triggers on properties + properties_extension) + one-shot
backfill from property_details.listing_events for pre-trigger history.
Tax reassessment forecast IL · Partial reset (capped growth)
- Current annual tax
- $4,032 · $336/mo
- Projected year-2 tax
- $4,739 · $395/mo
- Expected delta
- +$707/yr (+$59/mo · 17.5%)
ⓘ Screening estimate from a state-policy table — verify with the county assessor before closing.
Climate risk First Street
- Flood 1/10 Low FEMA zone X (unshaded) · 0% chance over 30 yrs
- Wildfire 1/10 Low
- Heat 3/10 Moderate 7 d/yr ≥103°F today · 16 d/yr by 30 yrs out
- Wind 2/10 Low
- Air quality 2/10 Low 1 unhealthy d/yr today · 2 by 30 yrs out
Nearby sold comps map
Loading sold comps map…
Walkable amenities ~0.75 mi
Loading nearby amenities…
Taxation est. · year 1
- Rental income
- $39,600
- − Mortgage interest
- −$13,438
- − Property taxes
- −$4,032
- − Insurance
- −$1,200
- − Repairs & maintenance
- −$3,168
- − Management
- −$3,168
- − Depreciation
- −$6,979
- Taxable income
- $7,615
- Est. tax owed @ 24.0%
- −$1,828
- After-tax cash flow
- $9,128/yr
For passive investors: Depreciation is non-cash, so a rental often shows a tax loss while cash-flowing — sheltering income. Rental losses are passive: they offset passive income freely, and up to $25,000/yr can offset ordinary (W-2) income if you actively participate and your MAGI is under $100k (phasing out to $0 by $150k); unused losses carry forward. On sale, claimed depreciation is recaptured at up to 25%, and gains may owe capital-gains tax (a 1031 exchange can defer both). Figures are a year-1 estimate at your 24.0% rate — not tax advice; consult a CPA.
Schools (NCES district)
- District
- United Twp Hsd 30
- NCES district ID
- 1739870
- Math proficiency
- 12% ▼ -5.00%
- Reading proficiency
- 15% ▼ -6.00%
- Median HH income
- $43,647
- Composite
- 11.91/100
- National rank
- #9670
- State rank
- #536 of 620 in IL
Livability — Hampton
- Score
- 67/100
- State rank
- #508
- US rank
- #10505
Category grades
Schools grade is shown separately in the Schools card above.
Census & demographics
- Census place
- Hampton, IL
- City population
- 1,946
- Population (ZIP)
- 1,946
Population outlook (Rock Island County) Hauer SSP2
- Today (2025)
- 140,982 people
- By 2030
- 137,705 · -2.3%
- By 2040
- 130,512 · -7.4%
- By 2050
- 123,841 · -12.2%
- By 2075
- 109,851 · -22.1%
- By 2100
- 90,922 · -35.5%
Race, ethnicity, and origin ACS 2023
- Neighborhood character
- Predominantly White (76%)
- Race & ethnicity
- White 76% Hispanic / Latino 16% Two or more races 9% Black 2% Native American 1%
- Hispanic origin (detail)
- Mexican 16%
- Common ancestry
- Slovak 3% English 3% Italian 1%
- Foreign-born
- 2% · Canada
- Languages at home
- 93% English-only · Spanish 6% German/W. Germanic 1%
Political lean MEDSL · Rock Island
- 2024 margin
- Lean D (+9.6) · D 53.9% · R 44.4% · Other 1.7%
- 2008→2024 swing
- -15.0pp toward R · 2008: 24.6pp · 2024: 9.6pp
- All cycles
- 2024: D+9.6 2020: D+12.1 2016: D+8.4 2012: D+21.9 2008: D+24.6
Not yet ingested
- Civics
- —
Market trends
- HPI YoY
- ▲ 2.69%
- Current HPI
- 165.0514
- Rent YoY
- —
- Metro
- —
- State GDP YoY
- ▲ 1.59%
- F500 in state
- 60
Industry mix (Fortune 500 HQ in IL)
| Industry | F500 HQs | Revenue |
|---|---|---|
| Insurance | 4 | $201B |
|
||
| Consumer Goods | 4 | $87B |
|
||
| Industrial Machinery | 3 | $64B |
|
||
| Healthcare | 2 | $55B |
|
||
| Retail / Pharmacy | 1 | $148B |
|
||
| Agriculture / Food | 1 | $86B |
|
||
Price history
+84.7% since first listed14 events — show timeline
- 2026-05-24 Listed $239,900 MRED as Distributed by MLS Grid
- 2026-05-24 Listed $239,900 MRED as Distributed by MLS Grid
- 2026-05-22 Listed $239,900 MRED as Distributed by MLS Grid
- 2026-04-08 Sold (MLS) — MRED as Distributed by MLS Grid
- 2026-04-08 Sold (MLS) — MRED as Distributed by MLS Grid
- 2026-04-08 Sold (MLS) — MRED as Distributed by MLS Grid
- 2026-03-10 Pending — MRED as Distributed by MLS Grid
- 2026-03-03 Contingent — MRED as Distributed by MLS Grid
- 2026-01-15 Relisted — MRED as Distributed by MLS Grid
- 2026-01-14 Listing Removed — MRED as Distributed by MLS Grid
- 2026-01-06 Listing Removed — RMLSA as Distributed by MLS Grid
- 2025-12-11 Listed — RMLSA as Distributed by MLS Grid
- 2004-03-25 Sold (MLS) $123,000 RMLSA as Distributed by MLS Grid
- 2003-12-01 Listed $129,900 RMLSA as Distributed by MLS Grid
Property tax history
+4.2%/yrLatest (2024): $4,032 · +1.5% YoY. Source: county tax records.
Cash-flow waterfall
monthlySold comps — $/sqft
last 12 mo · ≤1 miLoading sold comps…