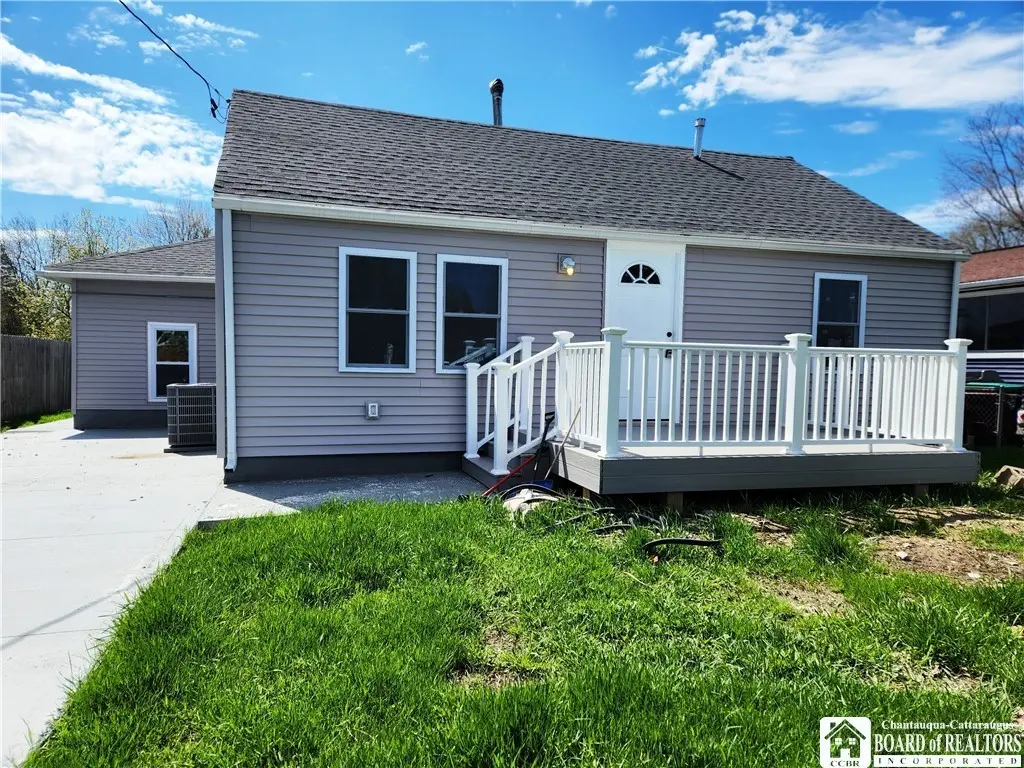
5347 Lake Ave · West Seneca, NY
Flood risk 1/10 · Minimal
- FEMA flood zone
- X (unshaded)
- Chance of flooding over 30 yrs
- 0.0%
- Est. flood insurance / yr
- $473 – $860
Fire risk 3/10 · Minor
- Est. fire insurance / yr
- $691 – $1,283
Heat risk 2/10 · Minimal
- Hot days now (above 93°F)
- 6 days/yr
- Hot days in 30 yrs
- 14 days/yr
Wind risk 1/10 · Minimal
- Chance of severe wind over 30 yrs
- —
Air-quality risk 4/10 · Minor
- Unhealthy air days now
- 3 days/yr
- Unhealthy air days in 30 yrs
- 8 days/yr
Risk factors via First Street. Map © Google.
Why this score? — see what drove the D grade
The composite is a weighted blend of 9 inputs, each scored 0–100. Each bar is that input's sub-score; the figure is the points it added to the 100-point composite (weight × sub-score).
- ARV discount +14.5/15.0
- Cash flow +8.6/30.0
- Schools +5.8/10.0
- Livability +4.0/5.0
- 1% rule +2.8/10.0
- Rent growth +2.5/5.0
- Condition / age +2.5/5.0
- DSCR +2.4/10.0
- Appreciation +0.0/10.0
$249,000
🖨 Deal sheet (PDF) 📄 Offer letter ✓ Due diligence
Listing remarks
There’s nothing to do here but move right in. This 3-bedroom/1-bath ranch has been totally remodeled inside and out. It features new roof, windows, floors, cupboards, countertops, appliances, Navien tankless hot water system, doors, lighting, mechanicals, bathroom, mini-split unit in living room, central air, glass block windows in basement, cement driveway, composite front deck, and deep backyard. There's also a small bonus room that can be used as an office or hobby space. Nothing says “welcome home” like this one.
Key facts
- New floors
- New cupboards
- New appliances
Tags
Property features AI
Exterior
- Parking: No garage
- Utilities: Public water connected; Sewer connected
- Home design: Single-story home; Vinyl siding; Existing construction; Poured foundation
- Construction: Built as existing (year built details listed as existing); Vinyl siding; Poured foundation
- Exterior features: Concrete driveway; Rectangular lot (50 x 104); Road frontage on a main thoroughfare
Interior
- Kitchen: Dishwasher; Gas oven; Gas range; Microwave; Refrigerator
- Bedrooms: 3 main-level bedrooms
- Flooring: Luxury vinyl
- Bathrooms: 1 full bathroom (main level)
- Heating & cooling: Gas forced air heating; Ductless heating; Central air; Ductless cooling
- Interior features: Eat-in kitchen; Home office; Pull-down attic stairs; Bedroom on main level; Full basement
- Laundry & utility: Laundry in basement; Tankless water heater
Neighborhood map
What this means for you Summary
Snapshot
- This is a 3-bed/2.0-bath single-family listed at $249k.
Deal economics
- At list price, monthly cash flow is $-214 ($-3k/yr) — negative.
- To cash-flow at today's rent, offer at most $211k (15.2% below list).
- To meet the 1% rule (rent ≥ 1% of price), the offer needs to be $194k (21.9% below list).
- Recommended offer: $194k (21.9% below list) — sets the bar for 1% rule.
- Cap rate 5.3% vs local median 3.7% in West Seneca — top-decile yield for the area; either an underpriced asset or a hidden risk that comps aren't pricing in. Stress-test before assuming the spread holds.
Location & tenants
- Location reads 79/100 on livability (#130 in NY, #2,089 nationally) — a middle-class / working-renter tenant base. Strengths: housing A+, health & safety A+, crime A-; Watch: amenities D, commute F.
- Orchard Park Central School District (suburban): math 57% / reading 73% proficiency, ranked #158 of 590 in NY (top 27%) — acceptable for families but not a draw, mixed tenant base, ~2y average lease; only 8% free/reduced lunch — higher-income household profile.
- Zoned schools: Windom Elementary School (math 53% / reading 68%, grade B-, #741 of 2,108 statewide, top 35%, 611 students, 29% FRL); Orchard Park Middle School (math 26% / reading 69%, grade C-, #306 of 729 statewide, top 43%, 1,059 students, 15% FRL); Orchard Park High School (math 100% / reading 87%, grade A+, #141 of 1,100 statewide, top 13%, 1,385 students, 16% FRL).
- Market conditions: 144 active listings in the ZIP; 3 comparable units currently listed for rent nearby; rentals leasing fast (median 4d on market — plan ~1-2 weeks tenant-placement turnaround); solid renter incomes; 1,244 units permitted in Erie County in 2024 (563 in 5+ unit buildings).
Forward outlook
- Local home prices are declining (-3.0%/yr); year-one equity from $2k of loan paydown is wiped out by about $7k of value loss. Plan a longer hold.
Negotiation context
- It's been on market 41 days — a 3% lower offer ($242k) is reasonable based on typical stale-listing flexibility.
- 3 sale attempts since 2y ago with the ask held roughly flat each time — persistent listings suggest the price (not the market) is what's stuck; bring a comps-based counter.
Risks & watch-outs
- Watch-outs: built in 1952 — expect roof / HVAC / electrical / plumbing capex.
Questions for the listing agent
- What do current leases actually rent for vs. the listed asking? Can we see a recent rent roll and the last 12 months of T-12 income?
- It's been on market 41 days. Have you received any prior offers? Is the seller open to a 22% concession, seller financing, or rate buy-down credit?
- Built in 1952 — when were the roof, HVAC, electrical panel, plumbing, and water heater last replaced?
- Is there a deadline driving the sale (1031 exchange, divorce, estate, relocation)? That informs how much negotiation room exists.
- Schools are B-rated — typically a magnet for longer-tenancy family renters. What's the average tenant stay here, and is there a school-zone premium baked into asking?
- The area grade is low — what's the realistic commute time and amenity access for the typical tenant pool here? Any planned neighborhood developments (good or bad) we should know about?
- What's the average days-on-market for RENTAL listings here right now (not sales)? A rising rental-DOM trend means longer vacancies and softer asking-rent achievability than the comps imply.
- What's the recent tenant-quality profile in this submarket — average credit score on applications, eviction rate, late-payment / NSF rate, and stable-employment percentage? A property-management company in the area should have these aggregated.
- How much new for-sale + rental construction is in the pipeline within 1–3 miles? Heavy new supply typically softens prices + rents 12–24 months out; constrained supply supports both.
Investment metrics
- 1% rule
- 0.78% ✗
- Cap rate
- 5.26%
- Cash-on-cash
- -3.68%
- DSCR
- 0.84
- GRM
- 10.7
CMA / ARV
- ARV (median comp)
- $294,646
- List price
- $249,000
- Delta
- -15.49%
- Verdict
- UNDERPRICED
- Comps
- 20 within 1.0 mi
Show comp detail 12 sales within ~0.75 mi
| Address | Dist | Beds/Ba | Sqft | Sold | Price | $/sf | Match |
|---|---|---|---|---|---|---|---|
| 5300 Lake Ave | 0.08mi | 3/1.0 | 998 (-9%) | 2mo | $225,000 | $225 | 76 |
| 5113 Lake Ave | 0.36mi | 4/1.0 (+1) | 1,080 (-2%) | 6mo | $256,000 | $237 | 66 |
| 5244 Lake Ave | 0.16mi | 3/2.0 | 1,248 (+14%) | 8mo | $310,000 | $248 | 64 |
| 3161 Abbott Rd | 0.51mi | 3/1.0 | 1,027 (-7%) | 2mo | $237,500 | $231 | 60 |
| 41 Hillside Ave | 0.49mi | 3/1.0 | 1,073 (-2%) | 12mo | $255,000 | $238 | 59 |
| 160 Bielak Rd | 0.42mi | 3/1.0 | 1,170 (+6%) | 10mo | $250,000 | $214 | 57 |
| 180 Burmon Dr | 0.44mi | 3/1.0 | 1,014 (-8%) | 9mo | $270,000 | $266 | 55 |
| 183.5 Vistula Ave | 0.34mi | 3/1.0 | 1,040 (-6%) | 20mo | $179,500 | $173 | 54 |
| 152 Burmon Dr | 0.47mi | 3/1.0 | 1,007 (-8%) | 7mo | $271,000 | $269 | 54 |
| 359 Lakeview Ave | 0.31mi | 3/1.0 | 1,230 (+12%) | 10mo | $220,000 | $179 | 54 |
| 188 Burmon Dr | 0.44mi | 3/1.0 | 988 (-10%) | 12mo | $280,188 | $284 | 48 |
| 64 Burmon Dr | 0.61mi | 3/2.0 | 1,200 (+9%) | 10mo | $241,200 | $201 | 48 |
Match score weights: distance 35% · size 25% · config 20% · recency 20%. Top-matched comps best support the ARV.
Projected returns pro-forma
-3.0% appreciation · 3.0% rent growth · sell at horizon
- IRR
- -22.4%
- Equity multiple
- 0.23×
- Total profit
- $-53,910
- Equity at exit
- $37,127
- IRR
- -16.6%
- Equity multiple
- 0.08×
- Total profit
- $-64,275
- Equity at exit
- $21,529
Cash invested: $69,720 (down + closing). Projections, not guarantees.
Landlord ↔ Tenant lean methodology
- Overall (STATE)
- 15 Strongly Tenant-Friendly
- State New York
- 15 Strongly Tenant-Friendly · D+10
- County
- — inherits STATE
- City
- — inherits STATE
ZIP-level market 14127
- Home prices YoY
- -33.6%
- Active inventory
- 144
- Price-to-rent
- 10.7×
Monthly cashflow live
- Estimated rent
- $1,944 medium interval (Pro) →
- Mortgage (P&I)
- −$1,306
- Tax from tax record
- −$340 /mo · $4,083/yr
- Insurance
- −$104
- HOA
- −$0
- Vacancy / Maint / Mgmt
- −$408
- Net cashflow
- $-214
Break-even live
Sensitivity live
| Price | -10% $-73 | -5% $-143 | +0% $-214 | +5% $-284 | +10% $-355 |
|---|---|---|---|---|---|
| Rent | -10% $-367 | -5% $-290 | +0% $-214 | +5% $-137 | +10% $-60 |
| Rate | -1.0pp $-88 | -0.5pp $-150 | base $-214 | +0.5pp $-278 | +1.0pp $-344 |
UW: 25.0% down · 7.5% · 30yr · 1.5% tax · 5.0% vac · 8.0% maint · 8.0% mgmt
Financing live
Cash to close
- Down payment
- $62,250
- Closing costs
- $7,470
- Reserves months
- —
- Total cash needed
- —
Loan-product check · same deal, 3 products live
Conventional
25% down · 7.5% · 30yr
- Down + closing
- —
- Monthly P&I
- —
- Monthly cashflow
- —
- DSCR
- —
- Eligible?
- —
Personal DTI + credit; lowest rate.
DSCR
20% down · 8.5% · 30yr
- Down + closing
- —
- Monthly P&I
- —
- Monthly cashflow
- —
- DSCR
- —
- Eligible?
- —
No personal income docs; deal must DSCR.
Hard money
10% down · 12.0% · 12mo
- Down + closing
- —
- Monthly P&I
- —
- Monthly cashflow
- —
- DSCR
- —
- Eligible?
- —
Short-term bridge; refi at stabilization.
Rent comps 3 comps
| Address | Beds | Baths | Sqft | Rent | $/sqft | DOM | Units | Dist |
|---|---|---|---|---|---|---|---|---|
| 158 South Dr Buffalo, NY | 2.0 | 2.5 | 1380 | $2,500 | $1.81 | 3d | 1 | 0.99mi |
| 3835 Teachers Ln Orchard Park, NY | 1.0–2.0 | 1.0 | 980 | $1,410 | $1.44 | 3d | 1 | 1.29mi |
| 3400 McKinley Pkwy Buffalo, NY | 2.0 | 1.0 | 908 | $1,330 | $1.46 | 3d | 1 | 1.46mi |
Listing history 20 events
-
2026-06-21days on market $249,000 Active 41 DOM
-
2026-06-18days on market $249,000 Active 38 DOM
-
2026-06-17days on market $249,000 Active 37 DOM
-
2026-06-16days on market $249,000 Active 36 DOM
-
2026-06-15days on market $249,000 Active 35 DOM
-
2026-06-13days on market $249,000 Active 33 DOM
-
2026-06-13days on market $249,000 Active 32 DOM
-
2026-06-10days on market $249,000 Active 30 DOM
-
2026-06-09days on market $249,000 Active 29 DOM
-
2026-06-08days on market $249,000 Active 28 DOM
-
2026-06-07days on market $249,000 Active 27 DOM
-
2026-06-05days on market $249,000 Active 24 DOM
-
2026-06-03days on market $249,000 Active 23 DOM
-
2026-06-02days on market $249,000 Active 22 DOM
-
2026-06-01days on market $249,000 Active 21 DOM
-
2026-05-31days on market $249,000 Active 20 DOM
-
2026-05-11$249,000 Active 540-char remark
-
2026-02-20$299,000 Active
-
2024-12-06historical
-
2024-08-05$179,000 Active
ⓘ Source: listings_history table (triggers on properties + properties_extension) + one-shot
backfill from property_details.listing_events for pre-trigger history.
Tax reassessment forecast NY · Partial reset (capped growth)
- Current annual tax
- $4,083 · $340/mo
- Projected year-2 tax
- $4,145 · $345/mo
- Expected delta
- +$63/yr (+$5/mo · 1.5%)
ⓘ Screening estimate from a state-policy table — verify with the county assessor before closing.
Climate risk First Street
- Flood 1/10 Low FEMA zone X (unshaded) · 0% chance over 30 yrs
- Wildfire 3/10 Moderate
- Heat 2/10 Low 6 d/yr ≥93°F today · 14 d/yr by 30 yrs out
- Wind 1/10 Low
- Air quality 4/10 Moderate 3 unhealthy d/yr today · 8 by 30 yrs out
Nearby sold comps map
Loading sold comps map…
Walkable amenities ~0.75 mi
Loading nearby amenities…
Taxation est. · year 1
- Rental income
- $23,333
- − Mortgage interest
- −$13,948
- − Property taxes
- −$4,083
- − Insurance
- −$1,245
- − Repairs & maintenance
- −$1,867
- − Management
- −$1,867
- − Depreciation
- −$7,244
- Taxable loss
- −$6,919
- Est. tax savings @ 24.0%
- +$1,661
- After-tax cash flow
- $-903/yr
For passive investors: Depreciation is non-cash, so a rental often shows a tax loss while cash-flowing — sheltering income. Rental losses are passive: they offset passive income freely, and up to $25,000/yr can offset ordinary (W-2) income if you actively participate and your MAGI is under $100k (phasing out to $0 by $150k); unused losses carry forward. On sale, claimed depreciation is recaptured at up to 25%, and gains may owe capital-gains tax (a 1031 exchange can defer both). Figures are a year-1 estimate at your 24.0% rate — not tax advice; consult a CPA.
Schools (NCES district)
- District
- Orchard Park Central School District
- NCES district ID
- 3621900
- Math proficiency
- 57% ▼ -13.00%
- Reading proficiency
- 73% ▲ 6.00%
- Median HH income
- $79,354
- Composite
- 57.97/100
- National rank
- #1039
- State rank
- #158 of 590 in NY
Livability — West Seneca
- Score
- 79/100
- State rank
- #130
- US rank
- #2089
Category grades
Schools grade is shown separately in the Schools card above.
Census & demographics
- County
- Erie County · 714,559 people
- City population
- 41,101
- Metro
- Buffalo-Cheektowaga, NY
- Population (ZIP)
- 31,543
- Household income
- $109,386
- Rent vs Own
- Severe rent burden
- 428.0
Population outlook (Erie County) Hauer SSP2
- Today (2025)
- 933,037 people
- By 2030
- 935,181 · +0.2%
- By 2040
- 928,531 · -0.5%
- By 2050
- 905,725 · -2.9%
- By 2075
- 834,037 · -10.6%
- By 2100
- 708,033 · -24.1%
Race, ethnicity, and origin ACS 2023
- Neighborhood character
- Predominantly White (92%)
- Race & ethnicity
- White 92% Two or more races 3% Hispanic / Latino 3% Black 1%
- Common ancestry
- Romanian 16% Lithuanian 3% Slovak 2%
- Foreign-born
- 2% · Canada
- Languages at home
- 97% English-only · Spanish 1%
Political lean MEDSL · Erie
- 2024 margin
- Lean D (+9.7) · D 54.8% · R 45.2%
- 2008→2024 swing
- -7.9pp toward R · 2008: 17.5pp · 2024: 9.7pp
- All cycles
- 2024: D+9.7 2020: D+14.7 2016: D+4.8 2012: D+15.6 2008: D+17.5
Not yet ingested
- Civics
- —
Market trends
- HPI YoY
- ▼ -151.52%
- Current HPI
- 298.7896
- Rent YoY
- —
- Metro
- Buffalo-Cheektowaga, NY
- State GDP YoY
- ▲ 2.60%
- F500 in state
- 92
Industry mix (Fortune 500 HQ in NY)
| Industry | F500 HQs | Revenue |
|---|---|---|
| Financial Services | 10 | $950B |
|
||
| Consumer Goods | 9 | $162B |
|
||
| Insurance | 4 | $225B |
|
||
| Telecommunications | 2 | $144B |
|
||
| Pharmaceuticals | 2 | $112B |
|
||
| Media / Entertainment | 2 | $69B |
|
||
Price history
+39.1% since first listed4 events — show timeline
- 2026-05-11 Listed $249,000 UNYREIS
- 2026-02-20 Listed $299,000 WNYREIS
- 2024-12-06 Listing Removed — OneKey® MLS as Distributed by MLS Grid
- 2024-08-05 Listed $179,000 OneKey® MLS as Distributed by MLS Grid
Property tax history
+2.5%/yrLatest (2025): $4,083 · +3.2% YoY. Source: county tax records.
Cash-flow waterfall
monthlySold comps — $/sqft
last 12 mo · ≤1 miLoading sold comps…