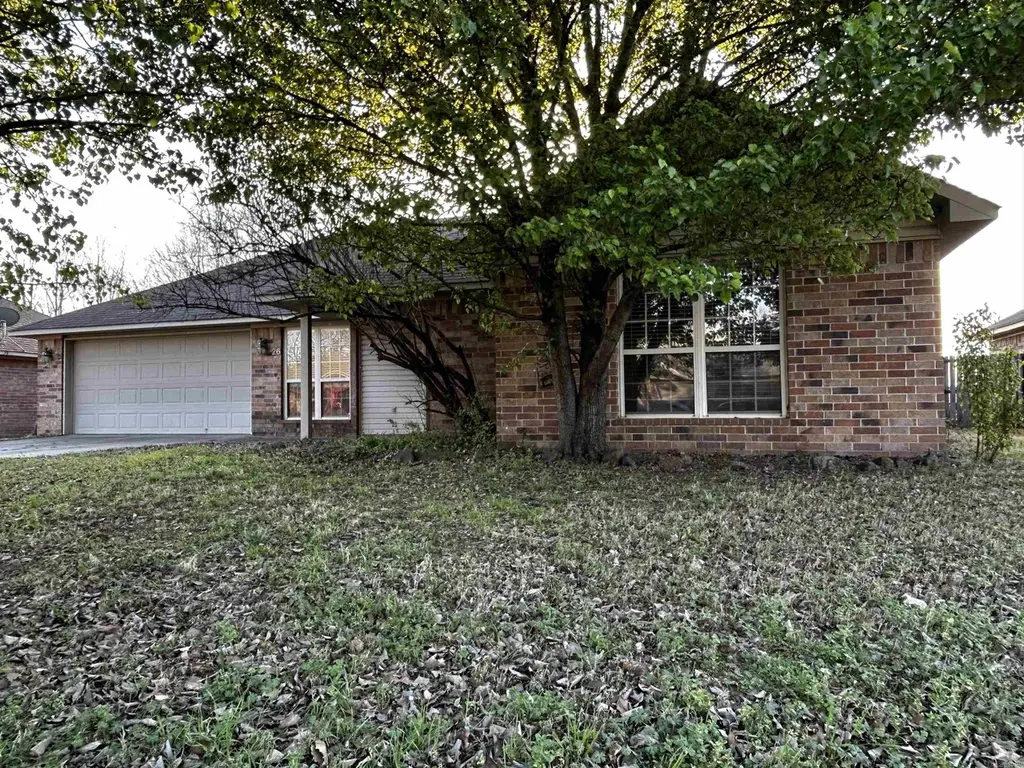
26 Blair Dr · Vilonia, AR
Flood risk 1/10 · Minimal
- FEMA flood zone
- X (unshaded)
- Chance of flooding over 30 yrs
- 0.0%
- Est. flood insurance / yr
- $507 – $1,088
Fire risk 6/10 · Moderate
- Est. fire insurance / yr
- $1,499 – $2,785
Heat risk 7/10 · Major
- Hot days now (above 110°F)
- 7 days/yr
- Hot days in 30 yrs
- 20 days/yr
Wind risk 4/10 · Minor
- Chance of severe wind over 30 yrs
- 10.0%
Air-quality risk 2/10 · Minimal
- Unhealthy air days now
- 1 days/yr
- Unhealthy air days in 30 yrs
- 1 days/yr
Risk factors via First Street. Map © Google.
Why this score? — see what drove the D+ grade
The composite is a weighted blend of 9 inputs, each scored 0–100. Each bar is that input's sub-score; the figure is the points it added to the 100-point composite (weight × sub-score).
- Cash flow +11.8/30.0
- Appreciation +10.0/10.0
- ARV discount +8.5/15.0
- Schools +4.1/10.0
- DSCR +3.5/10.0
- Livability +3.4/5.0
- 1% rule +2.5/10.0
- Rent growth +2.5/5.0
- Condition / age +2.5/5.0
$228,000
🖨 Deal sheet 📄 Offer letter ✓ Due diligence
Listing remarks MLS
26 Blair Drive is a 4 bedroom home in a well kept neighborhood that's close to town with a country feel and a beautiful sunset view. This move in ready home just needs a new owner. Call or text today for a showing!
Key facts
- 9,583 sq ft lot
- 2 garage spots
- Built 2004
Neighborhood map
What this means for you Summary
Snapshot
- This is a 4-bed/2.0-bath single-family listed at $228k.
Deal economics
- At list price, monthly cash flow is $-64 ($-768/yr) — negative.
- To cash-flow at today's rent, offer at most $217k (5.0% below list).
- To meet the 1% rule (rent ≥ 1% of price), the offer needs to be $172k (24.6% below list).
- Recommended offer: $172k (24.6% below list) — sets the bar for 1% rule.
- Cap rate 6.0% vs local median 3.6% in Vilonia — top-decile yield for the area; either an underpriced asset or a hidden risk that comps aren't pricing in. Stress-test before assuming the spread holds.
Location & tenants
- Location reads 67/100 on livability (#108 in AR) — a middle-class / working-renter tenant base. Strengths: crime A+, employment A+, cost of living A+; Watch: amenities F, commute F, health & safety F.
- Vilonia School District (rural): math 46% / reading 47% proficiency, ranked #23 of 238 in AR (top 10%) — families likely to look elsewhere, expect single-tenant / working-renter base with shorter leases.
- Market conditions: 106 active listings in the ZIP; 865 units permitted in Faulkner County in 2024 (451 in 5+ unit buildings).
Forward outlook
- In year one you build about $24k of equity ($2k loan paydown + $23k appreciation (10.0% local appreciation)).
- Faulkner County population projected at +32% by 2050 — long-run rental-demand tailwind backs the buy-and-hold thesis.
- At projected returns (10.0% appreciation + 3.0% rent growth), your $64k cash investment doubles in ~3 years — after that, you're playing with house money.
- By year 2, paydown + projected appreciation supports a ~$39k cash-out refi (75% LTV) — recoverable capital for the next deal without selling this one.
Negotiation context
- It's been on market 89 days — a 6% lower offer ($214k) is reasonable based on typical stale-listing flexibility.
- 2 sale attempts since 10y ago; this cycle's ask has dropped $12k (5%) from the opening price — seller is motivated, your offer sets the floor, not the list.
- Current owner paid $144k; list at $228k implies a 58% gain — meaningful room to come down on a strong offer.
Risks & watch-outs
- Climate carrying-cost: major wildfire risk; extreme-heat days projected 7→20/yr by 2055 (HVAC capex compounding) — expect insurance premiums to compound above CPI over the hold.
Questions for the listing agent
- What do current leases actually rent for vs. the listed asking? Can we see a recent rent roll and the last 12 months of T-12 income?
- It's been on market 89 days. Have you received any prior offers? Is the seller open to a 25% concession, seller financing, or rate buy-down credit?
- Why hasn't it sold? Are there any deal-killer items the seller is aware of (foundation, flood, title, zoning, code violations)?
- Is there a deadline driving the sale (1031 exchange, divorce, estate, relocation)? That informs how much negotiation room exists.
- Schools are B-rated — typically a magnet for longer-tenancy family renters. What's the average tenant stay here, and is there a school-zone premium baked into asking?
- The area grade is low — what's the realistic commute time and amenity access for the typical tenant pool here? Any planned neighborhood developments (good or bad) we should know about?
- What's the average days-on-market for RENTAL listings here right now (not sales)? A rising rental-DOM trend means longer vacancies and softer asking-rent achievability than the comps imply.
- What's the recent tenant-quality profile in this submarket — average credit score on applications, eviction rate, late-payment / NSF rate, and stable-employment percentage? A property-management company in the area should have these aggregated.
- How much new for-sale + rental construction is in the pipeline within 1–3 miles? Heavy new supply typically softens prices + rents 12–24 months out; constrained supply supports both.
Investment metrics
- 1% rule
- 0.75% ✗
- Cap rate
- 5.96%
- Cash-on-cash
- -1.20%
- DSCR
- 0.95
- GRM
- 11.1
CMA / ARV
- ARV (median comp)
- $233,066
- List price
- $228,000
- Delta
- -2.17%
- Verdict
- FAIR
- Comps
- 20 within 1.0 mi
Show comp detail 12 sales within ~0.75 mi
| Address | Dist | Beds/Ba | Sqft | Sold | Price | $/sf | Match |
|---|---|---|---|---|---|---|---|
| 35 Blair Dr | 0.04mi | 4/2.0 | 1,827 (+8%) | 3mo | $197,000 | $108 | 83 |
| 15 Weatherton Dr | 0.29mi | 3/2.0 (-1) | 1,764 (+4%) | 2mo | $244,300 | $138 | 73 |
| 95 Dove Ln | 0.35mi | 3/2.0 (-1) | 1,801 (+6%) | 2mo | $290,000 | $161 | 66 |
| 86 Dove Ln | 0.41mi | 4/2.0 | 1,835 (+8%) | 6mo | $315,000 | $172 | 62 |
| 6 Barnwood Dr | 0.69mi | 4/2.0 | 1,640 (-3%) | 3mo | $208,750 | $127 | 60 |
| 7 Hawk | 0.43mi | 3/2.0 (-1) | 1,559 (-8%) | 2mo | $226,000 | $145 | 60 |
| 4 Hawk Dr | 0.44mi | 3/2.0 (-1) | 1,519 (-10%) | 4mo | $220,000 | $145 | 54 |
| 2 Farmhouse Cir | 0.64mi | 4/2.0 | 1,852 (+9%) | 2mo | $233,000 | $126 | 53 |
| 10 Barnwood Dr | 0.68mi | 4/2.0 | 1,852 (+9%) | 3mo | $231,400 | $125 | 51 |
| 77 Farmhouse Cir | 0.75mi | 4/2.0 | 1,852 (+9%) | 4mo | $218,975 | $118 | 46 |
| 4 Barnwood Dr | 0.69mi | 4/2.0 | 1,470 (-13%) | 2mo | $202,900 | $138 | 44 |
| 78 Farmhouse Cir | 0.75mi | 4/2.0 | 1,470 (-13%) | 4mo | $191,925 | $131 | 40 |
Match score weights: distance 35% · size 25% · config 20% · recency 20%. Top-matched comps best support the ARV.
Projected returns pro-forma
10.0% appreciation · 3.0% rent growth · sell at horizon
- IRR
- 23.4%
- Equity multiple
- 2.88×
- Total profit
- $120,028
- Equity at exit
- $205,400
- IRR
- 20.8%
- Equity multiple
- 6.58×
- Total profit
- $356,533
- Equity at exit
- $442,954
Cash invested: $63,840 (down + closing). Projections, not guarantees.
Landlord ↔ Tenant lean methodology
- Overall (STATE)
- 92 Strongly Landlord-Friendly
- State Arkansas
- 92 Strongly Landlord-Friendly · R+14
- County
- — inherits STATE
- City
- — inherits STATE
ZIP-level market 72173
- Home prices YoY
- 8.0%
- Active inventory
- 106
- Price-to-rent
- 11.1×
Monthly cashflow live
- Estimated rent
- $1,719 medium interval (Pro) →
- Mortgage (P&I)
- −$1,196
- Tax from tax record
- −$131 /mo · $1,574/yr
- Insurance
- −$95
- HOA
- −$0
- Vacancy / Maint / Mgmt
- −$361
- Net cashflow
- $-64
Break-even live
UW: 25.0% down · 7.5% · 30yr · 1.5% tax · 5.0% vac · 8.0% maint · 8.0% mgmt
Financing live
Cash to close
- Down payment
- $57,000
- Closing costs
- $6,840
- Reserves months
- —
- Total cash needed
- —
Loan-product check · same deal, 3 products live
Conventional
25% down · 7.5% · 30yr
- Down + closing
- —
- Monthly P&I
- —
- Monthly cashflow
- —
- DSCR
- —
- Eligible?
- —
Personal DTI + credit; lowest rate.
DSCR
20% down · 8.5% · 30yr
- Down + closing
- —
- Monthly P&I
- —
- Monthly cashflow
- —
- DSCR
- —
- Eligible?
- —
No personal income docs; deal must DSCR.
Hard money
10% down · 12.0% · 12mo
- Down + closing
- —
- Monthly P&I
- —
- Monthly cashflow
- —
- DSCR
- —
- Eligible?
- —
Short-term bridge; refi at stabilization.
Listing history 25 events
-
2026-06-18days on market $228,000 Active 89 DOM
-
2026-06-17days on market $228,000 Active 88 DOM
-
2026-06-16days on market $228,000 Active 87 DOM
-
2026-06-15days on market $228,000 Active 86 DOM
-
2026-06-14days on market $228,000 Active 84 DOM
-
2026-06-13days on market $228,000 Active 83 DOM
-
2026-06-10days on market $228,000 Active 81 DOM
-
2026-06-09days on market $228,000 Active 80 DOM
-
2026-06-08days on market $228,000 Active 79 DOM
-
2026-06-07days on market $228,000 Active 78 DOM
-
2026-06-03days on market $228,000 Active 74 DOM
-
2026-06-02days on market $228,000 Active 73 DOM
-
2026-06-01days on market $228,000 Active 72 DOM
-
2026-05-31days on market $228,000 Active 71 DOM
-
2026-05-31days on market $228,000 Active 70 DOM
-
2026-05-06price $228,000 214-char remark
Show marketing remark (214 chars)
26 Blair Drive is a 4 bedroom home in a well kept neighborhood that's close to town with a country feel and a beautiful sunset view. This move in ready home just needs a new owner. Call or text today for a showing!
-
2026-04-29price $238,000 214-char remark
Show marketing remark (214 chars)
26 Blair Drive is a 4 bedroom home in a well kept neighborhood that's close to town with a country feel and a beautiful sunset view. This move in ready home just needs a new owner. Call or text today for a showing!
-
2026-03-21$240,000 New Listing 214-char remark
Show marketing remark (214 chars)
26 Blair Drive is a 4 bedroom home in a well kept neighborhood that's close to town with a country feel and a beautiful sunset view. This move in ready home just needs a new owner. Call or text today for a showing!
-
2019-12-23soldstatus $144,500
-
2016-10-19historical
-
2016-09-09price $132,900
-
2016-07-26$134,900 New Listing
-
2006-09-06soldstatus $125,000
-
2005-01-21soldstatus $104,000
-
2004-06-15soldstatus $14,000
ⓘ Source: listings_history table (triggers on properties + properties_extension) + one-shot
backfill from property_details.listing_events for pre-trigger history.
Tax reassessment forecast AR · Resets to sale price
- Current annual tax
- $1,574 · $131/mo
- Projected year-2 tax
- $1,574 · $131/mo
- Expected delta
- $0/yr ($0/mo · 0.0%)
ⓘ Screening estimate from a state-policy table — verify with the county assessor before closing.
Climate risk First Street
- Flood 1/10 Low FEMA zone X (unshaded) · 0% chance over 30 yrs
- Wildfire 6/10 Major
- Heat 7/10 Severe 7 d/yr ≥110°F today · 20 d/yr by 30 yrs out
- Wind 4/10 Moderate 10% chance of damaging wind over 30 yrs
- Air quality 2/10 Low 1 unhealthy d/yr today · 1 by 30 yrs out
Nearby sold comps map
Loading sold comps map…
Walkable amenities ~0.75 mi
Loading nearby amenities…
Taxation est. · year 1
- Rental income
- $20,625
- − Mortgage interest
- −$12,772
- − Property taxes
- −$1,574
- − Insurance
- −$1,140
- − Repairs & maintenance
- −$1,650
- − Management
- −$1,650
- − Depreciation
- −$6,633
- Taxable loss
- −$4,794
- Est. tax savings @ 24.0%
- +$1,150
- After-tax cash flow
- $382/yr
For passive investors: Depreciation is non-cash, so a rental often shows a tax loss while cash-flowing — sheltering income. Rental losses are passive: they offset passive income freely, and up to $25,000/yr can offset ordinary (W-2) income if you actively participate and your MAGI is under $100k (phasing out to $0 by $150k); unused losses carry forward. On sale, claimed depreciation is recaptured at up to 25%, and gains may owe capital-gains tax (a 1031 exchange can defer both). Figures are a year-1 estimate at your 24.0% rate — not tax advice; consult a CPA.
Schools (NCES district)
- District
- Vilonia School District
- NCES district ID
- 0513530
- Math proficiency
- 46% ▼ -11.00%
- Reading proficiency
- 47% ▼ -4.00%
- Median HH income
- $57,913
- Composite
- 40.64/100
- National rank
- #3681
- State rank
- #23 of 238 in AR
Livability — Vilonia
- Score
- 67/100
- State rank
- #108
- US rank
- #10836
Category grades
Schools grade is shown separately in the Schools card above.
Census & demographics
- Census place
- Vilonia, AR
- Population (ZIP)
- 10,122
Population outlook (Faulkner County) Hauer SSP2
- Today (2025)
- 138,985 people
- By 2030
- 148,264 · +6.7%
- By 2040
- 166,010 · +19.4%
- By 2050
- 183,362 · +31.9%
- By 2075
- 224,593 · +61.6%
- By 2100
- 250,603 · +80.3%
Race, ethnicity, and origin ACS 2023
- Neighborhood character
- Predominantly White (92%)
- Race & ethnicity
- White 92% Hispanic / Latino 4% Two or more races 3%
- Common ancestry
- Slovak 2% Scotch-Irish 2% Italian 1%
- Foreign-born
- 1% · Canada
- Languages at home
- 96% English-only · Spanish 3%
Political lean MEDSL · Faulkner
- 2024 margin
- Solid R (+32.3) · D 32.6% · R 64.9% · Other 2.5%
- 2008→2024 swing
- -7.1pp toward R · 2008: -25.3pp · 2024: -32.3pp
- All cycles
- 2024: R+32.3 2020: R+29.5 2016: R+31.6 2012: R+31.7 2008: R+25.3
Not yet ingested
- Civics
- —
Market trends
- HPI YoY
- ▲ 22.08%
- Current HPI
- 298.3398
- Rent YoY
- —
- Metro
- —
- State GDP YoY
- ▲ 3.80%
- F500 in state
- 10
Industry mix (Fortune 500 HQ in AR)
| Industry | F500 HQs | Revenue |
|---|---|---|
| Retail | 1 | $681B |
|
||
| Food / Agriculture | 1 | $53B |
|
||
| Retail / Energy | 1 | $22B |
|
||
| Transportation / Logistics | 1 | $12B |
|
||
| Energy | 1 | $4B |
|
||
Price history
+1528.6% since first listed10 events — show timeline
- 2026-05-06 Price Changed $228,000 CARMLS
- 2026-04-29 Price Changed $238,000 CARMLS
- 2026-03-21 Listed $240,000 CARMLS
- 2019-12-23 Sold (Public Records) $144,500 Public Records
- 2016-10-19 Listing Removed — CARMLS
- 2016-09-09 Price Changed $132,900 CARMLS
- 2016-07-26 Listed $134,900 CARMLS
- 2006-09-06 Sold (Public Records) $125,000 Public Records
- 2005-01-21 Sold (Public Records) $104,000 Public Records
- 2004-06-15 Sold (Public Records) $14,000 Public Records
Property tax history
+2.2%/yrLatest (2025): $1,574 · +9.1% YoY. Source: county tax records.
Cash-flow waterfall
monthlySold comps — $/sqft
last 12 mo · ≤1 miLoading sold comps…