 Multi-family
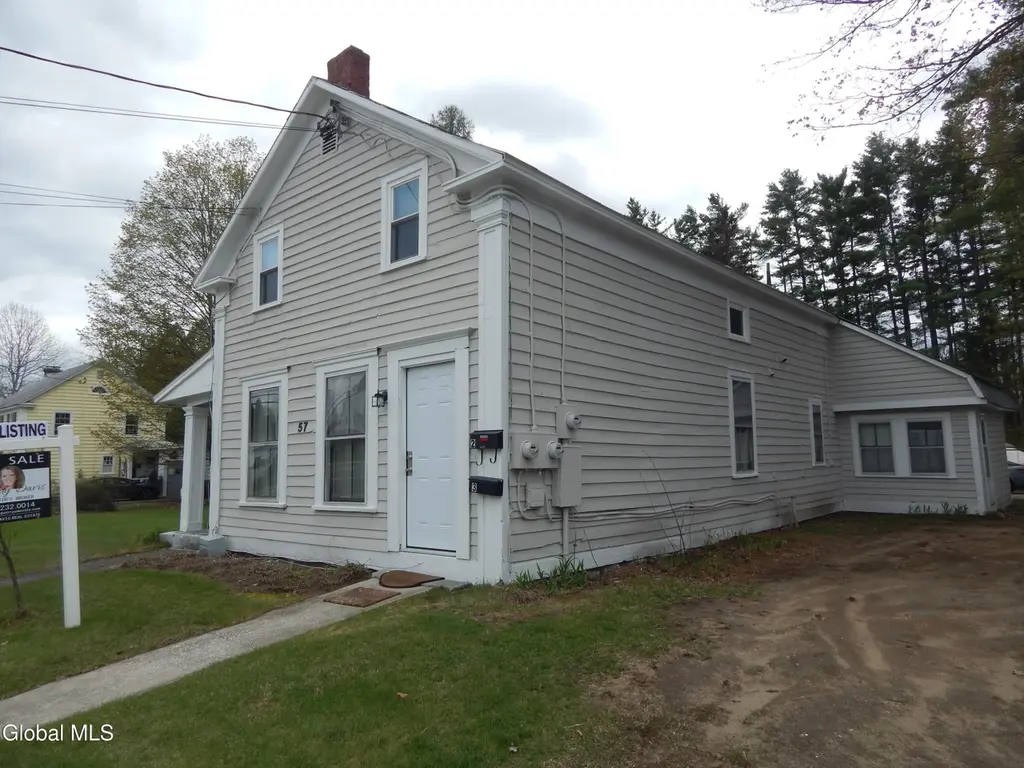
57 Hudson St · Warrensburg, NY
Flood risk 1/10 · Minimal
- FEMA flood zone
- X
- Chance of flooding over 30 yrs
- 0.0%
- Est. flood insurance / yr
- $473 – $860
Fire risk 3/10 · Minor
- Est. fire insurance / yr
- $691 – $1,283
Heat risk 2/10 · Minimal
- Hot days now (above 92°F)
- 7 days/yr
- Hot days in 30 yrs
- 17 days/yr
Wind risk 2/10 · Minimal
- Chance of severe wind over 30 yrs
- 2.0%
Air-quality risk 1/10 · Minimal
- Unhealthy air days now
- 0 days/yr
- Unhealthy air days in 30 yrs
- 0 days/yr
Risk factors via First Street. Map © Google.
Why this score? — see what drove the C- grade
The composite is a weighted blend of 9 inputs, each scored 0–100. Each bar is that input's sub-score; the figure is the points it added to the 100-point composite (weight × sub-score).
- Cash flow +19.6/30.0
- Appreciation +10.0/10.0
- DSCR +6.2/10.0
- 1% rule +4.5/10.0
- Schools +4.1/10.0
- Livability +3.2/5.0
- Rent growth +2.5/5.0
- Condition / age +2.5/5.0
- ARV discount +0.0/15.0
$349,000
🖨 Deal sheet 📄 Offer letter ✓ Due diligence
Multi-family units
County records classify this as Multi-Family (2-4 Unit). Listing-text estimate: 1 unit. estimate disagrees with records
Listing remarks
A unique 3 family! A duplex and a single family home on one lot. Off street parking for all and a large yard! Walking distance to everything in Warrensburg. Great income producing opportunity. Live in one and rent the other two or rent all three!
Key facts
- Off street parking
- Walking distance
- Single family home
Tags
Property features AI
Exterior
- Parking: Off-street parking for 6 vehicles
- Utilities: Public water; Public sewer
- Home design: Triplex; Living area reported as 2,500 (unit breakdown not provided)
- Construction: Wood siding
- Exterior features: Garden; Main road frontage of 136 feet; Lot dimensions: 136 x 144 x 140 x 145; Lot size about 0.46 acres
Interior
- Bedrooms: Unit 1: 2 bedrooms; Unit 2: 1 bedroom; Unit 3: 2 bedrooms
- Flooring: Vinyl; Carpet
- Bathrooms: Total of 2 full bathrooms in the building; One full bath on the 1st floor; Two full baths on the 2nd floor
- Heating & cooling: Oil heating
- Interior features: Vinyl and carpet flooring; Partial basement; Garden (exterior-facing amenity listed under interior grouping)
Neighborhood map
What this means for you Summary
Snapshot
- This is a 3-bed/2.0-bath multifamily listed at $349k.
Deal economics
- At list price, monthly cash flow is $403 ($5k/yr) — positive.
- The deal already cash-flows at list — no discount required.
- To meet the 1% rule (rent ≥ 1% of price), the offer needs to be $332k (4.7% below list).
- Recommended offer: $332k (4.7% below list) — sets the bar for 1% rule.
- Cap rate 7.7% vs local median 2.6% in Warrensburg — top-decile yield for the area; either an underpriced asset or a hidden risk that comps aren't pricing in. Stress-test before assuming the spread holds.
Location & tenants
- Location reads 63/100 on livability (#823 in NY) — a middle-class / working-renter tenant base. Strengths: housing A+, cost of living B+, crime B; Watch: amenities F, commute F, health & safety D-.
- Warrensburg Central School District (town): math 47% / reading 44% proficiency, ranked #552 of 755 in NY (top 73%) — families likely to look elsewhere, expect single-tenant / working-renter base with shorter leases.
- Zoned schools: Warrensburg Elementary School (math 37% / reading 52%, grade F, #1,277 of 2,108 statewide, top 64%, 361 students, 58% FRL); Warrensburg Junior-Senior High School (math 62% / reading 57%, grade C+, #851 of 1,100 statewide, top 80%, 302 students, 64% FRL) — zoned schools average 61% FRL vs 39% district-wide (21 pts higher); higher-poverty schools than district average — tighter screening recommended.
- Market conditions: 49 active listings in the ZIP; 180 units permitted in Warren County in 2024 (40 in 5+ unit buildings).
Forward outlook
- In year one you build about $37k of equity ($2k loan paydown + $35k appreciation (10.0% local appreciation)).
- Warren County population projected at -19% by 2050 — secular population decline; favor cash flow + early exit over multi-decade hold.
- At projected returns (10.0% appreciation + 3.0% rent growth), your $98k cash investment doubles in ~3 years — after that, you're playing with house money.
- By year 2, paydown + projected appreciation supports a ~$60k cash-out refi (75% LTV) — recoverable capital for the next deal without selling this one.
Negotiation context
- It's been on market 45 days — a 3% lower offer ($339k) is reasonable based on typical stale-listing flexibility.
- Current owner paid $48k; list at $349k implies a 627% gain — meaningful room to come down on a strong offer.
Risks & watch-outs
- Watch-outs: built in 1900 — expect roof / HVAC / electrical / plumbing capex.
Questions for the listing agent
- It's been on market 45 days. Have you received any prior offers? Is the seller open to a 5% concession, seller financing, or rate buy-down credit?
- Built in 1900 — when were the roof, HVAC, electrical panel, plumbing, and water heater last replaced?
- Is there a deadline driving the sale (1031 exchange, divorce, estate, relocation)? That informs how much negotiation room exists.
- Schools are D-rated, which usually means shorter tenancies and higher turnover. Who's the typical renter profile here, and what's been the actual vacancy rate?
- What's the average days-on-market for RENTAL listings here right now (not sales)? A rising rental-DOM trend means longer vacancies and softer asking-rent achievability than the comps imply.
- What's the recent tenant-quality profile in this submarket — average credit score on applications, eviction rate, late-payment / NSF rate, and stable-employment percentage? A property-management company in the area should have these aggregated.
- How much new apartment / multifamily construction is in the pipeline within 1–3 miles? Heavy new supply (>2% of stock underway) typically softens rents 12–24 months out; light construction supports rent growth.
Investment metrics
- 1% rule
- 0.95% ✗
- Cap rate
- 7.68%
- Cash-on-cash
- 4.95%
- DSCR
- 1.22
- GRM
- 8.7
CMA / ARV
- ARV (median comp)
- $244,818
- List price
- $349,000
- Delta
- 42.55%
- Verdict
- OVERPRICED
- Comps
- 7 within 1.0 mi
Projected returns pro-forma
10.0% appreciation · 3.0% rent growth · sell at horizon
- IRR
- 27.9%
- Equity multiple
- 3.21×
- Total profit
- $215,685
- Equity at exit
- $314,407
- IRR
- 24.3%
- Equity multiple
- 7.29×
- Total profit
- $614,835
- Equity at exit
- $678,030
Cash invested: $97,720 (down + closing). Projections, not guarantees.
Landlord ↔ Tenant lean methodology
- Overall (STATE)
- 15 Strongly Tenant-Friendly
- State New York
- 15 Strongly Tenant-Friendly · D+10
- County
- — inherits STATE
- City
- — inherits STATE
ZIP-level market 12885
- Home prices YoY
- 19.6%
- Active inventory
- 49
- Price-to-rent
- 26.2×
Monthly cashflow live
- Estimated rent
- $3,325 medium interval (Pro) →
- Mortgage (P&I)
- −$1,830
- Tax from tax record
- −$248 /mo · $2,976/yr
- Insurance
- −$145
- HOA
- −$0
- Vacancy / Maint / Mgmt
- −$698
- Net cashflow
- $403
Break-even live
3-unit breakdown (identical units grouped — click to expand)
| Units | Beds | Baths | Est. rent |
|---|---|---|---|
| 3× units | 3 | 2 | $3,324 |
| #1 | 3 | 2 | $1,108 |
| #2 | 3 | 2 | $1,108 |
| #3 | 3 | 2 | $1,108 |
| Total (3 units) | $3,325 | ||
UW: 25.0% down · 7.5% · 30yr · 1.5% tax · 5.0% vac · 8.0% maint · 8.0% mgmt
Financing live
Cash to close
- Down payment
- $87,250
- Closing costs
- $10,470
- Reserves months
- —
- Total cash needed
- —
Loan-product check · same deal, 3 products live
Conventional
25% down · 7.5% · 30yr
- Down + closing
- —
- Monthly P&I
- —
- Monthly cashflow
- —
- DSCR
- —
- Eligible?
- —
Personal DTI + credit; lowest rate.
DSCR
20% down · 8.5% · 30yr
- Down + closing
- —
- Monthly P&I
- —
- Monthly cashflow
- —
- DSCR
- —
- Eligible?
- —
No personal income docs; deal must DSCR.
Hard money
10% down · 12.0% · 12mo
- Down + closing
- —
- Monthly P&I
- —
- Monthly cashflow
- —
- DSCR
- —
- Eligible?
- —
Short-term bridge; refi at stabilization.
Listing history 16 events
-
2026-06-18days on market $349,000 Active 45 DOM
-
2026-06-17days on market $349,000 Active 44 DOM
-
2026-06-16days on market $349,000 Active 43 DOM
-
2026-06-15days on market $349,000 Active 42 DOM
-
2026-06-13days on market $349,000 Active 40 DOM
-
2026-06-12days on market $349,000 Active 39 DOM
-
2026-06-09days on market $349,000 Active 36 DOM
-
2026-06-08days on market $349,000 Active 35 DOM
-
2026-06-07days on market $349,000 Active 34 DOM
-
2026-06-07days on market $349,000 Active 33 DOM
-
2026-06-04days on market $349,000 Active 30 DOM
-
2026-06-02days on market $349,000 Active 29 DOM
-
2026-06-01days on market $349,000 Active 28 DOM
-
2026-05-31days on market $349,000 Active 27 DOM
-
2026-05-04$349,000 Active 249-char remark
-
1994-05-03soldstatus $48,015
ⓘ Source: listings_history table (triggers on properties + properties_extension) + one-shot
backfill from property_details.listing_events for pre-trigger history.
Tax reassessment forecast NY · Partial reset (capped growth)
- Current annual tax
- $2,976 · $248/mo
- Projected year-2 tax
- $4,437 · $370/mo
- Expected delta
- +$1,461/yr (+$122/mo · 49.1%)
ⓘ Screening estimate from a state-policy table — verify with the county assessor before closing.
Climate risk First Street
- Flood 1/10 Low FEMA zone X · 0% chance over 30 yrs
- Wildfire 3/10 Moderate
- Heat 2/10 Low 7 d/yr ≥92°F today · 17 d/yr by 30 yrs out
- Wind 2/10 Low 2% chance of damaging wind over 30 yrs
- Air quality 1/10 Low 0 unhealthy d/yr today · 0 by 30 yrs out
Nearby sold comps map
Loading sold comps map…
Walkable amenities ~0.75 mi
Loading nearby amenities…
Taxation est. · year 1
- Rental income
- $39,900
- − Mortgage interest
- −$19,549
- − Property taxes
- −$2,976
- − Insurance
- −$1,745
- − Repairs & maintenance
- −$3,192
- − Management
- −$3,192
- − Depreciation
- −$10,153
- Taxable loss
- −$907
- Est. tax savings @ 24.0%
- +$218
- After-tax cash flow
- $5,055/yr
For passive investors: Depreciation is non-cash, so a rental often shows a tax loss while cash-flowing — sheltering income. Rental losses are passive: they offset passive income freely, and up to $25,000/yr can offset ordinary (W-2) income if you actively participate and your MAGI is under $100k (phasing out to $0 by $150k); unused losses carry forward. On sale, claimed depreciation is recaptured at up to 25%, and gains may owe capital-gains tax (a 1031 exchange can defer both). Figures are a year-1 estimate at your 24.0% rate — not tax advice; consult a CPA.
Schools (NCES district)
- District
- Warrensburg Central School District
- NCES district ID
- 3629910
- Math proficiency
- 47% ▲ 4.00%
- Reading proficiency
- 44% ▼ -2.00%
- Median HH income
- $48,828
- Composite
- 41.15/100
- National rank
- #7424
- State rank
- #552 of 755 in NY
Livability — Warrensburg
- Score
- 63/100
- State rank
- #823
- US rank
- #15925
Category grades
Schools grade is shown separately in the Schools card above.
Census & demographics
- Census place
- Warrensburg, NY
- Population (ZIP)
- 4,531
Population outlook (Warren County) Hauer SSP2
- Today (2025)
- 62,372 people
- By 2030
- 60,491 · -3.0%
- By 2040
- 55,616 · -10.8%
- By 2050
- 50,437 · -19.1%
- By 2075
- 40,843 · -34.5%
- By 2100
- 31,159 · -50.0%
Race, ethnicity, and origin ACS 2023
- Neighborhood character
- Predominantly White (89%)
- Race & ethnicity
- White 89% Two or more races 5% Asian 3% Hispanic / Latino 3%
- Common ancestry
- Lithuanian 4% Portuguese 2% Slovak 2%
- Foreign-born
- 4% · Canada
- Languages at home
- 96% English-only · Other Indo-European 2% Tagalog/Filipino 1%
Political lean MEDSL · Warren
- 2024 margin
- Toss-up / Even · D 47.9% · R 52.1%
- 2008→2024 swing
- -6.9pp toward R · 2008: 2.6pp · 2024: -4.2pp
- All cycles
- 2024: R+4.2 2020: R+0.2 2016: R+10.6 2012: D+2.1 2008: D+2.6
Not yet ingested
- Civics
- —
Market trends
- HPI YoY
- ▲ 60.30%
- Current HPI
- 368.3803
- Rent YoY
- —
- Metro
- —
- State GDP YoY
- ▲ 2.60%
- F500 in state
- 92
Industry mix (Fortune 500 HQ in NY)
| Industry | F500 HQs | Revenue |
|---|---|---|
| Financial Services | 10 | $950B |
|
||
| Consumer Goods | 9 | $162B |
|
||
| Insurance | 4 | $225B |
|
||
| Telecommunications | 2 | $144B |
|
||
| Pharmaceuticals | 2 | $112B |
|
||
| Media / Entertainment | 2 | $69B |
|
||
Price history
+626.9% since first listed2 events — show timeline
- 2026-05-04 Listed $349,000 Global MLS
- 1994-05-03 Sold (Public Records) $48,015 Public Records
Property tax history
-1.6%/yrLatest (2025): $2,976 · -0.5% YoY. Source: county tax records.
Cash-flow waterfall
monthlySold comps — $/sqft
last 12 mo · ≤1 miLoading sold comps…