 Multi-family
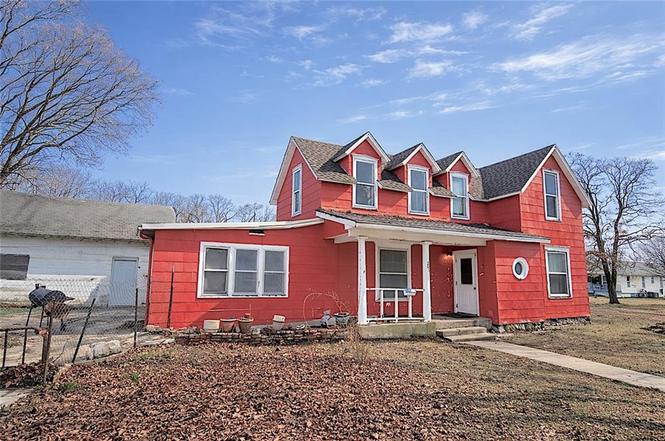
203 S Elm St · Garnett, KS
Flood risk 1/10 · Minimal
- FEMA flood zone
- X (unshaded)
- Chance of flooding over 30 yrs
- 0.0%
- Est. flood insurance / yr
- $507 – $1,088
Fire risk 3/10 · Minor
- Est. fire insurance / yr
- $1,154 – $2,142
Heat risk 4/10 · Minor
- Hot days now (above 109°F)
- 7 days/yr
- Hot days in 30 yrs
- 17 days/yr
Wind risk 2/10 · Minimal
- Chance of severe wind over 30 yrs
- —
Air-quality risk 2/10 · Minimal
- Unhealthy air days now
- 1 days/yr
- Unhealthy air days in 30 yrs
- 1 days/yr
Risk factors via First Street. Map © Google.
Why this score? — see what drove the B grade
The composite is a weighted blend of 9 inputs, each scored 0–100. Each bar is that input's sub-score; the figure is the points it added to the 100-point composite (weight × sub-score).
- Cash flow +30.0/30.0
- 1% rule +10.0/10.0
- DSCR +10.0/10.0
- ARV discount +7.5/15.0
- Livability +3.5/5.0
- Schools +2.8/10.0
- Rent growth +2.5/5.0
- Condition / age +2.5/5.0
- Appreciation +1.4/10.0
$59,000
🖨 Deal sheet 📄 Offer letter ✓ Due diligence
Multi-family units
County records classify this as Multi-Family (5+ Unit). Listing-text estimate: 1 unit. estimate disagrees with records
5+ unit building — per-unit beds/baths from public records are typically unavailable; the breakdown below (if shown) is an estimate from the listing text.
Key facts
- Stained glass window
- Fenced side yard
- Huge walk-in pantry
Tags
Neighborhood map
What this means for you Summary
Snapshot
- This is a 4-bed/3.0-bath multifamily listed at $59k.
Deal economics
- At list price, monthly cash flow is $667 ($8k/yr) — positive.
- The deal already cash-flows at list — no discount required.
- Meets the 1% rule at list price ($1k rent vs $59k).
- Recommended offer: $57k (3.0% below list) — sets the bar for market timing.
- Cap rate 19.9% vs local median 2.9% in Garnett — top-decile yield for the area; either an underpriced asset or a hidden risk that comps aren't pricing in. Stress-test before assuming the spread holds.
Location & tenants
- Location reads 70/100 on livability (#154 in KS) — a middle-class / working-renter tenant base. Strengths: cost of living A+, housing A+, health & safety A+; Watch: schools D+, employment D, amenities F.
- Garnett (rural): math 34% / reading 32% proficiency, ranked #85 of 169 in KS (top 50%) — families likely to look elsewhere, expect single-tenant / working-renter base with shorter leases.
- Market conditions: 34 active listings in the ZIP; 23 units permitted in Anderson County in 2024 (0 in 5+ unit buildings).
Forward outlook
- Local home prices are declining (-3.0%/yr); year-one equity from $408 of loan paydown is wiped out by about $2k of value loss. Plan a longer hold.
- Anderson County population projected at -25% by 2050 — secular population decline; favor cash flow + early exit over multi-decade hold.
- At projected returns (-3.0% appreciation + 3.0% rent growth), your $17k cash investment doubles in ~3 years — after that, you're playing with house money.
Negotiation context
- It's been on market 47 days — a 3% lower offer ($57k) is reasonable based on typical stale-listing flexibility.
- Current owner paid $28k; list at $59k implies a 111% gain — meaningful room to come down on a strong offer.
Risks & watch-outs
- Watch-outs: built in 1900 — expect roof / HVAC / electrical / plumbing capex.
Questions for the listing agent
- It's been on market 47 days. Have you received any prior offers? Is the seller open to a 3% concession, seller financing, or rate buy-down credit?
- Built in 1900 — when were the roof, HVAC, electrical panel, plumbing, and water heater last replaced?
- Is there a deadline driving the sale (1031 exchange, divorce, estate, relocation)? That informs how much negotiation room exists.
- Schools are D-rated, which usually means shorter tenancies and higher turnover. Who's the typical renter profile here, and what's been the actual vacancy rate?
- What's the average days-on-market for RENTAL listings here right now (not sales)? A rising rental-DOM trend means longer vacancies and softer asking-rent achievability than the comps imply.
- What's the recent tenant-quality profile in this submarket — average credit score on applications, eviction rate, late-payment / NSF rate, and stable-employment percentage? A property-management company in the area should have these aggregated.
- How much new apartment / multifamily construction is in the pipeline within 1–3 miles? Heavy new supply (>2% of stock underway) typically softens rents 12–24 months out; light construction supports rent growth.
Investment metrics
- 1% rule
- 2.28% ✓
- Cap rate
- 19.85%
- Cash-on-cash
- 48.43%
- DSCR
- 3.15
- GRM
- 3.7
CMA / ARV
No comps found within radius.
Projected returns pro-forma
-3.0% appreciation · 3.0% rent growth · sell at horizon
- IRR
- 46.0%
- Equity multiple
- 2.99×
- Total profit
- $32,918
- Equity at exit
- $8,797
- IRR
- 51.8%
- Equity multiple
- 6.05×
- Total profit
- $83,399
- Equity at exit
- $5,101
Cash invested: $16,520 (down + closing). Projections, not guarantees.
Landlord ↔ Tenant lean methodology
- Overall (STATE)
- 83 Strongly Landlord-Friendly
- State Kansas
- 83 Strongly Landlord-Friendly · R+10
- County
- — inherits STATE
- City
- — inherits STATE
ZIP-level market 66032
- Home prices YoY
- -2.6%
- Active inventory
- 34
- Price-to-rent
- 3.7×
Monthly cashflow live
- Estimated rent
- $1,346 medium interval (Pro) →
- Mortgage (P&I)
- −$309
- Tax from tax record
- −$63 /mo · $750/yr
- Insurance
- −$25
- HOA
- −$0
- Vacancy / Maint / Mgmt
- −$283
- Net cashflow
- $667
Break-even live
UW: 25.0% down · 7.5% · 30yr · 1.5% tax · 5.0% vac · 8.0% maint · 8.0% mgmt
Financing live
Cash to close
- Down payment
- $14,750
- Closing costs
- $1,770
- Reserves months
- —
- Total cash needed
- —
Loan-product check · same deal, 3 products live
Conventional
25% down · 7.5% · 30yr
- Down + closing
- —
- Monthly P&I
- —
- Monthly cashflow
- —
- DSCR
- —
- Eligible?
- —
Personal DTI + credit; lowest rate.
DSCR
20% down · 8.5% · 30yr
- Down + closing
- —
- Monthly P&I
- —
- Monthly cashflow
- —
- DSCR
- —
- Eligible?
- —
No personal income docs; deal must DSCR.
Hard money
10% down · 12.0% · 12mo
- Down + closing
- —
- Monthly P&I
- —
- Monthly cashflow
- —
- DSCR
- —
- Eligible?
- —
Short-term bridge; refi at stabilization.
Listing history 6 events
-
2026-04-18status Pending
-
2026-04-15historical Active Under Contract
-
2026-03-02$59,000 Active
-
2009-04-01soldstatus $28,000
-
2008-06-01soldstatus $16,000
-
2008-03-01soldstatus $14,759
ⓘ Source: listings_history table (triggers on properties + properties_extension) + one-shot
backfill from property_details.listing_events for pre-trigger history.
Tax reassessment forecast KS · Resets to sale price
- Current annual tax
- $750 · $63/mo
- Projected year-2 tax
- $832 · $69/mo
- Expected delta
- +$82/yr (+$7/mo · 10.9%)
ⓘ Screening estimate from a state-policy table — verify with the county assessor before closing.
Climate risk First Street
- Flood 1/10 Low FEMA zone X (unshaded) · 0% chance over 30 yrs
- Wildfire 3/10 Moderate
- Heat 4/10 Moderate 7 d/yr ≥109°F today · 17 d/yr by 30 yrs out
- Wind 2/10 Low
- Air quality 2/10 Low 1 unhealthy d/yr today · 1 by 30 yrs out
Nearby sold comps map
Loading sold comps map…
Walkable amenities ~0.75 mi
Loading nearby amenities…
Taxation est. · year 1
- Rental income
- $16,150
- − Mortgage interest
- −$3,305
- − Property taxes
- −$750
- − Insurance
- −$295
- − Repairs & maintenance
- −$1,292
- − Management
- −$1,292
- − Depreciation
- −$1,716
- Taxable income
- $7,500
- Est. tax owed @ 24.0%
- −$1,800
- After-tax cash flow
- $6,201/yr
For passive investors: Depreciation is non-cash, so a rental often shows a tax loss while cash-flowing — sheltering income. Rental losses are passive: they offset passive income freely, and up to $25,000/yr can offset ordinary (W-2) income if you actively participate and your MAGI is under $100k (phasing out to $0 by $150k); unused losses carry forward. On sale, claimed depreciation is recaptured at up to 25%, and gains may owe capital-gains tax (a 1031 exchange can defer both). Figures are a year-1 estimate at your 24.0% rate — not tax advice; consult a CPA.
Schools (NCES district)
- District
- Garnett
- NCES district ID
- 2006450
- Math proficiency
- 34% ▼ -5.00%
- Reading proficiency
- 32% ▼ -6.00%
- Median HH income
- $41,150
- Composite
- 27.86/100
- National rank
- #6876
- State rank
- #85 of 169 in KS
Livability — Garnett
- Score
- 70/100
- State rank
- #154
- US rank
- #7405
Category grades
Schools grade is shown separately in the Schools card above.
Census & demographics
- Census place
- Garnett, KS
- Population (ZIP)
- 5,133
Population outlook (Anderson County) Hauer SSP2
- Today (2025)
- 7,231 people
- By 2030
- 6,890 · -4.7%
- By 2040
- 6,171 · -14.7%
- By 2050
- 5,446 · -24.7%
- By 2075
- 4,078 · -43.6%
- By 2100
- 2,817 · -61.0%
Race, ethnicity, and origin ACS 2023
- Neighborhood character
- Predominantly White (90%)
- Race & ethnicity
- White 90% Two or more races 8% Hispanic / Latino 2%
- Common ancestry
- Slovak 3% Polish 2% Serbian 1%
- Languages at home
- 91% English-only · German/W. Germanic 7% Spanish 1%
Political lean MEDSL · Anderson
- 2024 margin
- Solid R (+59.8) · D 19.3% · R 79.1% · Other 1.6%
- 2008→2024 swing
- -27.0pp toward R · 2008: -32.7pp · 2024: -59.8pp
- All cycles
- 2024: R+59.8 2020: R+56.7 2016: R+52.5 2012: R+40.0 2008: R+32.7
Not yet ingested
- Civics
- —
Market trends
- HPI YoY
- ▼ -7.17%
- Current HPI
- 272.75
- Rent YoY
- —
- Metro
- —
- State GDP YoY
- —
- F500 in state
- 0
Price history
+299.8% since first listed6 events — show timeline
- 2026-04-18 Pending — Heartland MLS as Distributed by MLS Grid
- 2026-04-15 Contingent — Heartland MLS as Distributed by MLS Grid
- 2026-03-02 Listed $59,000 Heartland MLS as Distributed by MLS Grid
- 2009-04-01 Sold (Public Records) $28,000 Public Records
- 2008-06-01 Sold (Public Records) $16,000 Public Records
- 2008-03-01 Sold (Public Records) $14,759 Public Records
Property tax history
+7.0%/yrLatest (2025): $750 · +3.1% YoY. Source: county tax records.
Cash-flow waterfall
monthlySold comps — $/sqft
last 12 mo · ≤1 miLoading sold comps…