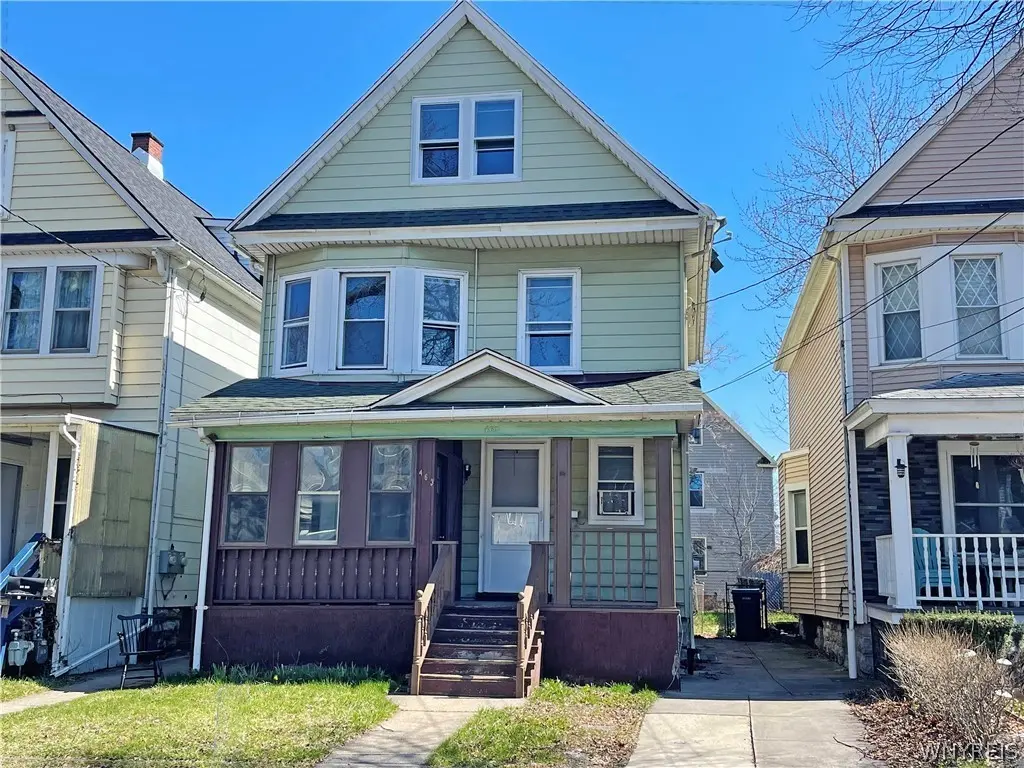
463 East St · Buffalo, NY
Flood risk 1/10 · Minimal
- FEMA flood zone
- X (unshaded)
- Chance of flooding over 30 yrs
- 0.0%
- Est. flood insurance / yr
- $473 – $860
Fire risk 1/10 · Minimal
- Est. fire insurance / yr
- $691 – $1,283
Heat risk 3/10 · Minor
- Hot days now (above 93°F)
- 7 days/yr
- Hot days in 30 yrs
- 15 days/yr
Wind risk 1/10 · Minimal
- Chance of severe wind over 30 yrs
- —
Air-quality risk 4/10 · Minor
- Unhealthy air days now
- 4 days/yr
- Unhealthy air days in 30 yrs
- 9 days/yr
Risk factors via First Street. Map © Google.
Why this score? — see what drove the C- grade
The composite is a weighted blend of 9 inputs, each scored 0–100. Each bar is that input's sub-score; the figure is the points it added to the 100-point composite (weight × sub-score).
- Cash flow +16.6/30.0
- ARV discount +9.6/15.0
- DSCR +5.2/10.0
- 1% rule +4.5/10.0
- Rent growth +4.5/5.0
- Livability +3.9/5.0
- Schools +3.3/10.0
- Condition / age +2.5/5.0
- Appreciation +0.0/10.0
$159,000
🖨 Deal sheet (PDF) 📄 Offer letter ✓ Due diligence
Listing remarks MLS
Newly lowered price! Bring back the charm of the original details in this solid 4BR 1bath with finished attic in convenient Riverside location on a quiet neighborhood street with off street parking. Details including woodwork and doors (see the pocket door picture, easy fix to close fully). Offers many replacement windows. Front porch has an open area for rocking chair as well as enclosed for evening visits and board/card games, and that finished attic provides great additional space! (not legal BRs). Tile looking wall section in the living room is not real tile but imitation tile - plastic stick down; seems easily removable (see pix). Side entrance door needs repair or replacing. Electric is on; plumbing and heating will be turned on for appraisal or if necessary. Owner long distant so not planning to do any additional repairs. Perennial flowers are popping up, grab this before they bloom! Fielding all offers as they come in. Has the bones, needs some love.
Key facts
- Off street parking
- Original details
- Perennial flowers
Tags
Neighborhood map
What this means for you Summary
Snapshot
- This is a 4-bed/1.0-bath single-family listed at $159k.
Deal economics
- At list price, monthly cash flow is $97 ($1k/yr) — positive.
- The deal already cash-flows at list — no discount required.
- To meet the 1% rule (rent ≥ 1% of price), the offer needs to be $151k (4.8% below list).
- Recommended offer: $145k (9.0% below list) — sets the bar for market timing.
Location & tenants
- Location reads 77/100 on livability (#195 in NY, #3,011 nationally) — a middle-class / working-renter tenant base. Strengths: commute A+, housing A+, health & safety A+; Watch: crime F, employment D-.
- Buffalo City School District (urban): math 41% / reading 40% proficiency, ranked #535 of 590 in NY (top 91%) — families likely to look elsewhere, expect single-tenant / working-renter base with shorter leases; 75% free/reduced lunch — lower-income household profile, screen leases tightly.
- Zoned schools: International School (math 8% / reading 17%, grade F, #2,048 of 2,108 statewide, top 97%, 981 students, 92% FRL); Hutchinson Central Technical High School (math 96% / reading 32%, grade B-, #807 of 1,100 statewide, top 73%, 1,175 students, 78% FRL).
- Market conditions: Rents rising fast (+8.2%/yr); 199 active listings in the ZIP; 8 comparable units currently listed for rent nearby; rentals at typical pace (median 24d on market — plan ~3-4 weeks tenant-placement turnaround); lower-income renter base — watch delinquency; 1,244 units permitted in Erie County in 2024 (563 in 5+ unit buildings).
- At $1,514/mo this rent would consume 46% of the median local household income ($40k/yr) (locally 2177% of renters already pay >50% of income on rent) — very limited rent-growth headroom before tenants either downsize or default.
Forward outlook
- Local home prices are declining (-3.0%/yr); year-one equity from $1k of loan paydown is wiped out by about $5k of value loss. Plan a longer hold.
- At projected returns (-3.0% appreciation + 8.0% rent growth), your $45k cash investment doubles in ~10 years — after that, you're playing with house money.
Negotiation context
- It's been on market 95 days — a 9% lower offer ($145k) is reasonable based on typical stale-listing flexibility.
- 3 sale attempts since 10y ago; this cycle's ask has dropped $16k (9%) from the opening price — seller is motivated, your offer sets the floor, not the list.
- Current owner paid $65k; list at $159k implies a 144% gain — meaningful room to come down on a strong offer.
Risks & watch-outs
- Watch-outs: built in 1915 — expect roof / HVAC / electrical / plumbing capex.
Questions for the listing agent
- It's been on market 95 days. Have you received any prior offers? Is the seller open to a 9% concession, seller financing, or rate buy-down credit?
- Built in 1915 — when were the roof, HVAC, electrical panel, plumbing, and water heater last replaced?
- Why hasn't it sold? Are there any deal-killer items the seller is aware of (foundation, flood, title, zoning, code violations)?
- Is there a deadline driving the sale (1031 exchange, divorce, estate, relocation)? That informs how much negotiation room exists.
- Crime grade is F in this area — have there been break-ins, vandalism, or insurance claims at this property in the last 3 years? What carrier currently insures it and at what premium?
- What's the average days-on-market for RENTAL listings here right now (not sales)? A rising rental-DOM trend means longer vacancies and softer asking-rent achievability than the comps imply.
- What's the recent tenant-quality profile in this submarket — average credit score on applications, eviction rate, late-payment / NSF rate, and stable-employment percentage? A property-management company in the area should have these aggregated.
- How much new for-sale + rental construction is in the pipeline within 1–3 miles? Heavy new supply typically softens prices + rents 12–24 months out; constrained supply supports both.
Investment metrics
- 1% rule
- 0.95% ✗
- Cap rate
- 7.03%
- Cash-on-cash
- 2.62%
- DSCR
- 1.12
- GRM
- 8.8
CMA / ARV
- ARV (median comp)
- $166,852
- List price
- $159,000
- Delta
- -4.71%
- Verdict
- FAIR
- Comps
- 20 within 1.0 mi
Show comp detail 12 sales within ~0.75 mi
| Address | Dist | Beds/Ba | Sqft | Sold | Price | $/sf | Match |
|---|---|---|---|---|---|---|---|
| 476 East St | 0.04mi | 4/2.0 | 1,618 (+2%) | 6mo | $100,000 | $62 | 85 |
| 350 East St | 0.21mi | 4/1.0 | 1,752 (+11%) | 3mo | $110,000 | $63 | 70 |
| 111 Gorton St | 0.45mi | 4/1.0 | 1,508 (-5%) | 6mo | $164,900 | $109 | 66 |
| 44 Gallatin Ave | 0.48mi | 4/2.0 | 1,532 (-3%) | 5mo | $149,000 | $97 | 64 |
| 38 Heward Ave | 0.42mi | 3/1.5 (-1) | 1,474 (-7%) | 1mo | $256,000 | $174 | 61 |
| 116 Pacific St | 0.28mi | 5/1.0 (+1) | 1,404 (-11%) | 7mo | $106,000 | $75 | 57 |
| 5 Copeland Pl | 0.43mi | 4/1.0 | 1,780 (+12%) | 7mo | $70,000 | $39 | 54 |
| 61 Mayer Ave | 0.50mi | 4/1.0 | 1,408 (-11%) | 7mo | $210,000 | $149 | 52 |
| 246 Amherst St | 0.71mi | 3/2.0 (-1) | 1,628 (+3%) | 2mo | $85,500 | $53 | 51 |
| 54 Gorton St | 0.55mi | 3/1.0 (-1) | 1,439 (-9%) | 6mo | $155,000 | $108 | 49 |
| 136 Crowley Ave | 0.72mi | 4/1.0 | 1,394 (-12%) | 2mo | $100,000 | $72 | 45 |
| 62 Kail St | 0.63mi | 4/2.0 | 1,757 (+11%) | 7mo | $65,000 | $37 | 43 |
Match score weights: distance 35% · size 25% · config 20% · recency 20%. Top-matched comps best support the ARV.
Projected returns pro-forma
-3.0% appreciation · 8.0% rent growth · sell at horizon
- IRR
- -6.7%
- Equity multiple
- 0.74×
- Total profit
- $-11,551
- Equity at exit
- $23,707
- IRR
- 8.3%
- Equity multiple
- 1.77×
- Total profit
- $34,420
- Equity at exit
- $13,747
Cash invested: $44,520 (down + closing). Projections, not guarantees.
Landlord ↔ Tenant lean methodology
- Overall (STATE)
- 15 Strongly Tenant-Friendly
- State New York
- 15 Strongly Tenant-Friendly · D+10
- County
- — inherits STATE
- City
- — inherits STATE
ZIP-level market 14207
- Home prices YoY
- -18.9%
- Rents YoY
- 8.2%
- Active inventory
- 199
- Price-to-rent
- 8.8×
Monthly cashflow live
- Estimated rent
- $1,514 high interval (Pro) →
- Mortgage (P&I)
- −$834
- Tax est. 1.5%
- −$199 /mo · $2,385/yr
- Insurance
- −$66
- HOA
- −$0
- Lot rent
- −$0
- Vacancy / Maint / Mgmt
- −$318
- Net cashflow
- $97
Break-even live
Sensitivity live
| Price | -10% $207 | -5% $152 | +0% $97 | +5% $42 | +10% $-13 |
|---|---|---|---|---|---|
| Rent | -10% $-22 | -5% $37 | +0% $97 | +5% $157 | +10% $217 |
| Rate | -1.0pp $177 | -0.5pp $138 | base $97 | +0.5pp $56 | +1.0pp $14 |
UW: 25.0% down · 7.5% · 30yr · 1.5% tax · 5.0% vac · 8.0% maint · 8.0% mgmt
Financing live
Cash to close
- Down payment
- $39,750
- Closing costs
- $4,770
- Reserves months
- —
- Total cash needed
- —
Loan-product check · same deal, 3 products live
Conventional
25% down · 7.5% · 30yr
- Down + closing
- —
- Monthly P&I
- —
- Monthly cashflow
- —
- DSCR
- —
- Eligible?
- —
Personal DTI + credit; lowest rate.
DSCR
20% down · 8.5% · 30yr
- Down + closing
- —
- Monthly P&I
- —
- Monthly cashflow
- —
- DSCR
- —
- Eligible?
- —
No personal income docs; deal must DSCR.
Hard money
10% down · 12.0% · 12mo
- Down + closing
- —
- Monthly P&I
- —
- Monthly cashflow
- —
- DSCR
- —
- Eligible?
- —
Short-term bridge; refi at stabilization.
Rent comps 8 comps
| Address | Beds | Baths | Sqft | Rent | $/sqft | DOM | Units | Dist |
|---|---|---|---|---|---|---|---|---|
| 118 Rano St Buffalo, NY | 3.0 | 1.0 | 1050 | $1,200 | $1.14 | 23d | 1 | 0.44mi |
| 158 Chadduck Ave Buffalo, NY | 4.0 | 1.0 | 1200 | $1,250 | $1.04 | 26d | 1 | 0.85mi |
| 78 Germain St Buffalo, NY | 3.0 | 1.0 | 2030 | $1,300 | $0.64 | 16d | 1 | 0.86mi |
| 62 Germain St Buffalo, NY | 3.0 | 1.0 | 1320 | $1,250 | $0.95 | 26d | 1 | 0.89mi |
| 61 Baxter St Buffalo, NY | 3.0 | 1.0 | 2014 | $1,400 | $0.70 | 0d | 1 | 0.99mi |
| 509 Hinman Ave Unit Upper Buffalo, NY | 3.0 | 1.0 | 1600 | $1,325 | $0.83 | 0d | 1 | 1.21mi |
| 62 Seabrook St Buffalo, NY | 4.0 | 1.0 | 1300 | $2,000 | $1.54 | 4d | 1 | 1.42mi |
| 139 Fordham Dr Buffalo, NY | 3.0 | 1.0 | 1453 | $1,700 | $1.17 | 26d | 1 | 1.43mi |
Listing history 25 events
-
2026-06-22days on market $159,000 Active 95 DOM
-
2026-06-21days on market $159,000 Active 94 DOM
-
2026-06-18days on market $159,000 Active 91 DOM
-
2026-06-17pricedays on market $159,000 Active 90 DOM
-
2026-06-16days on market $169,000 Active 89 DOM
-
2026-06-15days on market $169,000 Active 88 DOM
-
2026-06-13days on market $169,000 Active 86 DOM
-
2026-06-13days on market $169,000 Active 85 DOM
-
2026-06-10days on market $169,000 Active 83 DOM
-
2026-06-09days on market $169,000 Active 82 DOM
-
2026-06-08days on market $169,000 Active 81 DOM
-
2026-06-07days on market $169,000 Active 80 DOM
-
2026-06-03days on market $169,000 Active 76 DOM
-
2026-06-02days on market $169,000 Active 75 DOM
-
2026-06-01days on market $169,000 Active 74 DOM
-
2026-05-31days on market $169,000 Active 73 DOM
-
2026-04-08price $169,000 972-char remark
Show marketing remark (972 chars)
Newly lowered price! Bring back the charm of the original details in this solid 4BR 1bath with finished attic in convenient Riverside location on a quiet neighborhood street with off street parking. Details including woodwork and doors (see the pocket door picture, easy fix to close fully). Offers many replacement windows. Front porch has an open area for rocking chair as well as enclosed for evening visits and board/card games, and that finished attic provides great additional space! (not legal BRs). Tile looking wall section in the living room is not real tile but imitation tile - plastic stick down; seems easily removable (see pix). Side entrance door needs repair or replacing. Electric is on; plumbing and heating will be turned on for appraisal or if necessary. Owner long distant so not planning to do any additional repairs. Perennial flowers are popping up, grab this before they bloom! Fielding all offers as they come in. Has the bones, needs some love.
-
2026-03-19$175,000 Active 972-char remark
Show marketing remark (972 chars)
Newly lowered price! Bring back the charm of the original details in this solid 4BR 1bath with finished attic in convenient Riverside location on a quiet neighborhood street with off street parking. Details including woodwork and doors (see the pocket door picture, easy fix to close fully). Offers many replacement windows. Front porch has an open area for rocking chair as well as enclosed for evening visits and board/card games, and that finished attic provides great additional space! (not legal BRs). Tile looking wall section in the living room is not real tile but imitation tile - plastic stick down; seems easily removable (see pix). Side entrance door needs repair or replacing. Electric is on; plumbing and heating will be turned on for appraisal or if necessary. Owner long distant so not planning to do any additional repairs. Perennial flowers are popping up, grab this before they bloom! Fielding all offers as they come in. Has the bones, needs some love.
-
2026-02-28historical
-
2025-08-27$175,000 Active
-
2016-12-02soldstatus $65,100
-
2016-12-01soldstatus $65,000 Closed Sale or Rented
-
2016-10-28status Pending Sale
-
2016-10-03historical Under Contract- Do Not Show
-
2016-09-29$59,900 Active
ⓘ Source: listings_history table (triggers on properties + properties_extension) + one-shot
backfill from property_details.listing_events for pre-trigger history.
Climate risk First Street
- Flood 1/10 Low FEMA zone X (unshaded) · 0% chance over 30 yrs
- Wildfire 1/10 Low
- Heat 3/10 Moderate 7 d/yr ≥93°F today · 15 d/yr by 30 yrs out
- Wind 1/10 Low
- Air quality 4/10 Moderate 4 unhealthy d/yr today · 9 by 30 yrs out
Nearby sold comps map
Loading sold comps map…
Walkable amenities ~0.75 mi
Loading nearby amenities…
Taxation est. · year 1
- Rental income
- $18,167
- − Mortgage interest
- −$8,906
- − Property taxes
- −$2,385
- − Insurance
- −$795
- − Repairs & maintenance
- −$1,453
- − Management
- −$1,453
- − Depreciation
- −$4,625
- Taxable loss
- −$1,452
- Est. tax savings @ 24.0%
- +$348
- After-tax cash flow
- $1,515/yr
For passive investors: Depreciation is non-cash, so a rental often shows a tax loss while cash-flowing — sheltering income. Rental losses are passive: they offset passive income freely, and up to $25,000/yr can offset ordinary (W-2) income if you actively participate and your MAGI is under $100k (phasing out to $0 by $150k); unused losses carry forward. On sale, claimed depreciation is recaptured at up to 25%, and gains may owe capital-gains tax (a 1031 exchange can defer both). Figures are a year-1 estimate at your 24.0% rate — not tax advice; consult a CPA.
Schools (NCES district)
- District
- Buffalo City School District
- NCES district ID
- 3605850
- Math proficiency
- 41% ▲ 11.00%
- Reading proficiency
- 40% ▲ 7.00%
- Median HH income
- $31,665
- Composite
- 33.17/100
- National rank
- #5544
- State rank
- #535 of 590 in NY
Livability — Buffalo
- Score
- 77/100
- State rank
- #195
- US rank
- #3011
Category grades
Schools grade is shown separately in the Schools card above.
Census & demographics
- Census place
- Buffalo, NY
- County
- Erie County · 714,559 people
- City population
- 440,021
- Metro
- Buffalo-Cheektowaga, NY
- Population (ZIP)
- 26,327
- Household income
- $39,753
- Rent vs Own
- Severe rent burden
- 2177.0
Population outlook (Erie County) Hauer SSP2
- Today (2025)
- 933,037 people
- By 2030
- 935,181 · +0.2%
- By 2040
- 928,531 · -0.5%
- By 2050
- 905,725 · -2.9%
- By 2075
- 834,037 · -10.6%
- By 2100
- 708,033 · -24.1%
Race, ethnicity, and origin ACS 2023
- Neighborhood character
- Highly diverse neighborhood (Simpson 0.74)
- Race & ethnicity
- White 40% Hispanic / Latino 23% Black 16% Asian 15% Two or more races 14%
- Hispanic origin (detail)
- Puerto Rican 18% Dominican 2%
- Common ancestry
- Romanian 8% Portuguese 1% Arab 1%
- Foreign-born
- 19% · Philippines, Canada, India
- Languages at home
- 65% English-only · Spanish 14% Other Asian/Pacific 10% Other Indo-European 5%
Political lean MEDSL · Erie
- 2024 margin
- Lean D (+9.7) · D 54.8% · R 45.2%
- 2008→2024 swing
- -7.9pp toward R · 2008: 17.5pp · 2024: 9.7pp
- All cycles
- 2024: D+9.7 2020: D+14.7 2016: D+4.8 2012: D+15.6 2008: D+17.5
Not yet ingested
- Civics
- —
Market trends
- HPI YoY
- ▼ -54.42%
- Current HPI
- 233.0902
- Rent YoY
- ▲ 8.19%
- Metro
- Buffalo-Cheektowaga, NY
- State GDP YoY
- ▲ 2.60%
- F500 in state
- 92
Industry mix (Fortune 500 HQ in NY)
| Industry | F500 HQs | Revenue |
|---|---|---|
| Financial Services | 10 | $950B |
|
||
| Consumer Goods | 9 | $162B |
|
||
| Insurance | 4 | $225B |
|
||
| Telecommunications | 2 | $144B |
|
||
| Pharmaceuticals | 2 | $112B |
|
||
| Media / Entertainment | 2 | $69B |
|
||
Price history
+182.1% since first listed9 events — show timeline
- 2026-04-08 Price Changed $169,000 WNYREIS
- 2026-03-19 Listed $175,000 WNYREIS
- 2026-02-28 Listing Removed — WNYREIS
- 2025-08-27 Listed $175,000 WNYREIS
- 2016-12-02 Sold (Public Records) $65,100 Public Records
- 2016-12-01 Sold (MLS) $65,000 WNYREIS
- 2016-10-28 Pending — WNYREIS
- 2016-10-03 Contingent — WNYREIS
- 2016-09-29 Listed $59,900 WNYREIS
Property tax history
+4.4%/yrLatest (2025): $235 · +0.0% YoY. Source: county tax records.
Cash-flow waterfall
monthlySold comps — $/sqft
last 12 mo · ≤1 miLoading sold comps…