 Multi-family
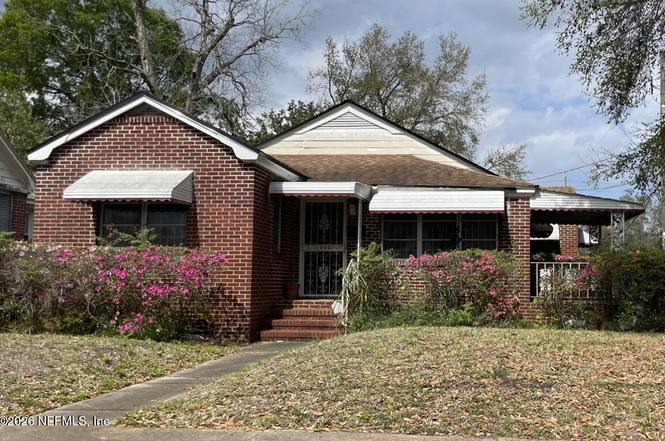
1203 McConihe St · Jacksonville, FL
Flood risk 3/10 · Minor
- FEMA flood zone
- X (unshaded)
- Chance of flooding over 30 yrs
- 0.2%
- Est. flood insurance / yr
- $507 – $1,088
Fire risk 1/10 · Minimal
- Est. fire insurance / yr
- $947 – $1,759
Heat risk 9/10 · Severe
- Hot days now (above 107°F)
- 7 days/yr
- Hot days in 30 yrs
- 20 days/yr
Wind risk 9/10 · Severe
- Chance of severe wind over 30 yrs
- 99.0%
Air-quality risk 5/10 · Moderate
- Unhealthy air days now
- 7 days/yr
- Unhealthy air days in 30 yrs
- 7 days/yr
Risk factors via First Street. Map © Google.
Why this score? — see what drove the D+ grade
The composite is a weighted blend of 9 inputs, each scored 0–100. Each bar is that input's sub-score; the figure is the points it added to the 100-point composite (weight × sub-score).
- Cash flow +13.3/30.0
- ARV discount +10.4/15.0
- Livability +4.2/5.0
- 1% rule +4.0/10.0
- DSCR +4.0/10.0
- Schools +3.9/10.0
- Rent growth +3.0/5.0
- Condition / age +2.5/5.0
- Appreciation +0.0/10.0
$143,000
🖨 Deal sheet (PDF) 📄 Offer letter ✓ Due diligence
Multi-family units
County records classify this as Multi-Family (5+ Unit). Listing-text estimate: 1 unit. estimate disagrees with records
5+ unit building — per-unit beds/baths from public records are typically unavailable; the breakdown below (if shown) is an estimate from the listing text.
Listing remarks MLS
The main home has 3 bedrooms and 1 bath and hardwood flooring throughout. The detached garage has an upstairs apartment with 1 bedroom, a kitchen and living space. The downstairs has a bathroom and kitchen with a small living area. Both are being sold as-is with no repairs. Must make an appointment to see.
Key facts
- Separate entrance
- Formal dining room
- Central heat and air
Tags
Property features AI
Finance
- HOA & community: Not a senior community
Exterior
- Parking: On-street parking
- Security: Leased security system
- Utilities: Public sewer; Water connected; Sewer connected; Electricity connected; Cable available
- Home design: Single-family residence; One level; Home faces south
- Construction: Brick construction; Shingle roof
- Exterior features: Corner lot in a historic area; Front porch, side porch and additional porch; Awnings
Interior
- Kitchen: Electric cooktop; Electric oven; Electric range; Microwave; Refrigerator; Electric water heater
- Bedrooms: 3 bedrooms (all on the main level)
- Flooring: Wood flooring
- Bathrooms: 1 full bathroom
- Heating & cooling: Central heating; Central air conditioning
- Interior features: Ceiling fans; Eat-in kitchen; Entrance foyer; 10 total rooms; Unfurnished
- Laundry & utility: In-unit laundry with washer and electric dryer hookups; Laundry located in bonus room with exterior entrance
Neighborhood map
What this means for you Summary
Snapshot
- This is a 3-bed/1.0-bath multifamily listed at $143k.
Deal economics
- At list price, monthly cash flow is $1 ($12/yr) — positive.
- The deal already cash-flows at list — no discount required.
- To meet the 1% rule (rent ≥ 1% of price), the offer needs to be $129k (9.5% below list).
- Recommended offer: $129k (9.5% below list) — sets the bar for 1% rule.
- Cap rate 6.3% vs local median 3.9% in Jacksonville — top-decile yield for the area; either an underpriced asset or a hidden risk that comps aren't pricing in. Stress-test before assuming the spread holds.
Location & tenants
- Location reads 83/100 on livability (#50 in FL, #911 nationally) — a professional / high-income tenant draw. Strengths: amenities A+, commute A+, housing A+.
- Duval (urban): math 46% / reading 45% proficiency, ranked #48 of 73 in FL (top 66%) — families likely to look elsewhere, expect single-tenant / working-renter base with shorter leases.
- Zoned schools: John E. Ford K-8 School (math 31% / reading 36%, grade F, #1,758 of 2,144 statewide, top 83%, 622 students, 58% FRL); Lake Shore Middle School (math 25% / reading 22%, grade F, #536 of 571 statewide, top 95%, 972 students, 75% FRL); William M. Raines High School (math 14% / reading 13%, grade F, #616 of 667 statewide, top 92%, 1,217 students, 78% FRL) — zoned schools average 70% FRL vs 49% district-wide (21 pts higher); higher-poverty schools than district average — tighter screening recommended.
- Zoned-school proficiency averages 24% at this address vs 46% district-wide (-22 pts) — the specific schools serving this property underperform the Duval average; the district grade overstates school quality for this exact location.
- Market conditions: Rents rising (+1.8%/yr); 399 active listings in the ZIP; 40 comparable units currently listed for rent nearby; rentals at typical pace (median 24d on market — plan ~3-4 weeks tenant-placement turnaround); lower-income renter base — watch delinquency; 6,503 units permitted in Duval County in 2024 (1,131 in 5+ unit buildings).
- At $1,294/mo this rent would consume 51% of the median local household income ($31k/yr) (locally 2921% of renters already pay >50% of income on rent) — very limited rent-growth headroom before tenants either downsize or default.
Forward outlook
- Local home prices are declining (-3.0%/yr); year-one equity from $989 of loan paydown is wiped out by about $4k of value loss. Plan a longer hold.
- Duval County population projected at +19% by 2050 — long-run rental-demand tailwind backs the buy-and-hold thesis.
Negotiation context
- Only 4 days on market — expect competitive offers; lowballing is unlikely to land.
- 2 sale attempts since 3y ago with the ask held roughly flat each time — persistent listings suggest the price (not the market) is what's stuck; bring a comps-based counter.
Risks & watch-outs
- Watch-outs: built in 1939 — expect roof / HVAC / electrical / plumbing capex.
- Climate carrying-cost: severe wind risk, 99% chance of damaging wind over 30y; extreme-heat days projected 7→20/yr by 2055 (HVAC capex compounding) — expect insurance premiums to compound above CPI over the hold.
Questions for the listing agent
- Built in 1939 — when were the roof, HVAC, electrical panel, plumbing, and water heater last replaced?
- Is there a deadline driving the sale (1031 exchange, divorce, estate, relocation)? That informs how much negotiation room exists.
- Schools are B-rated — typically a magnet for longer-tenancy family renters. What's the average tenant stay here, and is there a school-zone premium baked into asking?
- The area grade is low — what's the realistic commute time and amenity access for the typical tenant pool here? Any planned neighborhood developments (good or bad) we should know about?
- What's the average days-on-market for RENTAL listings here right now (not sales)? A rising rental-DOM trend means longer vacancies and softer asking-rent achievability than the comps imply.
- What's the recent tenant-quality profile in this submarket — average credit score on applications, eviction rate, late-payment / NSF rate, and stable-employment percentage? A property-management company in the area should have these aggregated.
- How much new apartment / multifamily construction is in the pipeline within 1–3 miles? Heavy new supply (>2% of stock underway) typically softens rents 12–24 months out; light construction supports rent growth.
Investment metrics
- 1% rule
- 0.90% ✗
- Cap rate
- 6.30%
- Cash-on-cash
- 0.03%
- DSCR
- 1.00
- GRM
- 9.2
CMA / ARV
- ARV (on-the-fly)
- $153,002
- Comps found
- 5
Show comp detail 5 sales within ~0.75 mi
| Address | Dist | Beds/Ba | Sqft | Sold | Price | $/sf | Match |
|---|---|---|---|---|---|---|---|
| 1431-1433 McConihe St | 0.31mi | 4/2.0 (+1) | 1,352 (-0%) | 6mo | $60,280 | $45 | 72 |
| 1538 Ella St | 0.48mi | 4/2.0 (+1) | 1,344 (-1%) | 8mo | $170,000 | $126 | 61 |
| 1544 Ella St | 0.48mi | 4/2.0 (+1) | 1,344 (-1%) | 18mo | $190,000 | $141 | 53 |
| 1417 Logan St | 0.72mi | 4/2.0 (+1) | 1,500 (+11%) | 9mo | $170,000 | $113 | 32 |
| 1421 Logan St | 0.73mi | 4/2.0 (+1) | 1,500 (+11%) | 9mo | $170,000 | $113 | 31 |
Match score weights: distance 35% · size 25% · config 20% · recency 20%. Top-matched comps best support the ARV.
Projected returns pro-forma
-3.0% appreciation · 1.81% rent growth · sell at horizon
- IRR
- -17.6%
- Equity multiple
- 0.39×
- Total profit
- $-24,601
- Equity at exit
- $21,322
- IRR
- -12.2%
- Equity multiple
- 0.32×
- Total profit
- $-27,314
- Equity at exit
- $12,364
Cash invested: $40,040 (down + closing). Projections, not guarantees.
Landlord ↔ Tenant lean methodology
- Overall (STATE)
- 87 Strongly Landlord-Friendly
- State Florida
- 87 Strongly Landlord-Friendly · R+3
- County
- — inherits STATE
- City
- — inherits STATE
ZIP-level market 32209
- Home prices YoY
- -22.1%
- Rents YoY
- 1.8%
- Active inventory
- 399
- Price-to-rent
- 9.2×
Monthly cashflow live
- Estimated rent
- $1,294 high interval (Pro) →
- Mortgage (P&I)
- −$750
- Tax from tax record
- −$212 /mo · $2,541/yr
- Insurance
- −$60
- HOA
- −$0
- Vacancy / Maint / Mgmt
- −$272
- Net cashflow
- $1
Break-even live
Sensitivity live
| Price | -10% $82 | -5% $41 | +0% $1 | +5% $-39 | +10% $-80 |
|---|---|---|---|---|---|
| Rent | -10% $-101 | -5% $-50 | +0% $1 | +5% $52 | +10% $103 |
| Rate | -1.0pp $73 | -0.5pp $37 | base $1 | +0.5pp $-36 | +1.0pp $-74 |
UW: 25.0% down · 7.5% · 30yr · 1.5% tax · 5.0% vac · 8.0% maint · 8.0% mgmt
Financing live
Cash to close
- Down payment
- $35,750
- Closing costs
- $4,290
- Reserves months
- —
- Total cash needed
- —
Loan-product check · same deal, 3 products live
Conventional
25% down · 7.5% · 30yr
- Down + closing
- —
- Monthly P&I
- —
- Monthly cashflow
- —
- DSCR
- —
- Eligible?
- —
Personal DTI + credit; lowest rate.
DSCR
20% down · 8.5% · 30yr
- Down + closing
- —
- Monthly P&I
- —
- Monthly cashflow
- —
- DSCR
- —
- Eligible?
- —
No personal income docs; deal must DSCR.
Hard money
10% down · 12.0% · 12mo
- Down + closing
- —
- Monthly P&I
- —
- Monthly cashflow
- —
- DSCR
- —
- Eligible?
- —
Short-term bridge; refi at stabilization.
Rent comps 40 comps
| Address | Beds | Baths | Sqft | Rent | $/sqft | DOM | Units | Dist |
|---|---|---|---|---|---|---|---|---|
| 1131 Grothe St Unit 3 Jacksonville, FL | 3.0 | 2.0 | 1580 | $1,395 | $0.88 | 0d | 1 | 0.28mi |
| 1464 N Myrtle Ave Jacksonville, FL | 2.0 | 1.0 | 1136 | $1,400 | $1.23 | 25d | 1 | 0.33mi |
| 1454 Francis St Jacksonville, FL | 3.0 | 2.0 | 1084 | $1,243 | $1.15 | 25d | 1 | 0.33mi |
| 1355 Grothe St Jacksonville, FL | 4.0 | 1.0 | 1312 | $1,350 | $1.03 | 19d | 1 | 0.37mi |
| 2324 Moncrief Rd Jacksonville, FL | 2.0 | 1.0 | 900 | $875 | $0.97 | 0d | 1 | 0.38mi |
| 2324 Moncrief Rd Unit 2324 Jacksonville, FL | 2.0 | 1.0 | 900 | $900 | $1.00 | 25d | 1 | 0.38mi |
| 2313 Janette St Jacksonville, FL | 4.0 | 2.0 | 1148 | $1,349 | $1.18 | 18d | 1 | 0.38mi |
| 1619 Whitner St Jacksonville, FL | 3.0 | 2.0 | 1547 | $1,150 | $0.74 | 4d | 1 | 0.43mi |
| 1478 W 5th St Jacksonville, FL | 3.0 | 1.0 | 960 | $1,225 | $1.28 | 6d | 1 | 0.45mi |
| 1478 W 5th St Jacksonville, FL | 3.0 | 1.0 | 960 | $1,225 | $1.28 | 25d | 1 | 0.45mi |
| 1320 Francis St Jacksonville, FL | 2.0 | 2.0 | 1003 | $1,095 | $1.09 | 25d | 1 | 0.46mi |
| 1537 W 7th St Jacksonville, FL | 3.0 | 1.0 | 950 | $1,050 | $1.11 | 9d | 1 | 0.47mi |
| 1537 7th St W Unit B Jacksonville, FL | 3.0 | 1.0 | 950 | $1,050 | $1.11 | 25d | 1 | 0.47mi |
| 1358 Prince St Jacksonville, FL | 3.0 | 2.5 | 1044 | $1,350 | $1.29 | 25d | 1 | 0.52mi |
| 1358 Prince St Jacksonville, FL | 3.0 | 3.5 | 1044 | $1,350 | $1.29 | 23d | 1 | 0.52mi |
| 2904 Moncrief Rd Jacksonville, FL | 3.0 | 1.0 | 952 | $1,100 | $1.16 | 25d | 1 | 0.56mi |
| 1525 W 15th St Jacksonville, FL | 3.0 | 1.0 | 1100 | $1,245 | $1.13 | 25d | 1 | 0.62mi |
| 1410 W 20th St Jacksonville, FL | 3.0 | 2.0 | 1170 | $1,431 | $1.22 | 0d | 1 | 0.68mi |
| 1359 W 20th St Jacksonville, FL | 2.0 | 1.0 | 901 | $1,134 | $1.26 | 19d | 1 | 0.68mi |
| 1640 W 4th St Unit 1 Jacksonville, FL | 4.0 | 2.0 | 1119 | $1,675 | $1.50 | 22d | 1 | 0.70mi |
| 2817 Mars Ave Jacksonville, FL | 2.0 | 1.0 | 945 | $975 | $1.03 | 23d | 1 | 0.72mi |
| 1740 W 9th St Jacksonville, FL | 4.0 | 2.0 | 1148 | $1,285 | $1.12 | 22d | 1 | 0.73mi |
| 1185 W 22nd St Unit U Jacksonville, FL | 2.0 | 1.0 | 900 | $850 | $0.94 | 9d | 1 | 0.74mi |
| 1470 Windle St Jacksonville, FL | 3.0 | 2.0 | 1170 | $1,425 | $1.22 | 16d | 1 | 0.76mi |
| 1431 W 21st St Jacksonville, FL | 3.0 | 2.0 | 1199 | $1,425 | $1.19 | 16d | 1 | 0.76mi |
| 1448 Union St W Jacksonville, FL | 3.0 | 1.0 | 958 | $1,200 | $1.25 | 25d | 1 | 0.76mi |
| 1018 W 23rd St Jacksonville, FL | 3.0 | 2.5 | 1161 | $1,600 | $1.38 | 25d | 1 | 0.79mi |
| 503 W 16th St Jacksonville, FL | 4.0 | 1.5 | 1216 | $1,420 | $1.17 | 25d | 1 | 0.82mi |
| 1710 W 2nd St Unit A Jacksonville, FL | 2.0 | 1.0 | 939 | $800 | $0.85 | 25d | 1 | 0.84mi |
| 1788 W 5th St Jacksonville, FL | 3.0 | 2.0 | 948 | $1,295 | $1.37 | 25d | 1 | 0.84mi |
| 1539 Union St W Jacksonville, FL | 3.0 | 1.5 | 1000 | $1,144 | $1.14 | 15d | 1 | 0.85mi |
| 1545 Union St W Jacksonville, FL | 3.0 | 2.0 | 1253 | $1,400 | $1.12 | 5d | 1 | 0.86mi |
| 2306 Fairfax St Unit 1 Jacksonville, FL | 3.0 | 1.0 | 900 | $700 | $0.78 | 25d | 1 | 0.86mi |
| 1781 W 3rd St Jacksonville, FL | 4.0 | 2.0 | 1632 | $650 | $0.40 | 25d | 1 | 0.87mi |
| 519 W 19th St Jacksonville, FL | 2.0 | 2.0 | 1071 | $1,095 | $1.02 | 23d | 1 | 0.91mi |
| 519 W 19th St Jacksonville, FL | 2.0 | 2.0 | 1071 | $1,075 | $1.00 | 6d | 1 | 0.91mi |
| 519 W 19th St Unit a Jacksonville, FL | 2.0 | 1.5 | 1071 | $1,095 | $1.02 | 23d | 1 | 0.91mi |
| 519 W 19th St Unit a Jacksonville, FL | 2.0 | 1.5 | 1071 | $1,075 | $1.00 | 16d | 1 | 0.91mi |
| 1607 Logan St Jacksonville, FL | 4.0 | 2.0 | 1232 | $1,800 | $1.46 | 25d | 1 | 0.91mi |
| 231 W 10th St Jacksonville, FL | 3.0 | 1.0 | 1200 | $1,500 | $1.25 | 25d | 1 | 0.92mi |
Listing history 3 events
-
2026-06-21days on market $143,000 Active 4 DOM
-
2026-06-17remarks 679-char remark
-
2026-06-17$143,000 Active 1 DOM
ⓘ Source: listings_history table (triggers on properties + properties_extension) + one-shot
backfill from property_details.listing_events for pre-trigger history.
Tax reassessment forecast FL · Resets to sale price
- Current annual tax
- $2,541 · $212/mo
- Projected year-2 tax
- $2,541 · $212/mo
- Expected delta
- $0/yr ($0/mo · 0.0%)
ⓘ Screening estimate from a state-policy table — verify with the county assessor before closing.
Climate risk First Street
- Flood 3/10 Moderate FEMA zone X (unshaded) · 20% chance over 30 yrs
- Wildfire 1/10 Low
- Heat 9/10 Extreme 7 d/yr ≥107°F today · 20 d/yr by 30 yrs out
- Wind 9/10 Extreme 99% chance of damaging wind over 30 yrs
- Air quality 5/10 Major 7 unhealthy d/yr today · 7 by 30 yrs out
Nearby sold comps map
Loading sold comps map…
Walkable amenities ~0.75 mi
Loading nearby amenities…
Taxation est. · year 1
- Rental income
- $15,527
- − Mortgage interest
- −$8,010
- − Property taxes
- −$2,541
- − Insurance
- −$715
- − Repairs & maintenance
- −$1,242
- − Management
- −$1,242
- − Depreciation
- −$4,160
- Taxable loss
- −$2,383
- Est. tax savings @ 24.0%
- +$572
- After-tax cash flow
- $584/yr
For passive investors: Depreciation is non-cash, so a rental often shows a tax loss while cash-flowing — sheltering income. Rental losses are passive: they offset passive income freely, and up to $25,000/yr can offset ordinary (W-2) income if you actively participate and your MAGI is under $100k (phasing out to $0 by $150k); unused losses carry forward. On sale, claimed depreciation is recaptured at up to 25%, and gains may owe capital-gains tax (a 1031 exchange can defer both). Figures are a year-1 estimate at your 24.0% rate — not tax advice; consult a CPA.
Schools (NCES district)
- District
- Duval
- NCES district ID
- 1200480
- Math proficiency
- 46% ▼ -11.00%
- Reading proficiency
- 45% ▼ -4.00%
- Median HH income
- $48,987
- Composite
- 38.97/100
- National rank
- #4076
- State rank
- #48 of 73 in FL
Livability — Jacksonville
- Score
- 83/100
- State rank
- #50
- US rank
- #911
Category grades
Schools grade is shown separately in the Schools card above.
Census & demographics
- Census place
- Jacksonville, FL
- County
- Duval County · 1,015,274 people
- City population
- 979,034
- Metro
- Jacksonville, FL
- Population (ZIP)
- 34,657
- Household income
- $30,514
- Rent vs Own
- Severe rent burden
- 2921.0
Population outlook (Duval County) Hauer SSP2
- Today (2025)
- 1,013,010 people
- By 2030
- 1,059,228 · +4.6%
- By 2040
- 1,141,439 · +12.7%
- By 2050
- 1,205,258 · +19.0%
- By 2075
- 1,324,282 · +30.7%
- By 2100
- 1,319,620 · +30.3%
Race, ethnicity, and origin ACS 2023
- Neighborhood character
- Predominantly Black (88%)
- Race & ethnicity
- Black 88% White 5% Hispanic / Latino 5% Two or more races 2%
- Hispanic origin (detail)
- Puerto Rican 3%
- Common ancestry
- Hispanic 1% Romanian 1%
- Foreign-born
- 3% · Canada
- Languages at home
- 95% English-only · Spanish 4% French/Haitian/Cajun 1%
Political lean MEDSL · Duval
- 2024 margin
- Toss-up / Even · D 48.7% · R 50.1% · Other 1.2%
- 2008→2024 swing
- +0.4pp no change · 2008: -1.9pp · 2024: -1.5pp
- All cycles
- 2024: R+1.5 2020: D+3.8 2016: R+1.5 2012: R+3.6 2008: R+1.9
Not yet ingested
- Civics
- —
Market trends
- HPI YoY
- ▼ -53.92%
- Current HPI
- 189.5977
- Rent YoY
- ▲ 1.81%
- Metro
- Jacksonville, FL
- State GDP YoY
- ▲ 3.28%
- F500 in state
- 36
Industry mix (Fortune 500 HQ in FL)
| Industry | F500 HQs | Revenue |
|---|---|---|
| Industrial Technology | 2 | $29B |
|
||
| Insurance | 2 | $17B |
|
||
| Retail | 1 | $60B |
|
||
| Technology Distribution | 1 | $58B |
|
||
| Homebuilding | 1 | $35B |
|
||
| Technology Manufacturing | 1 | $35B |
|
||
Price history
-10.6% since first listed6 events — show timeline
- 2026-06-12 Listed $143,000 realMLS
- 2023-02-28 Sold (Public Records) $140,000 Public Records
- 2023-02-27 Sold (MLS) $140,000 realMLS
- 2023-01-27 Pending — realMLS
- 2023-01-16 Contingent — realMLS
- 2023-01-12 Listed $159,999 realMLS
Property tax history
+3.8%/yrLatest (2025): $2,541 · +21.1% YoY. Source: county tax records.
Cash-flow waterfall
monthlySold comps — $/sqft
last 12 mo · ≤1 miLoading sold comps…