 🌊 Lakefront
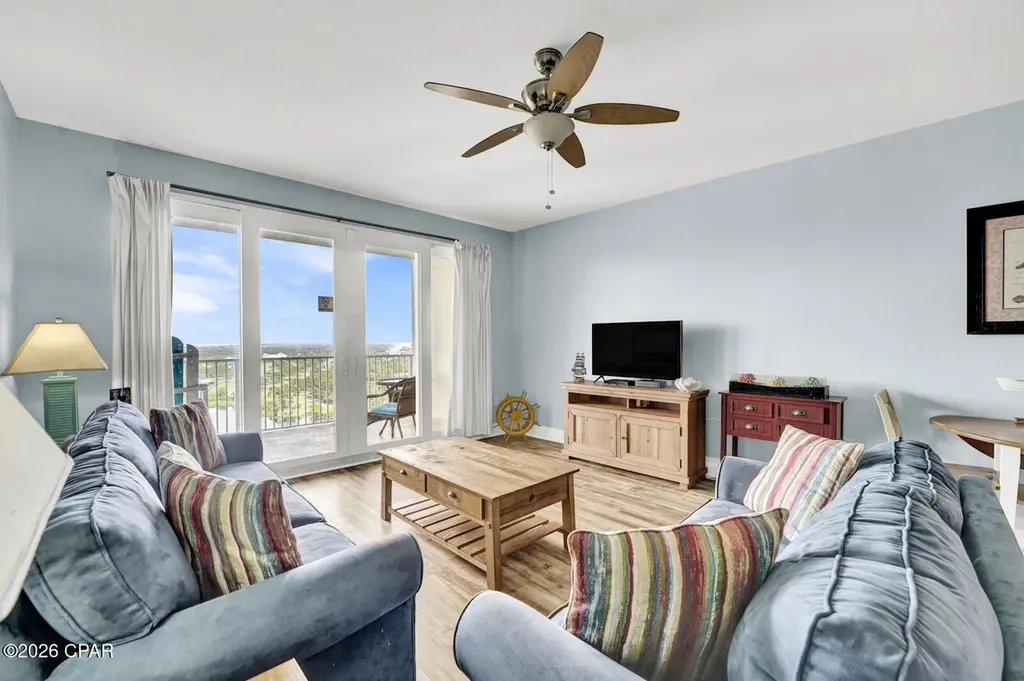
9902 S Thomas Dr #1832 · Panama City Beach, FL
Flood risk 7/10 · Major
- FEMA flood zone
- X (unshaded)
- Chance of flooding over 30 yrs
- 0.77%
- Est. flood insurance / yr
- $507 – $1,088
Fire risk 3/10 · Minor
- Est. fire insurance / yr
- $947 – $1,759
Heat risk 10/10 · Severe
- Hot days now (above 106°F)
- 7 days/yr
- Hot days in 30 yrs
- 21 days/yr
Wind risk 10/10 · Severe
- Chance of severe wind over 30 yrs
- 99.0%
Air-quality risk 1/10 · Minimal
- Unhealthy air days now
- 0 days/yr
- Unhealthy air days in 30 yrs
- 0 days/yr
Risk factors via First Street. Map © Google.
Why this score? — see what drove the D- grade
The composite is a weighted blend of 9 inputs, each scored 0–100. Each bar is that input's sub-score; the figure is the points it added to the 100-point composite (weight × sub-score).
- Cash flow +7.5/30.0
- ARV discount +7.5/15.0
- 1% rule +7.1/10.0
- Schools +4.3/10.0
- Livability +3.9/5.0
- Rent growth +3.1/5.0
- Condition / age +2.5/5.0
- DSCR +1.7/10.0
- Appreciation +0.0/10.0
$240,000
🖨 Deal sheet (PDF) 📄 Offer letter ✓ Due diligence
Listing remarks MLS
* Entered for comp purposes *
Key facts
- Lakeside boardwalk
- Covered parking
- 2 garage spots
Tags
Property features AI
Finance
- Other: All units furnished (multi-unit information)
- HOA & community: Has homeowners association; HOA amenities include game room and gated community access; Community features include elevator, fitness center, game room, pool, shopping, and short-term rentals allowed
Exterior
- Parking: Gated parking; 2-car garage
- Security: On-site security services; Security gate; 24-hour security; Security guard
- Utilities: Public sewer
- Home design: Resort zoning; Entry level 18
- Exterior features: Building security; Security gate; 24-hour security; Security guard; Security service; Community pool; Pool (community); Gated community
Interior
- Bedrooms: Bedroom (First level) — 12 x 11; Bedroom (First level) — 14 x 12
- Bathrooms: 2 full bathrooms
- Interior features: Has a view
Neighborhood map
What this means for you Summary
Snapshot
- This is a 3-bed/2.0-bath condo listed at $240k.
Deal economics
- At list price, monthly cash flow is $-361 ($-4k/yr) — negative.
- The deal already cash-flows at list — no discount required.
- Meets the 1% rule at list price ($3k rent vs $240k).
- Cap rate 4.8% vs local median 2.6% in Panama City Beach — top-decile yield for the area; either an underpriced asset or a hidden risk that comps aren't pricing in. Stress-test before assuming the spread holds.
Location & tenants
- Location reads 78/100 on livability (#172 in FL, #2,624 nationally) — a middle-class / working-renter tenant base. Strengths: crime A+, housing A+, health & safety A+; Watch: amenities D-, commute F.
- Bay (suburban): math 51% / reading 51% proficiency, ranked #29 of 73 in FL (top 40%) — acceptable for families but not a draw, mixed tenant base, ~2y average lease.
- Zoned schools: Breakfast Point Academy (math 62% / reading 57%, grade B-, #690 of 2,144 statewide, top 34%, 1,058 students, 47% FRL); J.R. Arnold High School (math 41% / reading 54%, grade D, #204 of 667 statewide, top 31%, 1,617 students, 36% FRL).
- Market conditions: Rents rising (+2.5%/yr); 1032 active listings in the ZIP; 27 comparable units currently listed for rent nearby; rentals at typical pace (median 16d on market — plan ~3-4 weeks tenant-placement turnaround); solid renter incomes; 2,473 units permitted in Bay County in 2024 (559 in 5+ unit buildings).
- This rent runs 43% of the median local income ($81k/yr) — at the standard rent-burdened threshold; future hikes will face affordability resistance.
Forward outlook
- Local home prices are declining (-3.0%/yr); year-one equity from $2k of loan paydown is wiped out by about $7k of value loss. Plan a longer hold.
- Bay County population projected at +24% by 2050 — long-run rental-demand tailwind backs the buy-and-hold thesis.
Negotiation context
- Only 5 days on market — expect competitive offers; lowballing is unlikely to land.
- 8 sale attempts since 10y ago with the ask held roughly flat each time — persistent listings suggest the price (not the market) is what's stuck; bring a comps-based counter.
Risks & watch-outs
- Watch-outs: flood insurance adds $66/mo; HOA is 32% of rent.
- Climate carrying-cost: major flood risk; severe wind risk, 99% chance of damaging wind over 30y; extreme-heat days projected 7→21/yr by 2055 (HVAC capex compounding) — expect insurance premiums to compound above CPI over the hold.
Questions for the listing agent
- What do current leases actually rent for vs. the listed asking? Can we see a recent rent roll and the last 12 months of T-12 income?
- What's the actual annual flood-insurance premium (NFIP or private), and is the property in a SFHA with mandatory coverage?
- What does the HOA fee cover, when was the last increase, and are there any pending special assessments or reserve-fund shortfalls?
- Any open or pending special assessments — roof, HVAC, plumbing, elevator, façade? What's the per-unit balance and payoff schedule, and is the seller paying it off at close or rolling it to the buyer?
- Is there a deadline driving the sale (1031 exchange, divorce, estate, relocation)? That informs how much negotiation room exists.
- Schools are B-rated — typically a magnet for longer-tenancy family renters. What's the average tenant stay here, and is there a school-zone premium baked into asking?
- The area grade is low — what's the realistic commute time and amenity access for the typical tenant pool here? Any planned neighborhood developments (good or bad) we should know about?
- This sits on a lake — are riparian / water-frontage rights deeded with the parcel? Any dock permits, shoreline easements, or HOA water-use restrictions?
- What's the documented flood / surge / shoreline-erosion history here (FEMA AND non-FEMA — e.g., storm surge, creek backup, septic-field saturation)?
- Any water-quality or seasonal algae-bloom issues that affect tenant satisfaction or short-term-rental demand?
- What's the average days-on-market for RENTAL listings here right now (not sales)? A rising rental-DOM trend means longer vacancies and softer asking-rent achievability than the comps imply.
- What's the recent tenant-quality profile in this submarket — average credit score on applications, eviction rate, late-payment / NSF rate, and stable-employment percentage? A property-management company in the area should have these aggregated.
- How much new apartment / multifamily construction is in the pipeline within 1–3 miles? Heavy new supply (>2% of stock underway) typically softens rents 12–24 months out; light construction supports rent growth.
Investment metrics
- 1% rule
- 1.21% ✓
- Cap rate
- 4.82%
- Cash-on-cash
- -5.26%
- DSCR
- 0.77
- GRM
- 6.9
CMA / ARV
No comps found within radius.
Projected returns pro-forma
-3.0% appreciation · 2.55% rent growth · sell at horizon
- IRR
- -27.9%
- Equity multiple
- 0.07×
- Total profit
- $-62,549
- Equity at exit
- $35,785
- IRR
- -28.1%
- Equity multiple
- -0.29×
- Total profit
- $-86,748
- Equity at exit
- $20,751
Cash invested: $67,200 (down + closing). Projections, not guarantees.
Landlord ↔ Tenant lean methodology
- Overall (STATE)
- 87 Strongly Landlord-Friendly
- State Florida
- 87 Strongly Landlord-Friendly · R+3
- County
- — inherits STATE
- City
- — inherits STATE
ZIP-level market 32408
- Rents YoY
- 2.5%
- Active inventory
- 1032
- Price-to-rent
- 6.9×
Monthly cashflow live
- Estimated rent
- $2,904 high interval (Pro) →
- Mortgage (P&I)
- −$1,259
- Tax from tax record
- −$302 /mo · $3,625/yr
- Insurance
- −$100
- Flood insurance flood zone
- −$66 /mo · $798/yr
- HOA est. from 3 same-building comps
- −$928
- Vacancy / Maint / Mgmt
- −$610
- Net cashflow
- $-361
Break-even live
Sensitivity live
| Price | -10% $-225 | -5% $-293 | +0% $-361 | +5% $-429 | +10% $-497 |
|---|---|---|---|---|---|
| Rent | -10% $-591 | -5% $-476 | +0% $-361 | +5% $-247 | +10% $-132 |
| Rate | -1.0pp $-240 | -0.5pp $-300 | base $-361 | +0.5pp $-423 | +1.0pp $-487 |
UW: 25.0% down · 7.5% · 30yr · 1.5% tax · 5.0% vac · 8.0% maint · 8.0% mgmt
Financing live
Cash to close
- Down payment
- $60,000
- Closing costs
- $7,200
- Reserves months
- —
- Total cash needed
- —
Loan-product check · same deal, 3 products live
Conventional
25% down · 7.5% · 30yr
- Down + closing
- —
- Monthly P&I
- —
- Monthly cashflow
- —
- DSCR
- —
- Eligible?
- —
Personal DTI + credit; lowest rate.
DSCR
20% down · 8.5% · 30yr
- Down + closing
- —
- Monthly P&I
- —
- Monthly cashflow
- —
- DSCR
- —
- Eligible?
- —
No personal income docs; deal must DSCR.
Hard money
10% down · 12.0% · 12mo
- Down + closing
- —
- Monthly P&I
- —
- Monthly cashflow
- —
- DSCR
- —
- Eligible?
- —
Short-term bridge; refi at stabilization.
Rent comps 27 comps
| Address | Beds | Baths | Sqft | Rent | $/sqft | DOM | Units | Dist |
|---|---|---|---|---|---|---|---|---|
| 9902 S Thomas Dr Unit 1354966P Panama City Beach, FL | 2.0 | 2.0 | 1259 | $1,970 | $1.56 | 15d | 1 | 0.02mi |
| 9815 S Thomas Dr Unit 1523339P Panama City, FL | 3.0 | 2.0 | 1259 | $4,018 | $3.19 | 23d | 1 | 0.10mi |
| 104 Gulfside Ct Unit 1523320P Panama City Beach, FL | 3.0 | 3.0 | 1496 | $5,020 | $3.36 | 15d | 1 | 0.15mi |
| 998 Gulfside Ct Unit 1523366P Panama City Beach, FL | 2.0 | 2.0 | 1065 | $4,124 | $3.87 | 15d | 1 | 0.15mi |
| 10625 Front Beach Rd Unit 1354975P Panama City Beach, FL | 2.0 | 2.0 | 1140 | $3,166 | $2.78 | 15d | 1 | 0.48mi |
| 204 Potters Bluff Dr Panama City Beach, FL | 1.0–3.0 | 1.0–2.0 | 1035 | $1,947 | $1.88 | 15d | 12 | 0.56mi |
| 10811 Front Beach Rd Unit 1354928P Panama City Beach, FL | 3.0 | 2.0 | 1194 | $3,463 | $2.90 | 15d | 1 | 0.64mi |
| 135 Grande Island Blvd Unit 1355007P Panama City Beach, FL | 3.0 | 3.5 | 1797 | $2,759 | $1.54 | 23d | 1 | 0.67mi |
| 133 W Leslie Ln Unit 1 Panama City Beach, FL | 2.0 | 1.5 | 950 | $2,200 | $2.32 | 23d | 1 | 0.77mi |
| 136 Bonnie Ln Panama City Beach, FL | 2.0 | 1.5 | 972 | $1,750 | $1.80 | 15d | 1 | 0.91mi |
| 138 Bonnie Ln Panama City Beach, FL | 2.0 | 1.5 | 972 | $1,599 | $1.65 | 15d | 1 | 0.91mi |
| 2858 Joan Ave Unit 1523343P Panama City, FL | 4.0 | 3.0 | 1754 | $5,270 | $3.00 | 15d | 1 | 0.97mi |
| 8715 Surf Dr Unit 1523323P Panama City Beach, FL | 2.0 | 2.0 | 1194 | $5,377 | $4.50 | 15d | 1 | 1.01mi |
| 2521 Allison Ave Panama City, FL | 2.0 | 2.0 | 980 | $1,450 | $1.48 | 23d | 1 | 1.03mi |
| 98 Paddock Club Dr Panama City Beach, FL | 1.0–3.0 | 1.0–2.0 | 1093 | $2,063 | $1.89 | 15d | 19 | 1.09mi |
| 2917 Allison Ave Panama City Beach, FL | 3.0 | 2.0 | 1592 | $1,700 | $1.07 | 23d | 1 | 1.10mi |
| 2301 Anne Ave Unit 8901 Laird Panama City, FL | 2.0 | 2.0 | 900 | $1,625 | $1.81 | 15d | 1 | 1.13mi |
| 2216 Anne Ave Panama City, FL | 2.0 | 2.0 | 951 | $1,300 | $1.37 | 15d | 1 | 1.16mi |
| 520 N Richard Jackson Blvd #1912 Panama City Beach, FL | 2.0 | 2.0 | 1200 | $2,375 | $1.98 | 15d | 1 | 1.21mi |
| 11222 Hutchison Blvd Unit 1523347P Panama City Beach, FL | 2.0 | 2.0 | 1194 | $3,907 | $3.27 | 23d | 1 | 1.27mi |
| 2526 Laurie Ave Panama City, FL | 2.0 | 2.0 | 950 | $1,750 | $1.84 | 15d | 1 | 1.28mi |
| 104 White Cap Way Panama City Beach, FL | 3.0 | 2.0 | 1146 | $2,700 | $2.36 | 23d | 1 | 1.30mi |
| 10400 Panama City Beach Pkwy Panama City Beach, FL | 1.0–3.0 | 1.0–2.0 | 1151 | $2,372 | $2.06 | 15d | 20 | 1.33mi |
| 175 White Cap Way Unit 1 Panama City Beach, FL | 3.0 | 2.5 | 1432 | $1,750 | $1.22 | 15d | 1 | 1.35mi |
| 1609 Vecuna Cir Panama City Beach, FL | 3.0 | 2.0 | 1268 | $2,100 | $1.66 | 15d | 1 | 1.38mi |
| 8700 Front Beach Rd Panama City Beach, FL | 2.0–3.0 | 2.5 | 1543 | $2,400 | $1.56 | 15d | 2 | 1.41mi |
| 8604 Whelch Dr Panama City, FL | 1.0–3.0 | 1.0–3.0 | 1087 | $2,950 | $2.71 | 15d | 18 | 1.42mi |
HOA detail condo
- Monthly dues
- $0 · $0/yr
- Assessments
- None detected in remarks — confirm with the listing agent.
Listing history 5 events
-
2026-06-07statusdays on market $240,000 Pending 5 DOM
-
2026-06-05days on market $240,000 Active 3 DOM
-
2026-06-03days on market $240,000 Active 2 DOM
-
2026-06-02remarks 699-char remark
-
2026-06-02$240,000 Active 1 DOM
ⓘ Source: listings_history table (triggers on properties + properties_extension) + one-shot
backfill from property_details.listing_events for pre-trigger history.
Tax reassessment forecast FL · Resets to sale price
- Current annual tax
- $3,625 · $302/mo
- Projected year-2 tax
- $3,625 · $302/mo
- Expected delta
- $0/yr ($0/mo · 0.0%)
ⓘ Screening estimate from a state-policy table — verify with the county assessor before closing.
Climate risk First Street
- Flood 7/10 Severe FEMA zone X (unshaded) · 77% chance over 30 yrs
- Wildfire 3/10 Moderate
- Heat 10/10 Extreme 7 d/yr ≥106°F today · 21 d/yr by 30 yrs out
- Wind 10/10 Extreme 99% chance of damaging wind over 30 yrs
- Air quality 1/10 Low 0 unhealthy d/yr today · 0 by 30 yrs out
Nearby sold comps map
Loading sold comps map…
Walkable amenities ~0.75 mi
Loading nearby amenities…
Taxation est. · year 1
- Rental income
- $34,844
- − Mortgage interest
- −$13,444
- − Property taxes
- −$3,625
- − Insurance
- −$1,997
- − Repairs & maintenance
- −$2,788
- − Management
- −$2,788
- − HOA
- −$11,136
- − Depreciation
- −$6,982
- Taxable loss
- −$7,915
- Est. tax savings @ 24.0%
- +$1,900
- After-tax cash flow
- $-2,435/yr
For passive investors: Depreciation is non-cash, so a rental often shows a tax loss while cash-flowing — sheltering income. Rental losses are passive: they offset passive income freely, and up to $25,000/yr can offset ordinary (W-2) income if you actively participate and your MAGI is under $100k (phasing out to $0 by $150k); unused losses carry forward. On sale, claimed depreciation is recaptured at up to 25%, and gains may owe capital-gains tax (a 1031 exchange can defer both). Figures are a year-1 estimate at your 24.0% rate — not tax advice; consult a CPA.
Schools (NCES district)
- District
- Bay
- NCES district ID
- 1200090
- Math proficiency
- 51% ▼ -8.00%
- Reading proficiency
- 51% ▼ -7.00%
- Median HH income
- $47,740
- Composite
- 43.41/100
- National rank
- #3014
- State rank
- #29 of 73 in FL
Livability — Panama City Beach
- Score
- 78/100
- State rank
- #172
- US rank
- #2624
Category grades
Schools grade is shown separately in the Schools card above.
Census & demographics
- Census place
- Panama City Beach, FL
- County
- Bay County · 163,593 people
- City population
- 18,326
- Metro
- Panama City, FL
- Population (ZIP)
- 18,832
- Household income
- $80,822
- Rent vs Own
- Severe rent burden
- 817.0
Population outlook (Bay County) Hauer SSP2
- Today (2025)
- 206,264 people
- By 2030
- 217,740 · +5.6%
- By 2040
- 238,738 · +15.7%
- By 2050
- 255,545 · +23.9%
- By 2075
- 288,295 · +39.8%
- By 2100
- 288,638 · +39.9%
Race, ethnicity, and origin ACS 2023
- Neighborhood character
- Predominantly White (81%)
- Race & ethnicity
- White 81% Hispanic / Latino 7% Two or more races 6% Black 3% Asian 2%
- Hispanic origin (detail)
- Mexican 2% Puerto Rican 2%
- Common ancestry
- Romanian 4% Lithuanian 4% Italian 2%
- Foreign-born
- 11% · Canada, South Korea
- Languages at home
- 88% English-only · Spanish 5% Russian/Polish/Slavic 4% Tagalog/Filipino 1%
Political lean MEDSL · Bay
- 2024 margin
- Solid R (+47.4) · D 25.8% · R 73.1% · Other 1.1%
- 2008→2024 swing
- -6.6pp toward R · 2008: -40.7pp · 2024: -47.4pp
- All cycles
- 2024: R+47.4 2020: R+43.5 2016: R+46.3 2012: R+43.6 2008: R+40.7
Not yet ingested
- Civics
- —
Market trends
- HPI YoY
- ▼ -202.52%
- Current HPI
- 246.9126
- Rent YoY
- ▲ 2.55%
- Metro
- Panama City, FL
- State GDP YoY
- ▲ 3.28%
- F500 in state
- 36
Industry mix (Fortune 500 HQ in FL)
| Industry | F500 HQs | Revenue |
|---|---|---|
| Industrial Technology | 2 | $29B |
|
||
| Insurance | 2 | $17B |
|
||
| Retail | 1 | $60B |
|
||
| Technology Distribution | 1 | $58B |
|
||
| Homebuilding | 1 | $35B |
|
||
| Technology Manufacturing | 1 | $35B |
|
||
Price history
-99.6% since first listed20 events — show timeline
- 2026-06-01 Listed $240,000 CPARMLS
- 2026-02-20 Sold (Public Records) $220,000 Public Records
- 2026-02-20 Sold (MLS) $220,000 CPARMLS
- 2026-02-20 Sold (MLS) $220,000 ECAR
- 2026-02-11 Pending — CPARMLS
- 2026-01-22 Price Changed $249,900 CPARMLS
- 2025-11-19 Listed $279,000 CPARMLS
- 2025-11-19 Listed $279,000 ECAR
- 2024-04-01 Listing Removed — CPARMLS
- 2023-10-04 Listed $390,000 CPARMLS
- 2023-08-31 Listing Removed — CPARMLS
- 2023-02-17 Listed $399,000 CPARMLS
- 2016-10-05 Sold (Public Records) $197,200 Public Records
- 2016-09-30 Sold (MLS) $197,199 NAMLS
- 2016-09-30 Sold (MLS) $197,199 ECAR
- 2016-09-30 Sold (MLS) $197,199 CPARMLS
- 2016-09-01 Listed $197,199 CPARMLS
- 2016-08-01 Listed $197,199 NAMLS
- 2016-08-01 Listed $197,199 ECAR
- 2015-02-06 Sold (Public Records) $57,690,000 Public Records
Property tax history
+9.8%/yrLatest (2025): $3,625 · -4.1% YoY. Source: county tax records.
Cash-flow waterfall
monthlySold comps — $/sqft
last 12 mo · ≤1 miLoading sold comps…