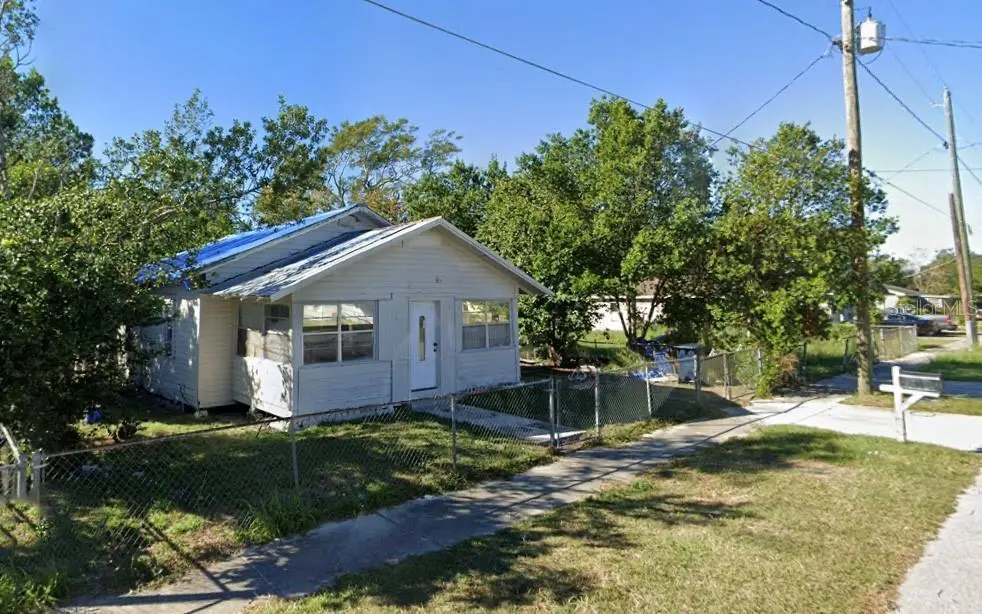
518 Orange St · Auburndale, FL
Flood risk 1/10 · Minimal
- FEMA flood zone
- X (unshaded)
- Chance of flooding over 30 yrs
- 0.0%
- Est. flood insurance / yr
- $507 – $1,088
Fire risk 4/10 · Minor
- Est. fire insurance / yr
- $947 – $1,759
Heat risk 8/10 · Major
- Hot days now (above 107°F)
- 7 days/yr
- Hot days in 30 yrs
- 24 days/yr
Wind risk 9/10 · Severe
- Chance of severe wind over 30 yrs
- 99.0%
Air-quality risk 2/10 · Minimal
- Unhealthy air days now
- 0 days/yr
- Unhealthy air days in 30 yrs
- 1 days/yr
Risk factors via First Street. Map © Google.
Why this score? — see what drove the B grade
The composite is a weighted blend of 9 inputs, each scored 0–100. Each bar is that input's sub-score; the figure is the points it added to the 100-point composite (weight × sub-score).
- Cash flow +30.0/30.0
- 1% rule +10.0/10.0
- DSCR +10.0/10.0
- ARV discount +7.5/15.0
- Livability +4.2/5.0
- Schools +3.5/10.0
- Rent growth +3.3/5.0
- Condition / age +2.5/5.0
- Appreciation +0.0/10.0
$79,900
🖨 Deal sheet 📄 Offer letter ✓ Due diligence
Listing remarks MLS
OWNER FINANCING AVAILABLE WITH HALF DOWN! Exceptional opportunity to acquire a residential lot in an established Auburndale neighborhood. Property features paved road frontage, existing utility connections, well, and an existing structure on site. While the current structure requires extensive renovation or possible removal, the property offers excellent potential for redevelopment, new construction, or a future investment project. Conveniently located near schools, shopping, restaurants, and major transportation corridors.
Key facts
- 7,292 sq ft lot
- Built 1942
- Listed 15 days
Property features AI
Finance
- Other: Zoned R-3; Lot roughly 0.17 acres (approximately 57 x 128); Building area and living area reported in public records
- HOA & community: No HOA/association indicated
Exterior
- Parking: Open parking; Other parking
- Utilities: Public water; Public sewer; Electricity connected; Sewer connected
- Home design: Single-family residence; One story; Faces east; Fixed/needs repair condition (Fixer)
- Construction: Frame construction; Metal roof; Other roof materials; Crawlspace foundation with pillar/post/pier
- Exterior features: Chain link fencing; Paved lot; Other exterior features
Interior
- Kitchen: Microwave; Range; Refrigerator
- Bedrooms: 3 bedrooms
- Flooring: Linoleum
- Bathrooms: 1 full bathroom
- Heating & cooling: No heating specified; No cooling specified
- Interior features: Open floor plan; Family room
- Laundry & utility: Inside laundry with electric dryer hookup
Neighborhood map
What this means for you Summary
Snapshot
- This is a 2-bed/1.0-bath single-family listed at $80k.
Deal economics
- At list price, monthly cash flow is $656 ($8k/yr) — positive.
- The deal already cash-flows at list — no discount required.
- Meets the 1% rule at list price ($2k rent vs $80k).
- Recommended offer: $79k (1.5% below list) — sets the bar for market timing.
Location & tenants
- Location reads 83/100 on livability (#48 in FL, #905 nationally) — a professional / high-income tenant draw. Strengths: cost of living A+, housing A+, health & safety A+; Watch: amenities C-, commute C-.
- Polk (suburban): math 39% / reading 43% proficiency, ranked #62 of 73 in FL (top 85%) — families likely to look elsewhere, expect single-tenant / working-renter base with shorter leases.
- Zoned schools: Auburndale Central Elementary School (math 27% / reading 37%, grade F, #1,797 of 2,144 statewide, top 86%, 383 students, 64% FRL); Auburndale Senior High School (math 25% / reading 31%, grade F, #464 of 667 statewide, top 70%, 1,716 students, 53% FRL) — zoned schools at 58% FRL track the district average.
- Market conditions: Rents rising (+3.2%/yr); 476 active listings in the ZIP; 5 comparable units currently listed for rent nearby; rentals at typical pace (median 24d on market — plan ~3-4 weeks tenant-placement turnaround); 10,384 units permitted in Polk County in 2024 (1,716 in 5+ unit buildings).
Forward outlook
- Local home prices are declining (-3.0%/yr); year-one equity from $552 of loan paydown is wiped out by about $2k of value loss. Plan a longer hold.
- Polk County population projected at +33% by 2050 — long-run rental-demand tailwind backs the buy-and-hold thesis.
- At projected returns (-3.0% appreciation + 3.2% rent growth), your $22k cash investment doubles in ~4 years — after that, you're playing with house money.
Negotiation context
- It's been on market 15 days — a 2% lower offer ($79k) is reasonable based on typical stale-listing flexibility.
- 6 sale attempts since 3y ago with the ask held roughly flat each time — persistent listings suggest the price (not the market) is what's stuck; bring a comps-based counter.
Risks & watch-outs
- Watch-outs: built in 1942 — expect roof / HVAC / electrical / plumbing capex.
- Climate carrying-cost: severe wind risk, 99% chance of damaging wind over 30y; extreme-heat days projected 7→24/yr by 2055 (HVAC capex compounding) — expect insurance premiums to compound above CPI over the hold.
Questions for the listing agent
- Built in 1942 — when were the roof, HVAC, electrical panel, plumbing, and water heater last replaced?
- Is there a deadline driving the sale (1031 exchange, divorce, estate, relocation)? That informs how much negotiation room exists.
- What's the average days-on-market for RENTAL listings here right now (not sales)? A rising rental-DOM trend means longer vacancies and softer asking-rent achievability than the comps imply.
- What's the recent tenant-quality profile in this submarket — average credit score on applications, eviction rate, late-payment / NSF rate, and stable-employment percentage? A property-management company in the area should have these aggregated.
- How much new for-sale + rental construction is in the pipeline within 1–3 miles? Heavy new supply typically softens prices + rents 12–24 months out; constrained supply supports both.
Investment metrics
- 1% rule
- 2.00% ✓
- Cap rate
- 16.15%
- Cash-on-cash
- 35.20%
- DSCR
- 2.57
- GRM
- 4.2
CMA / ARV
No comps found within radius.
Projected returns pro-forma
-3.0% appreciation · 3.18% rent growth · sell at horizon
- IRR
- 31.0%
- Equity multiple
- 2.31×
- Total profit
- $29,197
- Equity at exit
- $11,913
- IRR
- 38.3%
- Equity multiple
- 4.61×
- Total profit
- $80,675
- Equity at exit
- $6,908
Cash invested: $22,372 (down + closing). Projections, not guarantees.
Landlord ↔ Tenant lean methodology
- Overall (STATE)
- 87 Strongly Landlord-Friendly
- State Florida
- 87 Strongly Landlord-Friendly · R+3
- County
- — inherits STATE
- City
- — inherits STATE
ZIP-level market 33823
- Home prices YoY
- -24.5%
- Rents YoY
- 3.2%
- Active inventory
- 476
- Price-to-rent
- 4.2×
Monthly cashflow live
- Estimated rent
- $1,600 high interval (Pro) →
- Mortgage (P&I)
- −$419
- Tax from tax record
- −$155 /mo · $1,865/yr
- Insurance
- −$33
- HOA
- −$0
- Vacancy / Maint / Mgmt
- −$336
- Net cashflow
- $656
Break-even live
UW: 25.0% down · 7.5% · 30yr · 1.5% tax · 5.0% vac · 8.0% maint · 8.0% mgmt
Financing live
Cash to close
- Down payment
- $19,975
- Closing costs
- $2,397
- Reserves months
- —
- Total cash needed
- —
Loan-product check · same deal, 3 products live
Conventional
25% down · 7.5% · 30yr
- Down + closing
- —
- Monthly P&I
- —
- Monthly cashflow
- —
- DSCR
- —
- Eligible?
- —
Personal DTI + credit; lowest rate.
DSCR
20% down · 8.5% · 30yr
- Down + closing
- —
- Monthly P&I
- —
- Monthly cashflow
- —
- DSCR
- —
- Eligible?
- —
No personal income docs; deal must DSCR.
Hard money
10% down · 12.0% · 12mo
- Down + closing
- —
- Monthly P&I
- —
- Monthly cashflow
- —
- DSCR
- —
- Eligible?
- —
Short-term bridge; refi at stabilization.
Rent comps 5 comps
| Address | Beds | Baths | Sqft | Rent | $/sqft | DOM | Units | Dist |
|---|---|---|---|---|---|---|---|---|
| 4 Sandy Ln Auburndale, FL | 3.0 | 2.0 | 954 | $1,620 | $1.70 | 23d | 1 | 0.57mi |
| 704 Sunset Ave Unit B Auburndale, FL | 2.0 | 1.0 | 850 | $1,340 | $1.58 | 14d | 1 | 0.80mi |
| 2366 Lake Dr NW Winter Haven, FL | 2.0 | 2.0 | 1003 | $1,350 | $1.35 | 3d | 1 | 1.46mi |
| 711 Lake Jessie Dr Winter Haven, FL | 2.0 | 2.0 | 884 | $1,400 | $1.58 | 23d | 1 | 1.49mi |
| 149 Jana Cir Auburndale, FL | 3.0 | 2.0 | 1352 | $1,650 | $1.22 | 23d | 1 | 1.49mi |
Listing history 11 events
-
2026-06-18days on market $79,900 Active 15 DOM
-
2026-06-17days on market $79,900 Active 14 DOM
-
2026-06-16days on market $79,900 Active 13 DOM
-
2026-06-15days on market $79,900 Active 12 DOM
-
2026-06-13days on market $79,900 Active 10 DOM
-
2026-06-10days on market $79,900 Active 7 DOM
-
2026-06-09days on market $79,900 Active 6 DOM
-
2026-06-08days on market $79,900 Active 5 DOM
-
2026-06-07days on market $79,900 Active 4 DOM
-
2026-06-05remarks 455-char remark
-
2026-06-05$79,900 Active 1 DOM
ⓘ Source: listings_history table (triggers on properties + properties_extension) + one-shot
backfill from property_details.listing_events for pre-trigger history.
Tax reassessment forecast FL · Resets to sale price
- Current annual tax
- $1,865 · $155/mo
- Projected year-2 tax
- $1,865 · $155/mo
- Expected delta
- $0/yr ($0/mo · -0.0%)
ⓘ Screening estimate from a state-policy table — verify with the county assessor before closing.
Climate risk First Street
- Flood 1/10 Low FEMA zone X (unshaded) · 0% chance over 30 yrs
- Wildfire 4/10 Moderate
- Heat 8/10 Severe 7 d/yr ≥107°F today · 24 d/yr by 30 yrs out
- Wind 9/10 Extreme 99% chance of damaging wind over 30 yrs
- Air quality 2/10 Low 0 unhealthy d/yr today · 1 by 30 yrs out
Nearby sold comps map
Loading sold comps map…
Walkable amenities ~0.75 mi
Loading nearby amenities…
Taxation est. · year 1
- Rental income
- $19,199
- − Mortgage interest
- −$4,476
- − Property taxes
- −$1,865
- − Insurance
- −$400
- − Repairs & maintenance
- −$1,536
- − Management
- −$1,536
- − Depreciation
- −$2,324
- Taxable income
- $7,063
- Est. tax owed @ 24.0%
- −$1,695
- After-tax cash flow
- $6,180/yr
For passive investors: Depreciation is non-cash, so a rental often shows a tax loss while cash-flowing — sheltering income. Rental losses are passive: they offset passive income freely, and up to $25,000/yr can offset ordinary (W-2) income if you actively participate and your MAGI is under $100k (phasing out to $0 by $150k); unused losses carry forward. On sale, claimed depreciation is recaptured at up to 25%, and gains may owe capital-gains tax (a 1031 exchange can defer both). Figures are a year-1 estimate at your 24.0% rate — not tax advice; consult a CPA.
Schools (NCES district)
- District
- Polk
- NCES district ID
- 1201590
- Math proficiency
- 39% ▼ -11.00%
- Reading proficiency
- 43% ▼ -4.00%
- Median HH income
- $43,979
- Composite
- 34.74/100
- National rank
- #5132
- State rank
- #62 of 73 in FL
Livability — Auburndale
- Score
- 83/100
- State rank
- #48
- US rank
- #905
Category grades
Schools grade is shown separately in the Schools card above.
Census & demographics
- Census place
- Auburndale, FL
- County
- Polk County · 740,051 people
- City population
- 41,779
- Metro
- Lakeland-Winter Haven, FL
- Population (ZIP)
- 41,779
- Household income
- $71,485
- Rent vs Own
- Severe rent burden
- 821.0
Population outlook (Polk County) Hauer SSP2
- Today (2025)
- 752,975 people
- By 2030
- 804,621 · +6.9%
- By 2040
- 906,117 · +20.3%
- By 2050
- 1,000,476 · +32.9%
- By 2075
- 1,197,520 · +59.0%
- By 2100
- 1,271,518 · +68.9%
Race, ethnicity, and origin ACS 2023
- Neighborhood character
- Predominantly White (65%)
- Race & ethnicity
- White 65% Hispanic / Latino 19% Black 13% Two or more races 6% Asian 2%
- Hispanic origin (detail)
- Mexican 7% Puerto Rican 7% Cuban 1%
- Common ancestry
- Hispanic 3% Lithuanian 2% Romanian 1%
- Foreign-born
- 10% · Canada, Jamaica, Philippines
- Languages at home
- 79% English-only · Spanish 15% French/Haitian/Cajun 3% Other Indo-European 2%
Political lean MEDSL · Polk
- 2024 margin
- Strong R (+20.7) · D 39.2% · R 59.9%
- 2008→2024 swing
- -14.6pp toward R · 2008: -6.1pp · 2024: -20.7pp
- All cycles
- 2024: R+20.7 2020: R+14.4 2016: R+14.1 2012: R+6.8 2008: R+6.1
Not yet ingested
- Civics
- —
Market trends
- HPI YoY
- ▼ -102.70%
- Current HPI
- 316.9436
- Rent YoY
- ▲ 3.18%
- Metro
- Lakeland-Winter Haven, FL
- State GDP YoY
- ▲ 3.28%
- F500 in state
- 36
Industry mix (Fortune 500 HQ in FL)
| Industry | F500 HQs | Revenue |
|---|---|---|
| Industrial Technology | 2 | $29B |
|
||
| Insurance | 2 | $17B |
|
||
| Retail | 1 | $60B |
|
||
| Technology Distribution | 1 | $58B |
|
||
| Homebuilding | 1 | $35B |
|
||
| Technology Manufacturing | 1 | $35B |
|
||
Price history
+370.0% since first listed14 events — show timeline
- 2026-06-03 Listed $79,900 Stellar MLS as Distributed by MLS Grid
- 2026-06-03 Listed $79,900 Stellar MLS as Distributed by MLS Grid
- 2026-04-16 Listing Removed — Stellar MLS as Distributed by MLS Grid
- 2026-04-09 Price Changed $75,000 Stellar MLS as Distributed by MLS Grid
- 2026-04-07 Relisted — Stellar MLS as Distributed by MLS Grid
- 2026-03-12 Pending — Stellar MLS as Distributed by MLS Grid
- 2026-03-09 Price Changed $80,000 Stellar MLS as Distributed by MLS Grid
- 2026-03-08 Relisted — Stellar MLS as Distributed by MLS Grid
- 2026-03-04 Pending — Stellar MLS as Distributed by MLS Grid
- 2026-02-23 Listed $90,000 Stellar MLS as Distributed by MLS Grid
- 2023-02-24 Sold (MLS) $70,000 Stellar MLS as Distributed by MLS Grid
- 2023-01-18 Pending — Stellar MLS as Distributed by MLS Grid
- 2023-01-16 Listed $85,000 Stellar MLS as Distributed by MLS Grid
- 1980-07-01 Sold (Public Records) $17,000 Public Records
Property tax history
+14.2%/yrLatest (2025): $1,865 · -9.3% YoY. Source: county tax records.
Cash-flow waterfall
monthlySold comps — $/sqft
last 12 mo · ≤1 miLoading sold comps…