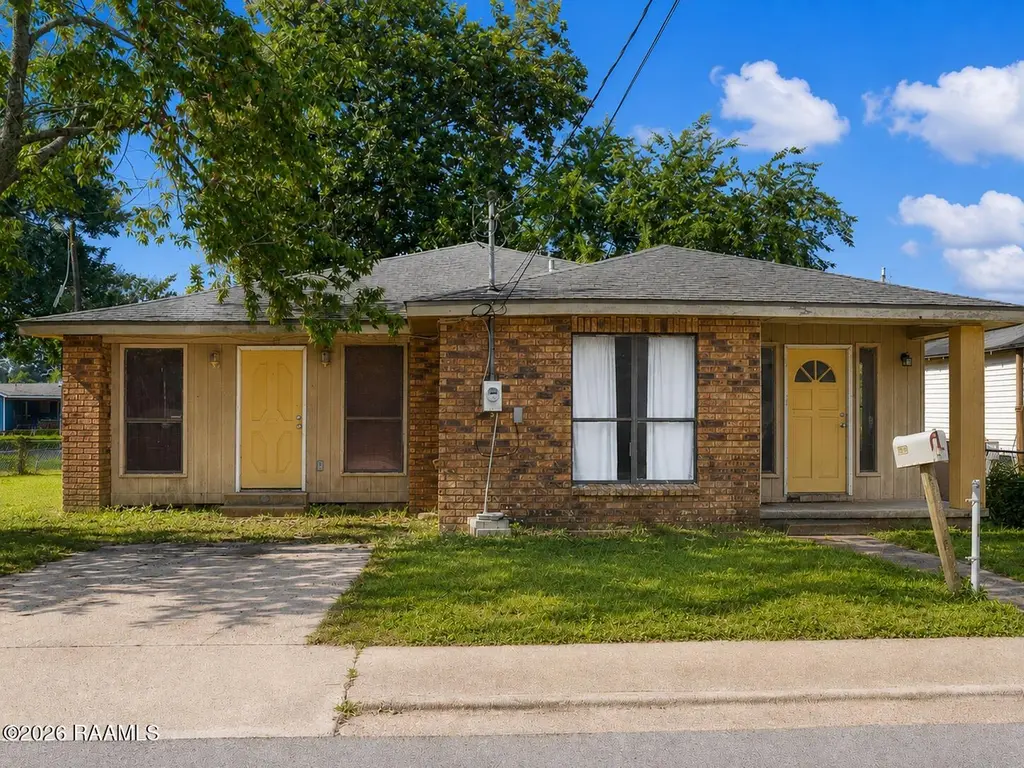
334 Carver St · Lafayette, LA
Flood risk 1/10 · Minimal
- FEMA flood zone
- X (unshaded)
- Chance of flooding over 30 yrs
- 0.0%
- Est. flood insurance / yr
- $507 – $1,088
Fire risk 3/10 · Minor
- Est. fire insurance / yr
- $1,269 – $2,357
Heat risk 8/10 · Major
- Hot days now (above 109°F)
- 7 days/yr
- Hot days in 30 yrs
- 20 days/yr
Wind risk 9/10 · Severe
- Chance of severe wind over 30 yrs
- 99.0%
Air-quality risk 2/10 · Minimal
- Unhealthy air days now
- 0 days/yr
- Unhealthy air days in 30 yrs
- 1 days/yr
Risk factors via First Street. Map © Google.
Why this score? — see what drove the B+ grade
The composite is a weighted blend of 9 inputs, each scored 0–100. Each bar is that input's sub-score; the figure is the points it added to the 100-point composite (weight × sub-score).
- Cash flow +30.0/30.0
- ARV discount +15.0/15.0
- 1% rule +10.0/10.0
- DSCR +10.0/10.0
- Rent growth +4.3/5.0
- Schools +3.6/10.0
- Livability +3.5/5.0
- Condition / age +2.5/5.0
- Appreciation +0.0/10.0
$90,000
🖨 Deal sheet (PDF) 📄 Offer letter ✓ Due diligence
Listing remarks MLS
4 Bedroom 3 Bath Home on a corner lot in established subdivision in Lafayette. Located near the Martin Luther King, Jr. Center. Playground and recreation center within walking distance.Public Transportation near by. Home needs a little TLC. Lots of space in this home for a large family. Home would also be good investment property.
Key facts
- 5,227 sq ft lot
- Parking
- Listed 28 days
Property features AI
Finance
- HOA & community: Playground
Exterior
- Parking: Open parking
- Utilities: Gas service: Atmos; Public sewer; Electric: City
- Home design: Single family residence
- Construction: Brick veneer and frame construction; Asbestos shingle roof
- Exterior features: Porch; Exterior lighting; Partial chain-link fencing
Interior
- Kitchen: Refrigerator; Gas stove
- Flooring: Tile; Vinyl
- Bathrooms: 3 full bathrooms
- Heating & cooling: Central heating; Electric heating; Has cooling
- Interior features: Walk-in closets; Formica counters
- Laundry & utility: Washer hookup; Electric dryer hookup
Neighborhood map
What this means for you Summary
Snapshot
- This is a 4-bed/3.0-bath single-family listed at $90k.
Deal economics
- At list price, monthly cash flow is $579 ($7k/yr) — positive.
- The deal already cash-flows at list — no discount required.
- Meets the 1% rule at list price ($1k rent vs $90k).
- Recommended offer: $89k (1.5% below list) — sets the bar for market timing.
Location & tenants
- Location reads 70/100 on livability (#63 in LA) — a middle-class / working-renter tenant base. Strengths: cost of living A+, housing A+, health & safety A+; Watch: amenities C-, employment C-, crime F.
- Lafayette Parish (urban): math 38% / reading 46% proficiency, ranked #19 of 98 in LA (top 19%) — families likely to look elsewhere, expect single-tenant / working-renter base with shorter leases.
- Zoned schools: Ossun Elementary School (math 35% / reading 38%, grade F, #269 of 646 statewide, top 42%, 519 students, 76% FRL); Lafayette Middle School (math 12% / reading 29%, grade F, #161 of 218 statewide, top 76%, 369 students, 83% FRL); Acadiana High School (math 31% / reading 29%, grade F, #125 of 265 statewide, top 47%, 1,813 students, 56% FRL) — zoned schools average 72% FRL vs 56% district-wide (15 pts higher); higher-poverty schools than district average — tighter screening recommended.
- Zoned-school proficiency averages 29% at this address vs 42% district-wide (-13 pts) — the specific schools serving this property underperform the Lafayette Parish average; the district grade overstates school quality for this exact location.
- Market conditions: Rents rising fast (+7.3%/yr); 247 active listings in the ZIP; 2 comparable units currently listed for rent nearby; lower-income renter base — watch delinquency; 1,585 units permitted in Lafayette Parish in 2024 (10 in 5+ unit buildings).
Forward outlook
- Local home prices are declining (-3.0%/yr); year-one equity from $622 of loan paydown is wiped out by about $3k of value loss. Plan a longer hold.
- Lafayette County population projected at +34% by 2050 — long-run rental-demand tailwind backs the buy-and-hold thesis.
- At projected returns (-3.0% appreciation + 7.3% rent growth), your $25k cash investment doubles in ~4 years — after that, you're playing with house money.
Negotiation context
- It's been on market 28 days — a 2% lower offer ($89k) is reasonable based on typical stale-listing flexibility.
- 10 sale attempts since 20y ago with the ask held roughly flat each time — persistent listings suggest the price (not the market) is what's stuck; bring a comps-based counter.
- Current owner paid $48k; list at $90k implies a 88% gain — meaningful room to come down on a strong offer.
Risks & watch-outs
- Watch-outs: built in 1958 — expect roof / HVAC / electrical / plumbing capex.
- Climate carrying-cost: severe wind risk, 99% chance of damaging wind over 30y; extreme-heat days projected 7→20/yr by 2055 (HVAC capex compounding) — expect insurance premiums to compound above CPI over the hold.
Questions for the listing agent
- Built in 1958 — when were the roof, HVAC, electrical panel, plumbing, and water heater last replaced?
- Is there a deadline driving the sale (1031 exchange, divorce, estate, relocation)? That informs how much negotiation room exists.
- Schools are B-rated — typically a magnet for longer-tenancy family renters. What's the average tenant stay here, and is there a school-zone premium baked into asking?
- Crime grade is F in this area — have there been break-ins, vandalism, or insurance claims at this property in the last 3 years? What carrier currently insures it and at what premium?
- What's the average days-on-market for RENTAL listings here right now (not sales)? A rising rental-DOM trend means longer vacancies and softer asking-rent achievability than the comps imply.
- What's the recent tenant-quality profile in this submarket — average credit score on applications, eviction rate, late-payment / NSF rate, and stable-employment percentage? A property-management company in the area should have these aggregated.
- How much new for-sale + rental construction is in the pipeline within 1–3 miles? Heavy new supply typically softens prices + rents 12–24 months out; constrained supply supports both.
Investment metrics
- 1% rule
- 1.60% ✓
- Cap rate
- 14.02%
- Cash-on-cash
- 27.59%
- DSCR
- 2.23
- GRM
- 5.2
CMA / ARV
- ARV (median comp)
- $171,863
- List price
- $90,000
- Delta
- -47.63%
- Verdict
- UNDERPRICED
- Comps
- 20 within 1.0 mi
Show comp detail 2 sales within ~0.75 mi
| Address | Dist | Beds/Ba | Sqft | Sold | Price | $/sf | Match |
|---|---|---|---|---|---|---|---|
| 104 Fairway Dr | 0.44mi | 3/1.5 (-1) | 2,150 (+2%) | 8mo | $164,000 | $76 | 59 |
| 205 Portland Ave | 0.67mi | 3/2.0 (-1) | 1,800 (-15%) | 21mo | $189,500 | $105 | 18 |
Match score weights: distance 35% · size 25% · config 20% · recency 20%. Top-matched comps best support the ARV.
Projected returns pro-forma
-3.0% appreciation · 7.35% rent growth · sell at horizon
- IRR
- 26.2%
- Equity multiple
- 2.15×
- Total profit
- $28,894
- Equity at exit
- $13,419
- IRR
- 36.3%
- Equity multiple
- 5.06×
- Total profit
- $102,224
- Equity at exit
- $7,782
Cash invested: $25,200 (down + closing). Projections, not guarantees.
Landlord ↔ Tenant lean methodology
- Overall (STATE)
- 90 Strongly Landlord-Friendly
- State Louisiana
- 90 Strongly Landlord-Friendly · R+12
- County
- — inherits STATE
- City
- — inherits STATE
ZIP-level market 70501
- Rents YoY
- 7.3%
- Active inventory
- 247
- Price-to-rent
- 5.2×
Monthly cashflow live
- Estimated rent
- $1,444 medium interval (Pro) →
- Mortgage (P&I)
- −$472
- Tax from tax record
- −$52 /mo · $624/yr
- Insurance
- −$38
- HOA
- −$0
- Vacancy / Maint / Mgmt
- −$303
- Net cashflow
- $579
Break-even live
Sensitivity live
| Price | -10% $630 | -5% $605 | +0% $579 | +5% $554 | +10% $528 |
|---|---|---|---|---|---|
| Rent | -10% $465 | -5% $522 | +0% $579 | +5% $636 | +10% $693 |
| Rate | -1.0pp $625 | -0.5pp $602 | base $579 | +0.5pp $556 | +1.0pp $532 |
UW: 25.0% down · 7.5% · 30yr · 1.5% tax · 5.0% vac · 8.0% maint · 8.0% mgmt
Financing live
Cash to close
- Down payment
- $22,500
- Closing costs
- $2,700
- Reserves months
- —
- Total cash needed
- —
Loan-product check · same deal, 3 products live
Conventional
25% down · 7.5% · 30yr
- Down + closing
- —
- Monthly P&I
- —
- Monthly cashflow
- —
- DSCR
- —
- Eligible?
- —
Personal DTI + credit; lowest rate.
DSCR
20% down · 8.5% · 30yr
- Down + closing
- —
- Monthly P&I
- —
- Monthly cashflow
- —
- DSCR
- —
- Eligible?
- —
No personal income docs; deal must DSCR.
Hard money
10% down · 12.0% · 12mo
- Down + closing
- —
- Monthly P&I
- —
- Monthly cashflow
- —
- DSCR
- —
- Eligible?
- —
Short-term bridge; refi at stabilization.
Rent comps 2 comps
| Address | Beds | Baths | Sqft | Rent | $/sqft | DOM | Units | Dist |
|---|---|---|---|---|---|---|---|---|
| 816 Martin Luther King Jr Dr Lafayette, LA | 4.0 | 2.0 | 1453 | $1,450 | $1.00 | 22d | 1 | 0.32mi |
| 423 Sampson St Lafayette, LA | 4.0 | 2.0 | 1400 | $950 | $0.68 | 45d | 1 | 1.29mi |
Listing history 33 events
-
2026-06-21days on market $90,000 Active 28 DOM
-
2026-06-18days on market $90,000 Active 25 DOM
-
2026-06-17days on market $90,000 Active 24 DOM
-
2026-06-16days on market $90,000 Active 23 DOM
-
2026-06-15days on market $90,000 Active 22 DOM
-
2026-06-14days on market $90,000 Active 20 DOM
-
2026-06-13days on market $90,000 Active 19 DOM
-
2026-06-10days on market $90,000 Active 17 DOM
-
2026-06-09days on market $90,000 Active 16 DOM
-
2026-06-08days on market $90,000 Active 15 DOM
-
2026-06-07days on market $90,000 Active 14 DOM
-
2026-06-05days on market $90,000 Active 11 DOM
-
2026-06-03days on market $90,000 Active 10 DOM
-
2026-06-02days on market $90,000 Active 9 DOM
-
2026-06-01days on market $90,000 Active 8 DOM
-
2026-05-31days on market $90,000 Active 7 DOM
-
2026-05-30days on market $90,000 Active 6 DOM
-
2026-05-15$90,000 Active 408-char remark
-
2026-05-13historical $90,000 408-char remark
-
2025-09-23historical $900
-
2025-08-01$900
-
2025-08-01historical $900
-
2025-07-31$900
-
2023-06-25historical
-
2020-05-19$65,000
-
2018-01-12soldstatus $48,000
Show marketing remark (332 chars)
4 Bedroom 3 Bath Home on a corner lot in established subdivision in Lafayette. Located near the Martin Luther King, Jr. Center. Playground and recreation center within walking distance.Public Transportation near by. Home needs a little TLC. Lots of space in this home for a large family. Home would also be good investment property.
-
2017-06-29$55,000
Show marketing remark (332 chars)
4 Bedroom 3 Bath Home on a corner lot in established subdivision in Lafayette. Located near the Martin Luther King, Jr. Center. Playground and recreation center within walking distance.Public Transportation near by. Home needs a little TLC. Lots of space in this home for a large family. Home would also be good investment property.
-
2014-05-08soldstatus $15,000
-
2014-01-09$27,900
-
2013-04-18$28,000
-
2013-01-07$50,000
-
2007-08-02soldstatus
-
2006-09-08$85,000
ⓘ Source: listings_history table (triggers on properties + properties_extension) + one-shot
backfill from property_details.listing_events for pre-trigger history.
Tax reassessment forecast LA · Resets to sale price
- Current annual tax
- $624 · $52/mo
- Projected year-2 tax
- $624 · $52/mo
- Expected delta
- $0/yr ($0/mo · 0.0%)
ⓘ Screening estimate from a state-policy table — verify with the county assessor before closing.
Climate risk First Street
- Flood 1/10 Low FEMA zone X (unshaded) · 0% chance over 30 yrs
- Wildfire 3/10 Moderate
- Heat 8/10 Severe 7 d/yr ≥109°F today · 20 d/yr by 30 yrs out
- Wind 9/10 Extreme 99% chance of damaging wind over 30 yrs
- Air quality 2/10 Low 0 unhealthy d/yr today · 1 by 30 yrs out
Nearby sold comps map
Loading sold comps map…
Walkable amenities ~0.75 mi
Loading nearby amenities…
Taxation est. · year 1
- Rental income
- $17,329
- − Mortgage interest
- −$5,041
- − Property taxes
- −$624
- − Insurance
- −$450
- − Repairs & maintenance
- −$1,386
- − Management
- −$1,386
- − Depreciation
- −$2,618
- Taxable income
- $5,822
- Est. tax owed @ 24.0%
- −$1,397
- After-tax cash flow
- $5,554/yr
For passive investors: Depreciation is non-cash, so a rental often shows a tax loss while cash-flowing — sheltering income. Rental losses are passive: they offset passive income freely, and up to $25,000/yr can offset ordinary (W-2) income if you actively participate and your MAGI is under $100k (phasing out to $0 by $150k); unused losses carry forward. On sale, claimed depreciation is recaptured at up to 25%, and gains may owe capital-gains tax (a 1031 exchange can defer both). Figures are a year-1 estimate at your 24.0% rate — not tax advice; consult a CPA.
Schools (NCES district)
- District
- Lafayette Parish
- NCES district ID
- 2200870
- Math proficiency
- 38% ▼ -32.00%
- Reading proficiency
- 46% ▼ -24.00%
- Median HH income
- $50,238
- Composite
- 36.15/100
- National rank
- #4741
- State rank
- #19 of 98 in LA
Livability — Lafayette
- Score
- 70/100
- State rank
- #63
- US rank
- #8133
Category grades
Schools grade is shown separately in the Schools card above.
Census & demographics
- Census place
- Lafayette, LA
- County
- Lafayette Parish · 207,544 people
- City population
- 158,114
- Metro
- Lafayette, LA
- Population (ZIP)
- 26,465
- Household income
- $33,365
- Rent vs Own
- Severe rent burden
- 2089.0
Population outlook (Lafayette County) Hauer SSP2
- Today (2025)
- 280,930 people
- By 2030
- 301,092 · +7.2%
- By 2040
- 339,456 · +20.8%
- By 2050
- 375,156 · +33.5%
- By 2075
- 451,672 · +60.8%
- By 2100
- 497,203 · +77.0%
Race, ethnicity, and origin ACS 2023
- Neighborhood character
- Predominantly Black (73%)
- Race & ethnicity
- Black 73% White 18% Two or more races 6% Hispanic / Latino 4%
- Common ancestry
- Lithuanian 4%
- Foreign-born
- 2% · Canada
- Languages at home
- 95% English-only · Spanish 3% French/Haitian/Cajun 2%
Political lean MEDSL · Lafayette
- 2024 margin
- Solid R (+31.4) · D 33.5% · R 64.8% · Other 1.7%
- 2008→2024 swing
- -0.1pp no change · 2008: -31.3pp · 2024: -31.4pp
- All cycles
- 2024: R+31.4 2020: R+28.7 2016: R+33.6 2012: R+33.7 2008: R+31.3
Not yet ingested
- Civics
- —
Market trends
- HPI YoY
- ▼ -108.63%
- Current HPI
- 81.2963
- Rent YoY
- ▲ 7.35%
- Metro
- Lafayette, LA
- State GDP YoY
- ▲ 3.29%
- F500 in state
- 10
Industry mix (Fortune 500 HQ in LA)
| Industry | F500 HQs | Revenue |
|---|---|---|
| Telecommunications | 2 | $23B |
|
||
| Utilities | 1 | $12B |
|
||
| Wholesale / Distribution | 1 | $5B |
|
||
| Advertising | 1 | $2B |
|
||
Price history
+5.9% since first listed18 events — show timeline
- 2026-05-29 Relisted — AcadianaMLS
- 2026-05-20 Pending — AcadianaMLS
- 2026-05-15 Listed $90,000 AcadianaMLS
- 2026-05-13 Coming Soon $90,000 AcadianaMLS
- 2025-09-23 Rental Removed $900 RAAMLS
- 2025-08-01 Listed for Rent $900 RAAMLS
- 2025-08-01 Rental Removed $900 APPFOLIO
- 2025-07-31 Listed for Rent $900 APPFOLIO
- 2023-06-25 Rental Removed — APPFOLIO
- 2020-05-19 Listed $65,000 AcadianaMLS
- 2018-01-12 Sold (MLS) $48,000 AcadianaMLS
- 2017-06-29 Listed $55,000 AcadianaMLS
- 2014-05-08 Sold (MLS) $15,000 AcadianaMLS
- 2014-01-09 Listed $27,900 AcadianaMLS
- 2013-04-18 Listed $28,000 AcadianaMLS
- 2013-01-07 Listed $50,000 AcadianaMLS
- 2007-08-02 Sold (Public Records) — Public Records
- 2006-09-08 Listed $85,000 AcadianaMLS
Property tax history
-1.8%/yrLatest (2025): $624 · -1.1% YoY. Source: county tax records.
Cash-flow waterfall
monthlySold comps — $/sqft
last 12 mo · ≤1 miLoading sold comps…