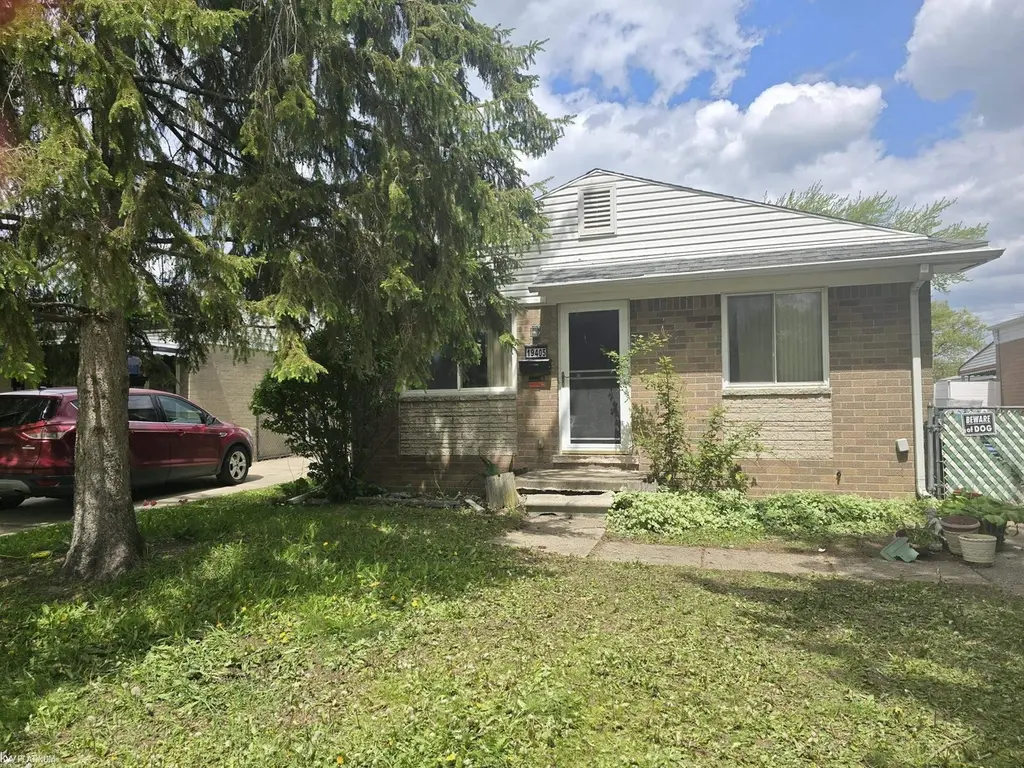
19405 Opal St · Roseville, MI
Flood risk 1/10 · Minimal
- FEMA flood zone
- X (unshaded)
- Chance of flooding over 30 yrs
- 0.0%
- Est. flood insurance / yr
- $473 – $860
Fire risk 1/10 · Minimal
- Est. fire insurance / yr
- $784 – $1,456
Heat risk 3/10 · Minor
- Hot days now (above 96°F)
- 7 days/yr
- Hot days in 30 yrs
- 15 days/yr
Wind risk 1/10 · Minimal
- Chance of severe wind over 30 yrs
- —
Air-quality risk 4/10 · Minor
- Unhealthy air days now
- 4 days/yr
- Unhealthy air days in 30 yrs
- 5 days/yr
Risk factors via First Street. Map © Google.
Why this score? — see what drove the C- grade
The composite is a weighted blend of 9 inputs, each scored 0–100. Each bar is that input's sub-score; the figure is the points it added to the 100-point composite (weight × sub-score).
- Cash flow +18.0/30.0
- ARV discount +15.0/15.0
- DSCR +5.7/10.0
- 1% rule +4.8/10.0
- Rent growth +3.6/5.0
- Livability +3.6/5.0
- Condition / age +2.5/5.0
- Schools +1.2/10.0
- Appreciation +0.0/10.0
$135,000
🖨 Deal sheet 📄 Offer letter ✓ Due diligence
Listing remarks MLS
Check out the price on this all-brick home! Looking to flip, this one just needs cosmetics and cleaning! Updated furnace, vinyl windows, updated electrical, roof 2005 approx. Huge 2.5 car garage with 2 overhead doors. Nice size fenced yard! Close to parks, schools and shopping. Investor Special! Check out the comparables in the neighborhood.
Key facts
- Vinyl windows
- Updated electrical
- Fenced yard
Tags
Property features AI
Finance
- HOA & community: Homeowners association present
Exterior
- Parking: Garage with automatic opener; Approximately 2.5 garage spaces
- Utilities: Public water; Public sewer
- Home design: Single-family residence; One story
- Construction: Brick construction
- Exterior features: Porch; Fenced yard; Paved road access
Interior
- Kitchen: Disposal
- Bedrooms: Total rooms: 5
- Flooring: Hardwood floors
- Bathrooms: 1 full bathroom
- Heating & cooling: Central air conditioning; Forced air heating; Humidity control; Natural gas heating
- Interior features: Eat-in kitchen; Concrete basement
Neighborhood map
What this means for you Summary
Snapshot
- This is a 3-bed/1.0-bath single-family listed at $135k.
Deal economics
- At list price, monthly cash flow is $117 ($1k/yr) — positive.
- The deal already cash-flows at list — no discount required.
- To meet the 1% rule (rent ≥ 1% of price), the offer needs to be $133k (1.7% below list).
- Recommended offer: $133k (1.7% below list) — sets the bar for 1% rule.
- Cap rate 7.3% vs local median 6.0% in Roseville — meaningfully above typical; check what's discounted (condition, days-on-market, listing class) to confirm the premium yield is real.
Location & tenants
- Location reads 72/100 on livability (#258 in MI) — a middle-class / working-renter tenant base. Strengths: commute A+, cost of living A+, housing A+; Watch: health & safety D+, employment D, schools F.
- Clintondale Community Schools (suburban): math 7% / reading 20% proficiency, ranked #506 of 540 in MI (top 94%) — low school quality limits family demand, transient renter base, plan for 1-2y turnover; 74% free/reduced lunch — lower-income household profile, screen leases tightly.
- Market conditions: Rents rising fast (+4.2%/yr); 169 active listings in the ZIP; 9 comparable units currently listed for rent nearby; rentals at typical pace (median 17d on market — plan ~3-4 weeks tenant-placement turnaround); 1,321 units permitted in Macomb County in 2024 (86 in 5+ unit buildings).
Forward outlook
- Local home prices are declining (-3.0%/yr); year-one equity from $933 of loan paydown is wiped out by about $4k of value loss. Plan a longer hold.
- Macomb County population projected at +9% by 2050 — modest demand growth; plan on rents tracking national, not racing it.
Negotiation context
- It's been on market 18 days — a 2% lower offer ($133k) is reasonable based on typical stale-listing flexibility.
- 2 sale attempts; this cycle's ask has dropped $25k (16%) from the opening price — seller is motivated, your offer sets the floor, not the list.
Questions for the listing agent
- Built in 1963 — when were the roof, HVAC, electrical panel, plumbing, and water heater last replaced?
- Is there a deadline driving the sale (1031 exchange, divorce, estate, relocation)? That informs how much negotiation room exists.
- Schools are F-rated, which usually means shorter tenancies and higher turnover. Who's the typical renter profile here, and what's been the actual vacancy rate?
- Crime grade is F in this area — have there been break-ins, vandalism, or insurance claims at this property in the last 3 years? What carrier currently insures it and at what premium?
- What's the average days-on-market for RENTAL listings here right now (not sales)? A rising rental-DOM trend means longer vacancies and softer asking-rent achievability than the comps imply.
- What's the recent tenant-quality profile in this submarket — average credit score on applications, eviction rate, late-payment / NSF rate, and stable-employment percentage? A property-management company in the area should have these aggregated.
- How much new for-sale + rental construction is in the pipeline within 1–3 miles? Heavy new supply typically softens prices + rents 12–24 months out; constrained supply supports both.
Investment metrics
- 1% rule
- 0.98% ✗
- Cap rate
- 7.34%
- Cash-on-cash
- 3.73%
- DSCR
- 1.17
- GRM
- 8.5
CMA / ARV
- ARV (median comp)
- $180,559
- List price
- $135,000
- Delta
- -25.23%
- Verdict
- UNDERPRICED
- Comps
- 20 within 1.0 mi
Show comp detail 12 sales within ~0.75 mi
| Address | Dist | Beds/Ba | Sqft | Sold | Price | $/sf | Match |
|---|---|---|---|---|---|---|---|
| 19405 Opal St | 0.00mi | 3/1.0 | 840 (0%) | 1mo | $133,000 | $158 | 100 |
| 19430 Heckman St | 0.08mi | 3/1.0 | 875 (+4%) | 1mo | $175,000 | $200 | 88 |
| 19557 Webster St | 0.19mi | 3/1.0 | 875 (+4%) | 2mo | $138,000 | $158 | 83 |
| 19573 Heckman St | 0.12mi | 3/1.0 | 875 (+4%) | 8mo | $154,000 | $176 | 81 |
| 19646 Gaynon Dr | 0.16mi | 3/1.0 | 888 (+6%) | 7mo | $165,000 | $186 | 77 |
| 19630 Webster St | 0.24mi | 2/1.0 (-1) | 875 (+4%) | 8mo | $175,000 | $200 | 70 |
| 34740 Beaconsfield St | 0.50mi | 3/1.0 | 816 (-3%) | 2mo | $120,000 | $147 | 70 |
| 33329 Cheryl St | 0.31mi | 3/1.0 | 921 (+10%) | 3mo | $215,000 | $233 | 67 |
| 20222 Abrahm St | 0.66mi | 3/1.0 | 864 (+3%) | 9mo | $155,000 | $179 | 57 |
| 20415 Nicke St | 0.63mi | 3/1.0 | 884 (+5%) | 8mo | $175,000 | $198 | 55 |
| 20158 Williamson St | 0.52mi | 3/1.0 | 925 (+10%) | 8mo | $145,000 | $157 | 52 |
| 20171 Voiland St | 0.74mi | 3/1.0 | 960 (+14%) | 6mo | $202,000 | $210 | 37 |
Match score weights: distance 35% · size 25% · config 20% · recency 20%. Top-matched comps best support the ARV.
Projected returns pro-forma
-3.0% appreciation · 4.25% rent growth · sell at horizon
- IRR
- -9.0%
- Equity multiple
- 0.66×
- Total profit
- $-12,691
- Equity at exit
- $20,129
- IRR
- 2.0%
- Equity multiple
- 1.15×
- Total profit
- $5,766
- Equity at exit
- $11,672
Cash invested: $37,800 (down + closing). Projections, not guarantees.
Landlord ↔ Tenant lean methodology
- Overall (STATE)
- 62 Landlord-Friendly
- State Michigan
- 62 Landlord-Friendly · EVEN
- County
- — inherits STATE
- City
- — inherits STATE
ZIP-level market 48035
- Home prices YoY
- -29.1%
- Rents YoY
- 4.2%
- Active inventory
- 169
- Price-to-rent
- 8.5×
Monthly cashflow live
- Estimated rent
- $1,327 high interval (Pro) →
- Mortgage (P&I)
- −$708
- Tax from tax record
- −$167 /mo · $2,004/yr
- Insurance
- −$56
- HOA
- −$0
- Vacancy / Maint / Mgmt
- −$279
- Net cashflow
- $117
Break-even live
UW: 25.0% down · 7.5% · 30yr · 1.5% tax · 5.0% vac · 8.0% maint · 8.0% mgmt
Financing live
Cash to close
- Down payment
- $33,750
- Closing costs
- $4,050
- Reserves months
- —
- Total cash needed
- —
Loan-product check · same deal, 3 products live
Conventional
25% down · 7.5% · 30yr
- Down + closing
- —
- Monthly P&I
- —
- Monthly cashflow
- —
- DSCR
- —
- Eligible?
- —
Personal DTI + credit; lowest rate.
DSCR
20% down · 8.5% · 30yr
- Down + closing
- —
- Monthly P&I
- —
- Monthly cashflow
- —
- DSCR
- —
- Eligible?
- —
No personal income docs; deal must DSCR.
Hard money
10% down · 12.0% · 12mo
- Down + closing
- —
- Monthly P&I
- —
- Monthly cashflow
- —
- DSCR
- —
- Eligible?
- —
Short-term bridge; refi at stabilization.
Rent comps 9 comps
| Address | Beds | Baths | Sqft | Rent | $/sqft | DOM | Units | Dist |
|---|---|---|---|---|---|---|---|---|
| 18600 14 Mile Rd Fraser, MI | 2.0 | 1.0 | 1070 | $1,195 | $1.12 | 24d | 1 | 0.65mi |
| 20235 Abrahm St Clinton Twp, MI | 3.0 | 1.5 | 978 | $1,600 | $1.64 | 1d | 1 | 0.67mi |
| 35431 Hickory Woods Dr #8 Clinton Township, MI | 2.0 | 1.0 | 786 | $1,250 | $1.59 | 24d | 1 | 0.71mi |
| 34895 Heathmore Dr Clinton Twp, MI | 2.0 | 1.0 | 864 | $925 | $1.07 | 43d | 1 | 0.76mi |
| 35401 Hickory Woods Dr #3 Clinton Township, MI | 2.0 | 1.0 | 775 | $1,250 | $1.61 | 22d | 1 | 0.77mi |
| 19700 Masonic Roseville, MI | 1.0–2.0 | 1.0 | 874 | $1,400 | $1.60 | 2d | 12 | 1.04mi |
| 18391 Masonic Apt 1 Fraser, MI | 2.0 | 1.0 | 720 | $995 | $1.38 | 16d | 1 | 1.14mi |
| 16950 Kennedy Dr E Fraser, MI | 1.0–2.0 | 1.0 | 755 | $1,125 | $1.49 | 15d | 2 | 1.30mi |
| 16951 General Ave Fraser, MI | 2.0 | 1.0 | 900 | $1,250 | $1.39 | 5d | 1 | 1.45mi |
Listing history 2 events
-
2026-05-08$160,000 Active 343-char remark
Show marketing remark (343 chars)
Check out the price on this all-brick home! Looking to flip, this one just needs cosmetics and cleaning! Updated furnace, vinyl windows, updated electrical, roof 2005 approx. Huge 2.5 car garage with 2 overhead doors. Nice size fenced yard! Close to parks, schools and shopping. Investor Special! Check out the comparables in the neighborhood.
ⓘ Source: listings_history table (triggers on properties + properties_extension) + one-shot
backfill from property_details.listing_events for pre-trigger history.
Tax reassessment forecast MI · Partial reset (capped growth)
- Current annual tax
- $2,004 · $167/mo
- Projected year-2 tax
- $2,042 · $170/mo
- Expected delta
- +$37/yr (+$3/mo · 1.9%)
ⓘ Screening estimate from a state-policy table — verify with the county assessor before closing.
Climate risk First Street
- Flood 1/10 Low FEMA zone X (unshaded) · 0% chance over 30 yrs
- Wildfire 1/10 Low
- Heat 3/10 Moderate 7 d/yr ≥96°F today · 15 d/yr by 30 yrs out
- Wind 1/10 Low
- Air quality 4/10 Moderate 4 unhealthy d/yr today · 5 by 30 yrs out
Nearby sold comps map
Loading sold comps map…
Walkable amenities ~0.75 mi
Loading nearby amenities…
Taxation est. · year 1
- Rental income
- $15,928
- − Mortgage interest
- −$7,562
- − Property taxes
- −$2,004
- − Insurance
- −$675
- − Repairs & maintenance
- −$1,274
- − Management
- −$1,274
- − Depreciation
- −$3,927
- Taxable loss
- −$789
- Est. tax savings @ 24.0%
- +$189
- After-tax cash flow
- $1,598/yr
For passive investors: Depreciation is non-cash, so a rental often shows a tax loss while cash-flowing — sheltering income. Rental losses are passive: they offset passive income freely, and up to $25,000/yr can offset ordinary (W-2) income if you actively participate and your MAGI is under $100k (phasing out to $0 by $150k); unused losses carry forward. On sale, claimed depreciation is recaptured at up to 25%, and gains may owe capital-gains tax (a 1031 exchange can defer both). Figures are a year-1 estimate at your 24.0% rate — not tax advice; consult a CPA.
Schools (NCES district)
- District
- Clintondale Community Schools
- NCES district ID
- 2610080
- Math proficiency
- 7% ▼ -6.00%
- Reading proficiency
- 20% ▼ -5.00%
- Median HH income
- $43,253
- Composite
- 11.83/100
- National rank
- #9675
- State rank
- #506 of 540 in MI
Livability — Roseville
- Score
- 72/100
- State rank
- #258
- US rank
- #6400
Category grades
Schools grade is shown separately in the Schools card above.
Census & demographics
- County
- Macomb County · 638,552 people
- City population
- 47,123
- Metro
- Detroit-Warren-Dearborn, MI
- Population (ZIP)
- 33,569
- Household income
- $73,015
- Rent vs Own
- Severe rent burden
- 978.0
Population outlook (Macomb County) Hauer SSP2
- Today (2025)
- 925,296 people
- By 2030
- 948,226 · +2.5%
- By 2040
- 983,961 · +6.3%
- By 2050
- 1,010,200 · +9.2%
- By 2075
- 1,076,222 · +16.3%
- By 2100
- 1,077,065 · +16.4%
Race, ethnicity, and origin ACS 2023
- Neighborhood character
- Predominantly White (68%)
- Race & ethnicity
- White 68% Black 21% Two or more races 6% Hispanic / Latino 4% Asian 2%
- Common ancestry
- Romanian 14% Lithuanian 5% Slovak 2%
- Foreign-born
- 6% · Canada
- Languages at home
- 93% English-only · Spanish 2% Other Indo-European 1% Arabic 1%
Political lean MEDSL · Macomb
- 2024 margin
- R (+13.7) · D 42.2% · R 55.9% · Other 1.9%
- 2008→2024 swing
- -22.3pp toward R · 2008: 8.6pp · 2024: -13.7pp
- All cycles
- 2024: R+13.7 2020: R+8.1 2016: R+11.6 2012: D+4.0 2008: D+8.6
Not yet ingested
- Civics
- —
Market trends
- HPI YoY
- ▼ -148.36%
- Current HPI
- 362.1471
- Rent YoY
- ▲ 4.25%
- Metro
- Detroit-Warren-Dearborn, MI
- State GDP YoY
- ▲ 1.37%
- F500 in state
- 28
Industry mix (Fortune 500 HQ in MI)
| Industry | F500 HQs | Revenue |
|---|---|---|
| Automotive Parts | 3 | $48B |
|
||
| Automotive | 2 | $372B |
|
||
| Chemicals | 1 | $45B |
|
||
| Automotive Retail | 1 | $29B |
|
||
| Healthcare / Medical Devices | 1 | $23B |
|
||
| Automotive Technology | 1 | $20B |
|
||
Price history
-16.9% since first listed8 events — show timeline
- 2026-06-03 Sold (MLS) $133,000 MiRealSource-MiMLS
- 2026-06-03 Sold (MLS) $133,000 REALCOMP
- 2026-05-27 Pending — REALCOMP
- 2026-05-25 Pending — MiRealSource-MiMLS
- 2026-05-22 Price Changed $135,000 MiRealSource-MiMLS
- 2026-05-22 Price Changed $135,000 REALCOMP
- 2026-05-08 Listed $160,000 MiRealSource-MiMLS
- 2026-05-08 Listed $160,000 REALCOMP
Property tax history
+0.9%/yrLatest (2025): $2,004 · +2.9% YoY. Source: county tax records.
Cash-flow waterfall
monthlySold comps — $/sqft
last 12 mo · ≤1 miLoading sold comps…