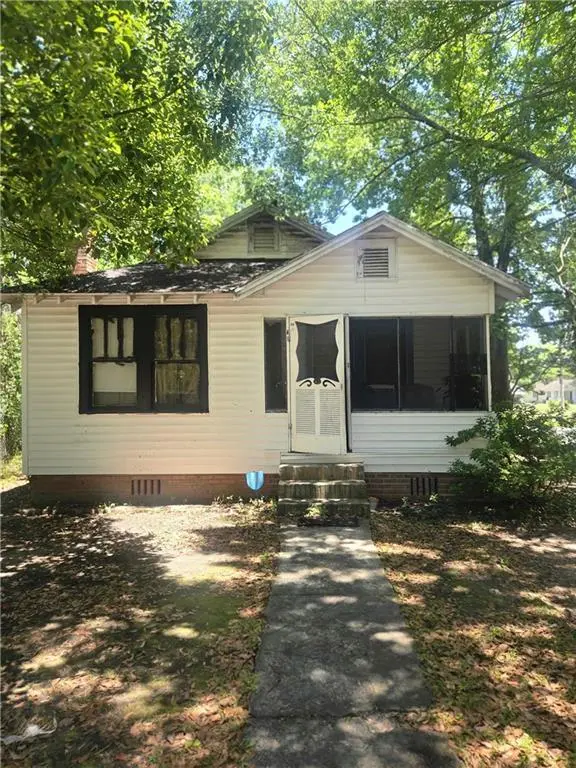
573 Williams St · Mobile, AL
Flood risk 1/10 · Minimal
- FEMA flood zone
- X (unshaded)
- Chance of flooding over 30 yrs
- 0.0%
- Est. flood insurance / yr
- $507 – $1,088
Fire risk 1/10 · Minimal
- Est. fire insurance / yr
- $916 – $1,700
Heat risk 9/10 · Severe
- Hot days now (above 105°F)
- 7 days/yr
- Hot days in 30 yrs
- 21 days/yr
Wind risk 9/10 · Severe
- Chance of severe wind over 30 yrs
- 99.0%
Air-quality risk 2/10 · Minimal
- Unhealthy air days now
- 1 days/yr
- Unhealthy air days in 30 yrs
- 1 days/yr
Risk factors via First Street. Map © Google.
Why this score? — see what drove the B+ grade
The composite is a weighted blend of 9 inputs, each scored 0–100. Each bar is that input's sub-score; the figure is the points it added to the 100-point composite (weight × sub-score).
- Cash flow +30.0/30.0
- ARV discount +15.0/15.0
- 1% rule +10.0/10.0
- DSCR +10.0/10.0
- Rent growth +3.8/5.0
- Livability +3.8/5.0
- Condition / age +2.5/5.0
- Schools +2.3/10.0
- Appreciation +0.0/10.0
$90,000
🖨 Deal sheet (PDF) 📄 Offer letter ✓ Due diligence
Listing remarks
Opportunity awaits with this 3-bedroom, 2-bath home situated on a spacious corner lot! Full of potential and ready for someone with vision, this property is the perfect chance to bring a home back to life and make it your own. Whether you’re an investor, flipper, or buyer looking to add personal touches, this home offers solid bones, a functional layout, and endless possibilities. Out back, you’ll find a large detached garage offering plenty of space for storage, a workshop, parking, or future projects. The corner lot provides added space, curb appeal, and room to create something special. With a little TLC, this property could truly shine again!
Key facts
- Corner lot
- Detached garage
- 7,531 sq ft lot
Tags
Property features AI
Exterior
- Parking: No designated parking
- Utilities: Electricity available; Natural gas available; Public sewer
- Home design: Single Family Residence; Residential property
- Construction: Concrete construction; Built in 1940
- Exterior features: No exterior features listed; No fencing; View present
Interior
- Kitchen: Electric oven; Refrigerator
- Bedrooms: 3 bedrooms
- Flooring: Carpet
- Bathrooms: 2 full bathrooms
- Heating & cooling: Central heating; Central air; Ceiling fan(s)
- Interior features: Fireplace; Other interior features
Neighborhood map
What this means for you Summary
Snapshot
- This is a 3-bed/2.0-bath single-family listed at $90k.
Deal economics
- At list price, monthly cash flow is $554 ($7k/yr) — positive.
- The deal already cash-flows at list — no discount required.
- Meets the 1% rule at list price ($1k rent vs $90k).
- Recommended offer: $87k (3.0% below list) — sets the bar for market timing.
- Cap rate 13.7% vs local median 4.9% in Mobile — top-decile yield for the area; either an underpriced asset or a hidden risk that comps aren't pricing in. Stress-test before assuming the spread holds.
Location & tenants
- Location reads 75/100 on livability (#20 in AL, #4,262 nationally) — a middle-class / working-renter tenant base. Strengths: commute A+, cost of living A+, housing A+; Watch: crime F, employment D-.
- Mobile County (urban): math 15% / reading 39% proficiency, ranked #81 of 129 in AL (top 63%) — low school quality limits family demand, transient renter base, plan for 1-2y turnover; 67% free/reduced lunch — lower-income household profile, screen leases tightly.
- Zoned schools: Maryvale Elementary School (math 5% / reading 25%, grade F, #505 of 627 statewide, top 81%, 494 students, 92% FRL); Murphy High School (math 10% / reading 19%, grade F, #220 of 305 statewide, top 77%, 1,254 students, 66% FRL).
- Zoned-school proficiency averages 15% at this address vs 27% district-wide (-12 pts) — the specific schools serving this property underperform the Mobile County average; the district grade overstates school quality for this exact location.
- Market conditions: Rents rising fast (+5.1%/yr); 174 active listings in the ZIP; 36 comparable units currently listed for rent nearby; rentals lingering (median 45d on market — plan ~5-8 weeks vacancy on turnover, expect pricing pressure); 53% of comp listings sitting > 30 days — soft ceiling on asking rent; 1,678 units permitted in Mobile County in 2024 (264 in 5+ unit buildings).
- This rent runs 32% of the median local income ($51k/yr) — at the standard rent-burdened threshold; future hikes will face affordability resistance.
Forward outlook
- Local home prices are declining (-3.0%/yr); year-one equity from $622 of loan paydown is wiped out by about $3k of value loss. Plan a longer hold.
- Mobile County population projected to shrink 8% by 2050 — rents likely to lag national; underwrite the cash flow, not the appreciation.
- At projected returns (-3.0% appreciation + 5.1% rent growth), your $25k cash investment doubles in ~5 years — after that, you're playing with house money.
Negotiation context
- It's been on market 31 days — a 3% lower offer ($87k) is reasonable based on typical stale-listing flexibility.
Risks & watch-outs
- Watch-outs: built in 1940 — expect roof / HVAC / electrical / plumbing capex.
- Climate carrying-cost: severe wind risk, 99% chance of damaging wind over 30y; extreme-heat days projected 7→21/yr by 2055 (HVAC capex compounding) — expect insurance premiums to compound above CPI over the hold.
Questions for the listing agent
- It's been on market 31 days. Have you received any prior offers? Is the seller open to a 3% concession, seller financing, or rate buy-down credit?
- Built in 1940 — when were the roof, HVAC, electrical panel, plumbing, and water heater last replaced?
- Is there a deadline driving the sale (1031 exchange, divorce, estate, relocation)? That informs how much negotiation room exists.
- Schools are D-rated, which usually means shorter tenancies and higher turnover. Who's the typical renter profile here, and what's been the actual vacancy rate?
- Crime grade is F in this area — have there been break-ins, vandalism, or insurance claims at this property in the last 3 years? What carrier currently insures it and at what premium?
- What's the average days-on-market for RENTAL listings here right now (not sales)? A rising rental-DOM trend means longer vacancies and softer asking-rent achievability than the comps imply.
- What's the recent tenant-quality profile in this submarket — average credit score on applications, eviction rate, late-payment / NSF rate, and stable-employment percentage? A property-management company in the area should have these aggregated.
- How much new for-sale + rental construction is in the pipeline within 1–3 miles? Heavy new supply typically softens prices + rents 12–24 months out; constrained supply supports both.
Investment metrics
- 1% rule
- 1.53% ✓
- Cap rate
- 13.68%
- Cash-on-cash
- 26.38%
- DSCR
- 2.17
- GRM
- 5.4
CMA / ARV
- ARV (on-the-fly)
- $153,216
- Comps found
- 12
Show comp detail 12 sales within ~0.75 mi
| Address | Dist | Beds/Ba | Sqft | Sold | Price | $/sf | Match |
|---|---|---|---|---|---|---|---|
| 603 Glenwood St | 0.15mi | 3/1.0 | 1,400 (+4%) | 4mo | $137,000 | $98 | 79 |
| 1809 Calmes St | 0.36mi | 4/2.0 (+1) | 1,420 (+6%) | 0mo | $45,000 | $32 | 69 |
| 1017 Houston St | 0.44mi | 3/2.0 | 1,435 (+7%) | 3mo | $24,900 | $17 | 65 |
| 710 Euclid Ave | 0.36mi | 3/2.0 | 1,222 (-9%) | 4mo | $139,000 | $114 | 65 |
| 417 Crenshaw St | 0.30mi | 4/1.0 (+1) | 1,426 (+6%) | 3mo | $48,000 | $34 | 64 |
| 1805 Woodcock Pl | 0.51mi | 3/2.0 | 1,233 (-8%) | 4mo | $195,000 | $158 | 59 |
| 503 Dauphin Island Pkwy | 0.19mi | 2/1.0 (-1) | 1,159 (-14%) | 3mo | $40,500 | $35 | 57 |
| 1809 Woodcock Pl | 0.50mi | 3/2.0 | 1,210 (-10%) | 4mo | $195,000 | $161 | 56 |
| 2258 Howell Ave | 0.64mi | 3/1.0 | 1,264 (-6%) | 2mo | $145,000 | $115 | 54 |
| 616 Morgan Ave | 0.49mi | 3/2.0 | 1,150 (-14%) | 3mo | $42,000 | $37 | 51 |
| 1910 Hunter Ave | 0.65mi | 3/2.5 | 1,462 (+9%) | 4mo | $310,000 | $212 | 50 |
| 210 Houston St | 0.67mi | 2/1.0 (-1) | 1,182 (-12%) | 2mo | $155,000 | $131 | 38 |
Match score weights: distance 35% · size 25% · config 20% · recency 20%. Top-matched comps best support the ARV.
Projected returns pro-forma
-3.0% appreciation · 5.06% rent growth · sell at horizon
- IRR
- 22.3%
- Equity multiple
- 1.94×
- Total profit
- $23,582
- Equity at exit
- $13,419
- IRR
- 31.5%
- Equity multiple
- 4.11×
- Total profit
- $78,328
- Equity at exit
- $7,782
Cash invested: $25,200 (down + closing). Projections, not guarantees.
Landlord ↔ Tenant lean methodology
- Overall (STATE)
- 90 Strongly Landlord-Friendly
- State Alabama
- 90 Strongly Landlord-Friendly · R+15
- County
- — inherits STATE
- City
- — inherits STATE
ZIP-level market 36606
- Rents YoY
- 5.1%
- Active inventory
- 174
- Price-to-rent
- 5.4×
Monthly cashflow live
- Estimated rent
- $1,380 high interval (Pro) →
- Mortgage (P&I)
- −$472
- Tax from tax record
- −$27 /mo · $323/yr
- Insurance
- −$38
- HOA
- −$0
- Vacancy / Maint / Mgmt
- −$290
- Net cashflow
- $554
Break-even live
Sensitivity live
| Price | -10% $605 | -5% $579 | +0% $554 | +5% $528 | +10% $503 |
|---|---|---|---|---|---|
| Rent | -10% $445 | -5% $499 | +0% $554 | +5% $608 | +10% $663 |
| Rate | -1.0pp $599 | -0.5pp $577 | base $554 | +0.5pp $531 | +1.0pp $507 |
UW: 25.0% down · 7.5% · 30yr · 1.5% tax · 5.0% vac · 8.0% maint · 8.0% mgmt
Financing live
Cash to close
- Down payment
- $22,500
- Closing costs
- $2,700
- Reserves months
- —
- Total cash needed
- —
Loan-product check · same deal, 3 products live
Conventional
25% down · 7.5% · 30yr
- Down + closing
- —
- Monthly P&I
- —
- Monthly cashflow
- —
- DSCR
- —
- Eligible?
- —
Personal DTI + credit; lowest rate.
DSCR
20% down · 8.5% · 30yr
- Down + closing
- —
- Monthly P&I
- —
- Monthly cashflow
- —
- DSCR
- —
- Eligible?
- —
No personal income docs; deal must DSCR.
Hard money
10% down · 12.0% · 12mo
- Down + closing
- —
- Monthly P&I
- —
- Monthly cashflow
- —
- DSCR
- —
- Eligible?
- —
Short-term bridge; refi at stabilization.
Rent comps 36 comps
| Address | Beds | Baths | Sqft | Rent | $/sqft | DOM | Units | Dist |
|---|---|---|---|---|---|---|---|---|
| 611 Dauphin Island Pkwy Mobile, AL | 3.0 | 2.0 | 1450 | $1,300 | $0.90 | 44d | 1 | 0.08mi |
| 561 Dauphin Island Pkwy Mobile, AL | 4.0 | 2.0 | 1389 | $1,050 | $0.76 | 44d | 1 | 0.10mi |
| 562 Clarke St Mobile, AL | 2.0 | 1.0 | 1061 | $1,025 | $0.97 | 44d | 1 | 0.22mi |
| 706 Cherokee St Mobile, AL | 3.0 | 1.0 | 1260 | $1,375 | $1.09 | 22d | 1 | 0.29mi |
| 618 Clarke St Mobile, AL | 3.0 | 1.0 | 1427 | $1,200 | $0.84 | 44d | 1 | 0.30mi |
| 615 Mohawk St Mobile, AL | 3.0 | 1.0 | 1172 | $1,500 | $1.28 | 44d | 1 | 0.31mi |
| 2008 W Victory Dr Mobile, AL | 3.0 | 1.0 | 1011 | $1,200 | $1.19 | 44d | 1 | 0.49mi |
| 2068 Victory Ct Mobile, AL | 4.0 | 1.0 | 1259 | $1,225 | $0.97 | 44d | 1 | 0.62mi |
| 209 S Fulton St Mobile, AL | 2.0 | 1.5 | 1255 | $1,750 | $1.39 | 22d | 1 | 0.66mi |
| 182 Williams St Unit 1043570P Mobile, AL | 3.0 | 1.0 | 1399 | $2,476 | $1.77 | 14d | 1 | 0.68mi |
| 713 Iris Ave Mobile, AL | 3.0 | 1.0 | 1617 | $1,300 | $0.80 | 22d | 1 | 0.74mi |
| 817 Hawkins St Mobile, AL | 3.0 | 1.0 | 1217 | $1,200 | $0.99 | 44d | 1 | 0.76mi |
| 122 Demouy Ave Unit 1/2 Mobile, AL | 2.0 | 1.0 | 1300 | $1,530 | $1.18 | 44d | 1 | 0.80mi |
| 900 Courtney St Mobile, AL | 2.0 | 1.0 | 1020 | $1,200 | $1.18 | 44d | 1 | 0.90mi |
| 2503 Richard Ave Mobile, AL | 2.0 | 1.0 | 928 | $805 | $0.87 | 14d | 1 | 0.96mi |
| 1660 Laurel St Mobile, AL | 3.0 | 2.0 | 1768 | $2,200 | $1.24 | 14d | 1 | 1.00mi |
| 2507 Taylor Ave Mobile, AL | 3.0 | 1.0 | 1230 | $1,495 | $1.22 | 14d | 1 | 1.02mi |
| 104 Ellinor St Mobile, AL | 2.0 | 1.0 | 896 | $1,275 | $1.42 | 22d | 1 | 1.02mi |
| 2656 Pathway Pl Mobile, AL | 2.0–3.0 | 1.0 | 778 | $1,261 | $1.62 | 14d | 9 | 1.04mi |
| 418 Durande Dr Mobile, AL | 3.0 | 2.0 | 1456 | $1,350 | $0.93 | 14d | 1 | 1.08mi |
| 200 S Florida St Unit 101 Mobile, AL | 2.0 | 2.0 | 1150 | $1,375 | $1.20 | 22d | 1 | 1.09mi |
| 1704 McGill Ave Unit B Mobile, AL | 3.0 | 2.5 | 1500 | $1,750 | $1.17 | 44d | 1 | 1.14mi |
| 107 Macy Pl Mobile, AL | 3.0 | 2.0 | 1800 | $2,250 | $1.25 | 44d | 1 | 1.17mi |
| 955 Cloverdale Dr Mobile, AL | 3.0 | 1.5 | 1128 | $1,125 | $1.00 | 44d | 1 | 1.19mi |
| 1417 Monroe St Mobile, AL | 2.0 | 1.0 | 1064 | $1,350 | $1.27 | 44d | 1 | 1.25mi |
| 84 S Lafayette St Unit 1043577P Mobile, AL | 3.0 | 2.0 | 1496 | $3,116 | $2.08 | 14d | 1 | 1.26mi |
| 111 S Catherine St Mobile, AL | 2.0 | 1.0 | 891 | $899 | $1.01 | 44d | 1 | 1.27mi |
| 461 Magnolia Rd Unit A Mobile, AL | 2.0 | 1.0 | 989 | $825 | $0.83 | 44d | 1 | 1.31mi |
| 1204 Seneca St Mobile, AL | 3.0 | 2.0 | 1425 | $1,345 | $0.94 | 14d | 1 | 1.36mi |
| 315 Hadrian St Mobile, AL | 3.0 | 2.0 | 1843 | $1,800 | $0.98 | 44d | 1 | 1.37mi |
| 2425 Nortons Ln Unit C Mobile, AL | 2.0 | 1.0 | 1050 | $1,200 | $1.14 | 44d | 1 | 1.38mi |
| 2425 Nortons Ln Unit D Mobile, AL | 2.0 | 1.0 | 1050 | $1,100 | $1.05 | 14d | 1 | 1.38mi |
| 129 Shell Road Pl Unit 1043713P Mobile, AL | 4.0 | 2.0 | 1496 | $3,389 | $2.27 | 22d | 1 | 1.42mi |
| 1566 Dauphin St Unit Back Carriage House Mobile, AL | 3.0 | 1.0 | 1300 | $1,200 | $0.92 | 44d | 1 | 1.43mi |
| 168 W Collins St Mobile, AL | 3.0 | 1.0 | 968 | $725 | $0.75 | 22d | 1 | 1.47mi |
| 107 Grand Blvd Mobile, AL | 2.0 | 2.0 | 1200 | $1,295 | $1.08 | 22d | 1 | 1.48mi |
Listing history 17 events
-
2026-06-18days on market $90,000 Active 31 DOM
-
2026-06-17days on market $90,000 Active 30 DOM
-
2026-06-16days on market $90,000 Active 29 DOM
-
2026-06-15days on market $90,000 Active 28 DOM
-
2026-06-14days on market $90,000 Active 26 DOM
-
2026-06-13days on market $90,000 Active 25 DOM
-
2026-06-10days on market $90,000 Active 23 DOM
-
2026-06-09days on market $90,000 Active 22 DOM
-
2026-06-08days on market $90,000 Active 21 DOM
-
2026-06-07days on market $90,000 Active 20 DOM
-
2026-06-05pricedays on market $90,000 Active 17 DOM
-
2026-06-03days on market $100,000 Active 16 DOM
-
2026-06-02days on market $100,000 Active 15 DOM
-
2026-06-01days on market $100,000 Active 14 DOM
-
2026-05-31days on market $100,000 Active 13 DOM
-
2026-05-30days on market $100,000 Active 12 DOM
-
2026-05-18$100,000 Active
ⓘ Source: listings_history table (triggers on properties + properties_extension) + one-shot
backfill from property_details.listing_events for pre-trigger history.
Tax reassessment forecast AL · Resets to sale price
- Current annual tax
- $323 · $27/mo
- Projected year-2 tax
- $369 · $31/mo
- Expected delta
- +$46/yr (+$4/mo · 14.2%)
ⓘ Screening estimate from a state-policy table — verify with the county assessor before closing.
Climate risk First Street
- Flood 1/10 Low FEMA zone X (unshaded) · 0% chance over 30 yrs
- Wildfire 1/10 Low
- Heat 9/10 Extreme 7 d/yr ≥105°F today · 21 d/yr by 30 yrs out
- Wind 9/10 Extreme 99% chance of damaging wind over 30 yrs
- Air quality 2/10 Low 1 unhealthy d/yr today · 1 by 30 yrs out
Nearby sold comps map
Loading sold comps map…
Walkable amenities ~0.75 mi
Loading nearby amenities…
Taxation est. · year 1
- Rental income
- $16,561
- − Mortgage interest
- −$5,041
- − Property taxes
- −$323
- − Insurance
- −$450
- − Repairs & maintenance
- −$1,325
- − Management
- −$1,325
- − Depreciation
- −$2,618
- Taxable income
- $5,479
- Est. tax owed @ 24.0%
- −$1,315
- After-tax cash flow
- $5,332/yr
For passive investors: Depreciation is non-cash, so a rental often shows a tax loss while cash-flowing — sheltering income. Rental losses are passive: they offset passive income freely, and up to $25,000/yr can offset ordinary (W-2) income if you actively participate and your MAGI is under $100k (phasing out to $0 by $150k); unused losses carry forward. On sale, claimed depreciation is recaptured at up to 25%, and gains may owe capital-gains tax (a 1031 exchange can defer both). Figures are a year-1 estimate at your 24.0% rate — not tax advice; consult a CPA.
Schools (NCES district)
- District
- Mobile County
- NCES district ID
- 0102370
- Math proficiency
- 15% ▼ -28.00%
- Reading proficiency
- 39% ▬ 0.00%
- Median HH income
- $42,455
- Composite
- 22.9/100
- National rank
- #8002
- State rank
- #81 of 129 in AL
Livability — Mobile
- Score
- 75/100
- State rank
- #20
- US rank
- #4262
Category grades
Schools grade is shown separately in the Schools card above.
Census & demographics
- Census place
- Mobile, AL
- County
- Mobile County · 246,577 people
- City population
- 205,729
- Metro
- Mobile, AL
- Population (ZIP)
- 18,728
- Household income
- $51,303
- Rent vs Own
- Severe rent burden
- 999.0
Population outlook (Mobile County) Hauer SSP2
- Today (2025)
- 415,303 people
- By 2030
- 411,755 · -0.9%
- By 2040
- 399,670 · -3.8%
- By 2050
- 382,616 · -7.9%
- By 2075
- 337,353 · -18.8%
- By 2100
- 283,391 · -31.8%
Race, ethnicity, and origin ACS 2023
- Neighborhood character
- Majority Black (56%)
- Race & ethnicity
- Black 56% White 37% Two or more races 5% Hispanic / Latino 4%
- Common ancestry
- Italian 2% Scottish 2% Lithuanian 1%
- Foreign-born
- 3% · Canada
- Languages at home
- 96% English-only · Spanish 3%
Political lean MEDSL · Mobile
- 2024 margin
- R (+16.4) · D 41.3% · R 57.7%
- 2008→2024 swing
- -7.7pp toward R · 2008: -8.7pp · 2024: -16.4pp
- All cycles
- 2024: R+16.4 2020: R+11.9 2016: R+13.9 2012: R+9.3 2008: R+8.7
Not yet ingested
- Civics
- —
Market trends
- HPI YoY
- ▼ -232.19%
- Current HPI
- 145.9025
- Rent YoY
- ▲ 5.06%
- Metro
- Mobile, AL
- State GDP YoY
- ▲ 2.94%
- F500 in state
- 4
Industry mix (Fortune 500 HQ in AL)
| Industry | F500 HQs | Revenue |
|---|---|---|
| Financial Services | 1 | $8B |
|
||
| Healthcare | 1 | $5B |
|
||
Price history
1 event — show timeline
- 2026-05-18 Listed $100,000 GCMLS AL
Cash-flow waterfall
monthlySold comps — $/sqft
last 12 mo · ≤1 miLoading sold comps…