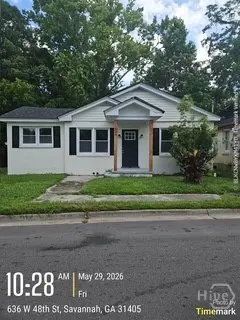
636 W 48th St · Savannah, GA
Flood risk 1/10 · Minimal
- FEMA flood zone
- X (unshaded)
- Chance of flooding over 30 yrs
- 0.0%
- Est. flood insurance / yr
- $507 – $1,088
Fire risk 1/10 · Minimal
- Est. fire insurance / yr
- $963 – $1,789
Heat risk 9/10 · Severe
- Hot days now (above 108°F)
- 7 days/yr
- Hot days in 30 yrs
- 18 days/yr
Wind risk 9/10 · Severe
- Chance of severe wind over 30 yrs
- 99.0%
Air-quality risk 5/10 · Moderate
- Unhealthy air days now
- 7 days/yr
- Unhealthy air days in 30 yrs
- 8 days/yr
Risk factors via First Street. Map © Google.
Why this score? — see what drove the C grade
The composite is a weighted blend of 9 inputs, each scored 0–100. Each bar is that input's sub-score; the figure is the points it added to the 100-point composite (weight × sub-score).
- Cash flow +21.0/30.0
- ARV discount +15.0/15.0
- DSCR +6.7/10.0
- 1% rule +4.9/10.0
- Livability +4.3/5.0
- Condition / age +2.5/5.0
- Rent growth +2.3/5.0
- Schools +2.0/10.0
- Appreciation +0.0/10.0
$195,000
🖨 Deal sheet (PDF) 📄 Offer letter ✓ Due diligence
Listing remarks
Renovated, three bedroom, two bath home, built in 1945. This is a perfect home for a first time buyer or an investor looking for a rental property to add to their portfolio.
Key facts
- 3,642 sq ft lot
- Garage
- Built 1945
Property features AI
Exterior
- Parking: Has garage
- Utilities: Public water; Public sewer
- Home design: Single-family residence; One story
- Construction: Block construction
- Exterior features: Lot in R6 zoning; Located off Florance St.; Subdivision: Colding Ward
Interior
- Bathrooms: 2 full bathrooms
- Heating & cooling: Central heating (electric); Central air conditioning (electric)
- Interior features: Electric water heater
- Laundry & utility: Washer hookup; Laundry located in kitchen; Separate laundry room
Neighborhood map
What this means for you Summary
Snapshot
- This is a 3-bed/2.0-bath single-family listed at $195k.
Deal economics
- At list price, monthly cash flow is $274 ($3k/yr) — positive.
- The deal already cash-flows at list — no discount required.
- To meet the 1% rule (rent ≥ 1% of price), the offer needs to be $193k (1.0% below list).
- Recommended offer: $192k (1.5% below list) — sets the bar for market timing.
- Cap rate 8.0% vs local median 4.0% in Savannah — top-decile yield for the area; either an underpriced asset or a hidden risk that comps aren't pricing in. Stress-test before assuming the spread holds.
Location & tenants
- Location reads 86/100 on livability (#1 in GA, #397 nationally) — a professional / high-income tenant draw. Strengths: crime A+, amenities A+, commute A+; Watch: employment D, schools F.
- Savannah-Chatham County (urban): math 20% / reading 26% proficiency, ranked #134 of 174 in GA (top 77%) — low school quality limits family demand, transient renter base, plan for 1-2y turnover.
- Market conditions: Rents soft (-0.7%/yr); 276 active listings in the ZIP; 40 comparable units currently listed for rent nearby; rentals at typical pace (median 25d on market — plan ~3-4 weeks tenant-placement turnaround); 45% of comp listings sitting > 30 days — soft ceiling on asking rent; 2,694 units permitted in Chatham County in 2024 (973 in 5+ unit buildings).
- This rent runs 35% of the median local income ($66k/yr) — at the standard rent-burdened threshold; future hikes will face affordability resistance.
Forward outlook
- Local home prices are declining (-3.0%/yr); year-one equity from $1k of loan paydown is wiped out by about $6k of value loss. Plan a longer hold.
- Chatham County population projected at +33% by 2050 — long-run rental-demand tailwind backs the buy-and-hold thesis.
Negotiation context
- It's been on market 23 days — a 2% lower offer ($192k) is reasonable based on typical stale-listing flexibility.
- 7 sale attempts since 2y ago with the ask held roughly flat each time — persistent listings suggest the price (not the market) is what's stuck; bring a comps-based counter.
- Current owner paid $129k; list at $195k implies a 51% gain — meaningful room to come down on a strong offer.
Risks & watch-outs
- Watch-outs: built in 1945 — expect roof / HVAC / electrical / plumbing capex.
- Climate carrying-cost: severe wind risk, 99% chance of damaging wind over 30y; extreme-heat days projected 7→18/yr by 2055 (HVAC capex compounding) — expect insurance premiums to compound above CPI over the hold.
Questions for the listing agent
- Built in 1945 — when were the roof, HVAC, electrical panel, plumbing, and water heater last replaced?
- Is there a deadline driving the sale (1031 exchange, divorce, estate, relocation)? That informs how much negotiation room exists.
- Schools are F-rated, which usually means shorter tenancies and higher turnover. Who's the typical renter profile here, and what's been the actual vacancy rate?
- What's the average days-on-market for RENTAL listings here right now (not sales)? A rising rental-DOM trend means longer vacancies and softer asking-rent achievability than the comps imply.
- What's the recent tenant-quality profile in this submarket — average credit score on applications, eviction rate, late-payment / NSF rate, and stable-employment percentage? A property-management company in the area should have these aggregated.
- How much new for-sale + rental construction is in the pipeline within 1–3 miles? Heavy new supply typically softens prices + rents 12–24 months out; constrained supply supports both.
Investment metrics
- 1% rule
- 0.99% ✗
- Cap rate
- 7.98%
- Cash-on-cash
- 6.03%
- DSCR
- 1.27
- GRM
- 8.4
CMA / ARV
- ARV (on-the-fly)
- $277,722
- Comps found
- 12
Show comp detail 12 sales within ~0.75 mi
| Address | Dist | Beds/Ba | Sqft | Sold | Price | $/sf | Match |
|---|---|---|---|---|---|---|---|
| 705 W 47th St | 0.04mi | 3/2.0 | 1,231 (-2%) | 10mo | $239,975 | $195 | 87 |
| 601 W 45th St | 0.17mi | 3/2.0 | 1,323 (+6%) | 7mo | $344,900 | $261 | 77 |
| 905 W 41st St | 0.36mi | 3/1.0 | 1,264 (+1%) | 5mo | $125,000 | $99 | 74 |
| 705 W 44th St | 0.19mi | 3/1.0 | 1,144 (-9%) | 2mo | $95,000 | $83 | 71 |
| 808 W 53rd St | 0.30mi | 3/2.0 | 1,170 (-6%) | 6mo | $260,000 | $222 | 70 |
| 623 W 45th St | 0.14mi | 3/2.0 | 1,378 (+10%) | 8mo | $305,000 | $221 | 70 |
| 106 W 52nd St | 0.39mi | 3/2.0 | 1,323 (+6%) | 8mo | $385,000 | $291 | 66 |
| 922 W 42nd St | 0.41mi | 3/2.0 | 1,380 (+10%) | 6mo | $250,000 | $181 | 58 |
| 819 W 42nd St | 0.34mi | 3/2.0 | 1,104 (-12%) | 9mo | $250,000 | $226 | 57 |
| 603 W 42nd St | 0.31mi | 3/2.0 | 1,080 (-14%) | 9mo | $247,000 | $229 | 55 |
| 627 W 35th St | 0.70mi | 3/1.0 | 1,301 (+4%) | 7mo | $189,000 | $145 | 51 |
| 3903 Crane St | 0.54mi | 2/2.0 (-1) | 1,072 (-14%) | 2mo | $263,800 | $246 | 44 |
Match score weights: distance 35% · size 25% · config 20% · recency 20%. Top-matched comps best support the ARV.
Projected returns pro-forma
-3.0% appreciation · 0.0% rent growth · sell at horizon
- IRR
- -10.2%
- Equity multiple
- 0.64×
- Total profit
- $-19,810
- Equity at exit
- $29,075
- IRR
- -5.4%
- Equity multiple
- 0.69×
- Total profit
- $-16,731
- Equity at exit
- $16,860
Cash invested: $54,600 (down + closing). Projections, not guarantees.
Landlord ↔ Tenant lean methodology
- Overall (STATE)
- 90 Strongly Landlord-Friendly
- State Georgia
- 90 Strongly Landlord-Friendly · R+3
- County
- — inherits STATE
- City
- — inherits STATE
ZIP-level market 31405
- Home prices YoY
- -32.4%
- Rents YoY
- -0.7%
- Active inventory
- 276
- Price-to-rent
- 8.4×
Monthly cashflow live
- Estimated rent
- $1,930 high interval (Pro) →
- Mortgage (P&I)
- −$1,023
- Tax from tax record
- −$146 /mo · $1,757/yr
- Insurance
- −$81
- HOA
- −$0
- Vacancy / Maint / Mgmt
- −$405
- Net cashflow
- $274
Break-even live
Sensitivity live
| Price | -10% $385 | -5% $330 | +0% $274 | +5% $219 | +10% $164 |
|---|---|---|---|---|---|
| Rent | -10% $122 | -5% $198 | +0% $274 | +5% $351 | +10% $427 |
| Rate | -1.0pp $373 | -0.5pp $324 | base $274 | +0.5pp $224 | +1.0pp $172 |
UW: 25.0% down · 7.5% · 30yr · 1.5% tax · 5.0% vac · 8.0% maint · 8.0% mgmt
Financing live
Cash to close
- Down payment
- $48,750
- Closing costs
- $5,850
- Reserves months
- —
- Total cash needed
- —
Loan-product check · same deal, 3 products live
Conventional
25% down · 7.5% · 30yr
- Down + closing
- —
- Monthly P&I
- —
- Monthly cashflow
- —
- DSCR
- —
- Eligible?
- —
Personal DTI + credit; lowest rate.
DSCR
20% down · 8.5% · 30yr
- Down + closing
- —
- Monthly P&I
- —
- Monthly cashflow
- —
- DSCR
- —
- Eligible?
- —
No personal income docs; deal must DSCR.
Hard money
10% down · 12.0% · 12mo
- Down + closing
- —
- Monthly P&I
- —
- Monthly cashflow
- —
- DSCR
- —
- Eligible?
- —
Short-term bridge; refi at stabilization.
Rent comps 40 comps
| Address | Beds | Baths | Sqft | Rent | $/sqft | DOM | Units | Dist |
|---|---|---|---|---|---|---|---|---|
| 628 W 48th St Savannah, GA | 3.0 | 1.0 | 975 | $1,699 | $1.74 | 15d | 1 | 0.02mi |
| 607 W 44th St Unit B Savannah, GA | 3.0 | 1.0 | 1050 | $1,650 | $1.57 | 45d | 1 | 0.20mi |
| 1003 W 46th St Savannah, GA | 3.0 | 1.0 | 1100 | $1,625 | $1.48 | 15d | 1 | 0.25mi |
| 906 W Victory Dr Savannah, GA | 3.0 | 2.0 | 1176 | $2,400 | $2.04 | 25d | 1 | 0.31mi |
| 2705 Stevens St Savannah, GA | 3.0 | 1.0 | 900 | $1,585 | $1.76 | 45d | 1 | 0.33mi |
| 1005 W Victory Dr Savannah, GA | 3.0 | 2.0 | 1056 | $1,950 | $1.85 | 25d | 1 | 0.34mi |
| 2613 Montgomery St Unit B303 Savannah, GA | 2.0 | 2.0 | 879 | $3,472 | $3.95 | 45d | 1 | 0.34mi |
| 119 W 52nd St Savannah, GA | 2.0 | 1.0 | 1020 | $1,800 | $1.76 | 45d | 1 | 0.35mi |
| 1004 W 53rd St Savannah, GA | 3.0 | 2.0 | 1700 | $2,300 | $1.35 | 45d | 1 | 0.36mi |
| 1014 W 53rd St Savannah, GA | 3.0 | 2.0 | 1048 | $1,600 | $1.53 | 15d | 1 | 0.37mi |
| 310 W 42nd St Savannah, GA | 3.0 | 2.0 | 1300 | $1,800 | $1.38 | 45d | 1 | 0.41mi |
| 2604 Jefferson St Savannah, GA | 2.0 | 1.0 | 910 | $1,900 | $2.09 | 45d | 1 | 0.41mi |
| 216 W 43rd St Savannah, GA | 3.0 | 3.0 | 1722 | $2,900 | $1.68 | 25d | 1 | 0.42mi |
| 601 W 54th St Savannah, GA | 1.0–4.0 | 1.0–2.0 | 881 | $1,633 | $1.85 | 25d | 1 | 0.43mi |
| 12 W 51st St Savannah, GA | 2.0 | 1.0 | 932 | $2,500 | $2.68 | 25d | 1 | 0.44mi |
| 3211 Bull St Unit A Savannah, GA | 2.0 | 1.0 | 1000 | $1,975 | $1.98 | 45d | 1 | 0.45mi |
| 3301 Bull St Unit 4 Savannah, GA | 2.0 | 1.0 | 1000 | $1,750 | $1.75 | 25d | 1 | 0.46mi |
| 1026 W 41st St Savannah, GA | 3.0 | 1.0 | 1128 | $1,500 | $1.33 | 15d | 1 | 0.47mi |
| 1011 W 40th St Savannah, GA | 3.0 | 2.0 | 1125 | $1,995 | $1.77 | 15d | 1 | 0.47mi |
| 1109 W 41st St Savannah, GA | 3.0 | 1.0 | 960 | $1,620 | $1.69 | 45d | 1 | 0.48mi |
| 4 W 53rd St Unit 4 Savannah, GA | 2.0 | 1.0 | 960 | $1,400 | $1.46 | 45d | 1 | 0.49mi |
| 2221 Harden St Savannah, GA | 3.0 | 1.0 | 1000 | $1,550 | $1.55 | 45d | 1 | 0.49mi |
| 2910 Bull St Savannah, GA | 3.0 | 2.0 | 1200 | $3,500 | $2.92 | 45d | 1 | 0.50mi |
| 2 W 53rd St #3 Savannah, GA | 2.0 | 1.0 | 1122 | $1,750 | $1.56 | 45d | 1 | 0.50mi |
| 3601 Bull St Apt 3 Savannah, GA | 3.0 | 2.0 | 1386 | $1,825 | $1.32 | 45d | 1 | 0.51mi |
| 3601 Bull St Unit 2 Savannah, GA | 3.0 | 2.0 | 1386 | $1,900 | $1.37 | 45d | 1 | 0.51mi |
| 2203 Harden St Unit A Savannah, GA | 3.0 | 1.0 | 900 | $2,100 | $2.33 | 15d | 1 | 0.51mi |
| 20 W 54th St Savannah, GA | 2.0 | 1.0 | 950 | $1,200 | $1.26 | 25d | 1 | 0.51mi |
| 211 W 40th St Unit B Savannah, GA | 3.0 | 1.0 | 1400 | $3,200 | $2.29 | 25d | 1 | 0.51mi |
| 3605 Bull St #2 Savannah, GA | 3.0 | 2.0 | 1408 | $1,695 | $1.20 | 45d | 1 | 0.51mi |
| 3605 Bull St Unit 3 Savannah, GA | 3.0 | 2.0 | 1408 | $1,600 | $1.14 | 25d | 1 | 0.51mi |
| 714 W 38th St Savannah, GA | 3.0 | 1.5 | 1200 | $1,650 | $1.38 | 25d | 1 | 0.52mi |
| 2123 Harden St Savannah, GA | 2.0 | 1.0 | 1000 | $1,550 | $1.55 | 25d | 1 | 0.52mi |
| 620 W 38th St Unit B Savannah, GA | 2.0 | 1.0 | 1076 | $1,600 | $1.49 | 45d | 1 | 0.54mi |
| 630 W 38th St Savannah, GA | 3.0 | 2.0 | 1600 | $1,950 | $1.22 | 15d | 1 | 0.54mi |
| 118 W 56th St Savannah, GA | 2.0 | 1.0 | 936 | $1,625 | $1.74 | 15d | 1 | 0.55mi |
| 516 W 38th St Unit 1/2 Savannah, GA | 3.0 | 1.0 | 1176 | $1,600 | $1.36 | 25d | 1 | 0.55mi |
| 516 W 38th St Unit 1/2 Savannah, GA | 3.0 | 1.0 | 1176 | $1,500 | $1.28 | 15d | 1 | 0.55mi |
| 213 W 39th St Unit B Savannah, GA | 3.0 | 2.0 | 1000 | $2,250 | $2.25 | 25d | 1 | 0.56mi |
| 601 W 37th St Unit B Savannah, GA | 2.0 | 2.0 | 1300 | $2,000 | $1.54 | 45d | 1 | 0.58mi |
Listing history 18 events
-
2026-06-21days on market $195,000 Active 23 DOM
-
2026-06-18days on market $195,000 Active 20 DOM
-
2026-06-17days on market $195,000 Active 19 DOM
-
2026-06-16days on market $195,000 Active 18 DOM
-
2026-06-15days on market $195,000 Active 17 DOM
-
2026-06-14days on market $195,000 Active 15 DOM
-
2026-06-13days on market $195,000 Active 14 DOM
-
2026-06-10days on market $195,000 Active 12 DOM
-
2026-06-09days on market $195,000 Active 11 DOM
-
2026-06-08days on market $195,000 Active 10 DOM
-
2026-06-07days on market $195,000 Active 9 DOM
-
2026-06-05days on market $195,000 Active 6 DOM
-
2026-06-03days on market $195,000 Active 5 DOM
-
2026-06-02days on market $195,000 Active 4 DOM
-
2026-06-01days on market $195,000 Active 3 DOM
-
2026-05-31days on market $195,000 Active 2 DOM
-
2026-05-30remarks 173-char remark
-
2026-05-30$195,000 Active 1 DOM
ⓘ Source: listings_history table (triggers on properties + properties_extension) + one-shot
backfill from property_details.listing_events for pre-trigger history.
Tax reassessment forecast GA · Resets to sale price
- Current annual tax
- $1,757 · $146/mo
- Projected year-2 tax
- $1,794 · $150/mo
- Expected delta
- +$37/yr (+$3/mo · 2.1%)
ⓘ Screening estimate from a state-policy table — verify with the county assessor before closing.
Climate risk First Street
- Flood 1/10 Low FEMA zone X (unshaded) · 0% chance over 30 yrs
- Wildfire 1/10 Low
- Heat 9/10 Extreme 7 d/yr ≥108°F today · 18 d/yr by 30 yrs out
- Wind 9/10 Extreme 99% chance of damaging wind over 30 yrs
- Air quality 5/10 Major 7 unhealthy d/yr today · 8 by 30 yrs out
Nearby sold comps map
Loading sold comps map…
Walkable amenities ~0.75 mi
Loading nearby amenities…
Taxation est. · year 1
- Rental income
- $23,160
- − Mortgage interest
- −$10,923
- − Property taxes
- −$1,757
- − Insurance
- −$975
- − Repairs & maintenance
- −$1,853
- − Management
- −$1,853
- − Depreciation
- −$5,673
- Taxable income
- $126
- Est. tax owed @ 24.0%
- −$30
- After-tax cash flow
- $3,262/yr
For passive investors: Depreciation is non-cash, so a rental often shows a tax loss while cash-flowing — sheltering income. Rental losses are passive: they offset passive income freely, and up to $25,000/yr can offset ordinary (W-2) income if you actively participate and your MAGI is under $100k (phasing out to $0 by $150k); unused losses carry forward. On sale, claimed depreciation is recaptured at up to 25%, and gains may owe capital-gains tax (a 1031 exchange can defer both). Figures are a year-1 estimate at your 24.0% rate — not tax advice; consult a CPA.
Schools (NCES district)
- District
- Savannah-Chatham County
- NCES district ID
- 1301020
- Math proficiency
- 20% ▼ -11.00%
- Reading proficiency
- 26% ▼ -5.00%
- Median HH income
- $47,443
- Composite
- 20.14/100
- National rank
- #8639
- State rank
- #134 of 174 in GA
Livability — Savannah
- Score
- 86/100
- State rank
- #1
- US rank
- #397
Category grades
Schools grade is shown separately in the Schools card above.
Census & demographics
- Census place
- Savannah, GA
- County
- Chatham County · 271,602 people
- City population
- 216,564
- Metro
- Savannah, GA
- Population (ZIP)
- 40,764
- Household income
- $65,710
- Rent vs Own
- Severe rent burden
- 1712.0
Population outlook (Chatham County) Hauer SSP2
- Today (2025)
- 332,584 people
- By 2030
- 355,508 · +6.9%
- By 2040
- 400,030 · +20.3%
- By 2050
- 443,019 · +33.2%
- By 2075
- 534,579 · +60.7%
- By 2100
- 583,863 · +75.6%
Race, ethnicity, and origin ACS 2023
- Neighborhood character
- Diverse neighborhood (Simpson 0.63)
- Race & ethnicity
- Black 47% White 38% Hispanic / Latino 8% Two or more races 6% Asian 3%
- Hispanic origin (detail)
- Mexican 3% Puerto Rican 1%
- Common ancestry
- Italian 1% Slovak 1% Romanian 1%
- Foreign-born
- 7% · Canada, China, Jamaica
- Languages at home
- 88% English-only · Spanish 6% Other Indo-European 2% Chinese 1%
Political lean MEDSL · Chatham
- 2024 margin
- D (+18.0) · D 58.6% · R 40.6%
- 2008→2024 swing
- +3.6pp toward D · 2008: 14.4pp · 2024: 18.0pp
- All cycles
- 2024: D+18.0 2020: D+18.8 2016: D+14.5 2012: D+12.0 2008: D+14.4
Not yet ingested
- Civics
- —
Market trends
- HPI YoY
- ▼ -147.33%
- Current HPI
- 307.4442
- Rent YoY
- ▼ -0.66%
- Metro
- Savannah, GA
- State GDP YoY
- ▲ 2.66%
- F500 in state
- 28
Industry mix (Fortune 500 HQ in GA)
| Industry | F500 HQs | Revenue |
|---|---|---|
| Paper / Packaging | 2 | $29B |
|
||
| Retail | 1 | $160B |
|
||
| Transportation / Logistics | 1 | $91B |
|
||
| Airlines | 1 | $62B |
|
||
| Consumer Goods | 1 | $47B |
|
||
| Utilities | 1 | $25B |
|
||
Price history
+680.0% since first listed23 events — show timeline
- 2026-05-29 Listed $195,000 Hive MLS
- 2026-04-07 Listing Removed — Hive MLS
- 2026-03-29 Contingent — Hive MLS
- 2026-03-27 Relisted — Hive MLS
- 2026-03-27 Price Changed $199,900 Hive MLS
- 2026-03-10 Contingent — Hive MLS
- 2026-02-10 Listed $214,900 Hive MLS
- 2026-02-09 Listing Removed — Hive MLS
- 2026-02-03 Price Changed $229,900 Hive MLS
- 2026-01-26 Price Changed $239,900 Hive MLS
- 2026-01-19 Price Changed $244,900 Hive MLS
- 2026-01-07 Price Changed $249,900 Hive MLS
- 2025-12-09 Listed $255,000 Hive MLS
- 2025-12-08 Rental Removed $1,900 SMLC
- 2025-11-19 Price Changed $1,900 SMLC
- 2025-10-28 Listed for Rent $2,050 SMLC
- 2025-10-11 Listing Removed — Hive MLS
- 2025-07-11 Listed $244,900 Hive MLS
- 2024-03-01 Sold (Public Records) $129,000 Public Records
- 2024-02-28 Sold (MLS) $129,000 Hive MLS
- 2024-01-11 Listed $134,900 Hive MLS
- 2023-09-01 Sold (Public Records) $57,809 Public Records
- 1978-06-01 Sold (Public Records) $25,000 Public Records
Property tax history
+23.8%/yrLatest (2025): $1,757 · +2174.7% YoY. Source: county tax records.
Cash-flow waterfall
monthlySold comps — $/sqft
last 12 mo · ≤1 miLoading sold comps…