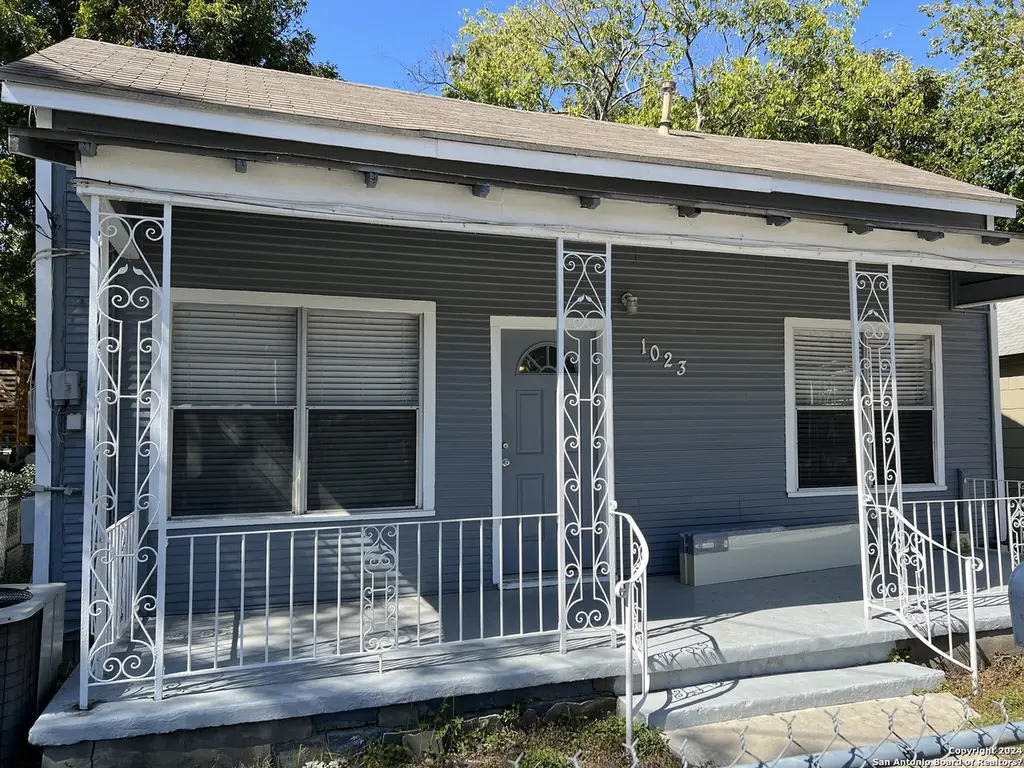
1023 Cherry · San Antonio, TX
Flood risk 4/10 · Minor
- FEMA flood zone
- X (unshaded)
- Chance of flooding over 30 yrs
- 0.22%
- Est. flood insurance / yr
- $507 – $1,088
Fire risk 1/10 · Minimal
- Est. fire insurance / yr
- $1,222 – $2,270
Heat risk 8/10 · Major
- Hot days now (above 108°F)
- 7 days/yr
- Hot days in 30 yrs
- 22 days/yr
Wind risk 6/10 · Moderate
- Chance of severe wind over 30 yrs
- 77.0%
Air-quality risk 2/10 · Minimal
- Unhealthy air days now
- 1 days/yr
- Unhealthy air days in 30 yrs
- 2 days/yr
Risk factors via First Street. Map © Google.
Why this score? — see what drove the D grade
The composite is a weighted blend of 9 inputs, each scored 0–100. Each bar is that input's sub-score; the figure is the points it added to the 100-point composite (weight × sub-score).
- Appreciation +10.0/10.0
- ARV discount +9.8/15.0
- Cash flow +6.5/30.0
- Rent growth +4.5/5.0
- Livability +4.0/5.0
- Condition / age +2.5/5.0
- 1% rule +2.1/10.0
- Schools +1.4/10.0
- DSCR +0.7/10.0
$275,000
🖨 Deal sheet (PDF) 📄 Offer letter ✓ Due diligence
Listing remarks MLS
Three bedroom, two bath house with great trees in Dignowity Hill Historic District. Minutes from the Pearl Brewery and just two blocks from the new skateboard sports park. Gas Cooking, central AC and heat and gated backyard. Many attractive new builds nearby. 1023 Cherry is adjacent and also for sale. The two homes/lots can be purchased together or separately. Seller will consider owner financing.
Key facts
- Gated backyard
- Gas cooking
- Central ac and heat
Tags
Neighborhood map
What this means for you Summary
Snapshot
- This is a 3-bed/1.5-bath single-family listed at $275k.
Deal economics
- At list price, monthly cash flow is $-469 ($-6k/yr) — negative.
- To cash-flow at today's rent, offer at most $192k (30.1% below list).
- To meet the 1% rule (rent ≥ 1% of price), the offer needs to be $194k (29.3% below list).
- Recommended offer: $192k (30.1% below list) — sets the bar for cash-flow.
Location & tenants
- Location reads 80/100 on livability (#31 in TX, #1,616 nationally) — a professional / high-income tenant draw. Strengths: amenities A+, commute A+, cost of living A+; Watch: crime F.
- San Antonio ISD (urban): math 12% / reading 22% proficiency, ranked #805 of 826 in TX (top 98%) — low school quality limits family demand, transient renter base, plan for 1-2y turnover; 80% free/reduced lunch — lower-income household profile, screen leases tightly.
- Zoned schools: Bowden Academy (math 10% / reading 18%, grade F, #4,127 of 4,322 statewide, top 96%, 477 students, 94% FRL, charter); Brackenridge H S (math 12% / reading 25%, grade F, #1,436 of 1,632 statewide, top 88%, 1,568 students, 88% FRL).
- Market conditions: Rents rising fast (+8.2%/yr); 201 active listings in the ZIP; 40 comparable units currently listed for rent nearby; rentals at typical pace (median 26d on market — plan ~3-4 weeks tenant-placement turnaround); 8,308 units permitted in Bexar County in 2024 (2,506 in 5+ unit buildings).
- At $1,943/mo this rent would consume 49% of the median local household income ($47k/yr) (locally 543% of renters already pay >50% of income on rent) — very limited rent-growth headroom before tenants either downsize or default.
Forward outlook
- In year one you build about $29k of equity ($2k loan paydown + $28k appreciation (10.0% local appreciation)).
- Bexar County population projected at +50% by 2050 — long-run rental-demand tailwind backs the buy-and-hold thesis.
- By year 2, paydown + projected appreciation supports a ~$47k cash-out refi (75% LTV) — recoverable capital for the next deal without selling this one.
Negotiation context
- It's been on market 104 days — a 9% lower offer ($250k) is reasonable based on typical stale-listing flexibility.
- 3 sale attempts since 20y ago with the ask held roughly flat each time — persistent listings suggest the price (not the market) is what's stuck; bring a comps-based counter.
Risks & watch-outs
- Watch-outs: built in 1930 — expect roof / HVAC / electrical / plumbing capex.
- Climate carrying-cost: major wind risk, 77% chance of damaging wind over 30y; extreme-heat days projected 7→22/yr by 2055 (HVAC capex compounding) — expect insurance premiums to compound above CPI over the hold.
Questions for the listing agent
- What do current leases actually rent for vs. the listed asking? Can we see a recent rent roll and the last 12 months of T-12 income?
- It's been on market 104 days. Have you received any prior offers? Is the seller open to a 30% concession, seller financing, or rate buy-down credit?
- Built in 1930 — when were the roof, HVAC, electrical panel, plumbing, and water heater last replaced?
- Why hasn't it sold? Are there any deal-killer items the seller is aware of (foundation, flood, title, zoning, code violations)?
- Is there a deadline driving the sale (1031 exchange, divorce, estate, relocation)? That informs how much negotiation room exists.
- Crime grade is F in this area — have there been break-ins, vandalism, or insurance claims at this property in the last 3 years? What carrier currently insures it and at what premium?
- The area grade is low — what's the realistic commute time and amenity access for the typical tenant pool here? Any planned neighborhood developments (good or bad) we should know about?
- What's the average days-on-market for RENTAL listings here right now (not sales)? A rising rental-DOM trend means longer vacancies and softer asking-rent achievability than the comps imply.
- What's the recent tenant-quality profile in this submarket — average credit score on applications, eviction rate, late-payment / NSF rate, and stable-employment percentage? A property-management company in the area should have these aggregated.
- How much new for-sale + rental construction is in the pipeline within 1–3 miles? Heavy new supply typically softens prices + rents 12–24 months out; constrained supply supports both.
Investment metrics
- 1% rule
- 0.71% ✗
- Cap rate
- 4.25%
- Cash-on-cash
- -7.31%
- DSCR
- 0.67
- GRM
- 11.8
CMA / ARV
- ARV (median comp)
- $289,897
- List price
- $275,000
- Delta
- -5.14%
- Verdict
- FAIR
- Comps
- 20 within 1.0 mi
Show comp detail 12 sales within ~0.75 mi
| Address | Dist | Beds/Ba | Sqft | Sold | Price | $/sf | Match |
|---|---|---|---|---|---|---|---|
| 1007 N Cherry St | 0.04mi | 2/2.0 (-1) | 996 (-3%) | 14mo | $169,000 | $170 | 75 |
| 815 Burnet St | 0.45mi | 2/1.0 (-1) | 1,000 (-2%) | 0mo | $299,900 | $300 | 68 |
| 415 Hays St #1 | 0.22mi | 2/1.0 (-1) | 1,000 (-2%) | 22mo | $469,900 | $470 | 60 |
| 905 N Mesquite St | 0.15mi | 2/1.0 (-1) | 965 (-6%) | 19mo | $295,000 | $306 | 60 |
| 132 Sharer | 0.51mi | 3/1.0 | 1,098 (+7%) | 4mo | $120,000 | $109 | 59 |
| 204 Gorman | 0.67mi | 2/2.0 (-1) | 1,054 (+3%) | 3mo | $245,000 | $232 | 54 |
| 215 Quitman | 0.66mi | 2/1.5 (-1) | 1,008 (-2%) | 12mo | $219,990 | $218 | 52 |
| 418 Muncey | 0.59mi | 2/1.0 (-1) | 936 (-9%) | 8mo | $165,000 | $176 | 44 |
| 1118 Hays St | 0.75mi | 2/1.0 (-1) | 944 (-8%) | 14mo | $200,000 | $212 | 33 |
| 1820 E Houston St | 0.73mi | 3/2.0 | 1,132 (+10%) | 16mo | $275,000 | $243 | 33 |
| 425 N Pine St | 0.71mi | 3/2.0 | 1,112 (+9%) | 22mo | $125,000 | $112 | 32 |
| 610 Mason St | 0.75mi | 2/2.0 (-1) | 1,093 (+7%) | 23mo | $224,900 | $206 | 27 |
Match score weights: distance 35% · size 25% · config 20% · recency 20%. Top-matched comps best support the ARV.
Projected returns pro-forma
10.0% appreciation · 8.0% rent growth · sell at horizon
- IRR
- 20.6%
- Equity multiple
- 2.69×
- Total profit
- $130,263
- Equity at exit
- $247,742
- IRR
- 19.9%
- Equity multiple
- 6.62×
- Total profit
- $432,721
- Equity at exit
- $534,265
Cash invested: $77,000 (down + closing). Projections, not guarantees.
Landlord ↔ Tenant lean methodology
- Overall (STATE)
- 87 Strongly Landlord-Friendly
- State Texas
- 87 Strongly Landlord-Friendly · R+5
- County
- — inherits STATE
- City
- — inherits STATE
ZIP-level market 78202
- Home prices YoY
- 27.0%
- Rents YoY
- 8.2%
- Active inventory
- 201
- Price-to-rent
- 11.8×
Monthly cashflow live
- Estimated rent
- $1,943 high interval (Pro) →
- Mortgage (P&I)
- −$1,442
- Tax from tax record
- −$447 /mo · $5,369/yr
- Insurance
- −$115
- HOA
- −$0
- Vacancy / Maint / Mgmt
- −$408
- Net cashflow
- $-469
Break-even live
Sensitivity live
| Price | -10% $-313 | -5% $-391 | +0% $-469 | +5% $-547 | +10% $-625 |
|---|---|---|---|---|---|
| Rent | -10% $-623 | -5% $-546 | +0% $-469 | +5% $-392 | +10% $-315 |
| Rate | -1.0pp $-331 | -0.5pp $-399 | base $-469 | +0.5pp $-540 | +1.0pp $-613 |
UW: 25.0% down · 7.5% · 30yr · 1.5% tax · 5.0% vac · 8.0% maint · 8.0% mgmt
Financing live
Cash to close
- Down payment
- $68,750
- Closing costs
- $8,250
- Reserves months
- —
- Total cash needed
- —
Loan-product check · same deal, 3 products live
Conventional
25% down · 7.5% · 30yr
- Down + closing
- —
- Monthly P&I
- —
- Monthly cashflow
- —
- DSCR
- —
- Eligible?
- —
Personal DTI + credit; lowest rate.
DSCR
20% down · 8.5% · 30yr
- Down + closing
- —
- Monthly P&I
- —
- Monthly cashflow
- —
- DSCR
- —
- Eligible?
- —
No personal income docs; deal must DSCR.
Hard money
10% down · 12.0% · 12mo
- Down + closing
- —
- Monthly P&I
- —
- Monthly cashflow
- —
- DSCR
- —
- Eligible?
- —
Short-term bridge; refi at stabilization.
Rent comps 40 comps
| Address | Beds | Baths | Sqft | Rent | $/sqft | DOM | Units | Dist |
|---|---|---|---|---|---|---|---|---|
| 1021 N Alamo St San Antonio, TX | 2.0 | 1.0 | 1202 | $2,000 | $1.66 | 45d | 1 | 0.22mi |
| 1123 N Olive St San Antonio, TX | 2.0 | 1.0 | 840 | $1,600 | $1.90 | 26d | 1 | 0.24mi |
| 1221 Broadway San Antonio, TX | 2.0 | 1.0–2.0 | 851 | $2,390 | $2.81 | 0d | 10 | 0.31mi |
| 704 N Cherry St Unit 704 San Antonio, TX | 2.0 | 2.5 | 1200 | $1,800 | $1.50 | 45d | 1 | 0.32mi |
| 111 W Jones Ave San Antonio, TX | 2.0 | 1.0–2.0 | 773 | $2,689 | $3.48 | 3d | 17 | 0.36mi |
| 891 Avenue B San Antonio, TX | 2.0 | 2.0 | 1053 | $1,777 | $1.69 | 45d | 1 | 0.39mi |
| 1606 N Hackberry St #102 San Antonio, TX | 2.0 | 2.5 | 1474 | $2,500 | $1.70 | 13d | 1 | 0.40mi |
| 1542 N Alamo St San Antonio, TX | 1.0–2.0 | 1.0–2.0 | 852 | $2,000 | $2.35 | 6d | 2 | 0.41mi |
| 1542 N Alamo St San Antonio, TX | 2.0 | 2.0 | 1013 | $2,485 | $2.45 | 45d | 1 | 0.41mi |
| 120 9th St San Antonio, TX | 1.0–2.0 | 1.0–2.0 | 923 | $2,054 | $2.22 | 0d | 22 | 0.42mi |
| 603 N Mesquite St San Antonio, TX | 3.0 | 2.5 | 1333 | $1,750 | $1.31 | 26d | 1 | 0.44mi |
| 122 Roy Smith St San Antonio, TX | 3.0 | 1.0–3.0 | 996 | $3,299 | $3.31 | 0d | 17 | 0.46mi |
| 821 Burleson San Antonio, TX | 2.0 | 2.5 | 1456 | $1,629 | $1.12 | 45d | 1 | 0.50mi |
| 431 N Mesquite St San Antonio, TX | 3.0 | 2.0 | 1220 | $1,750 | $1.43 | 17d | 1 | 0.54mi |
| 503 Avenue A San Antonio, TX | 2.0 | 1.0–2.0 | 906 | $3,495 | $3.86 | 0d | 57 | 0.56mi |
| 1203 Austin St San Antonio, TX | 1.0–2.0 | 1.0–2.0 | 933 | $2,698 | $2.89 | 0d | 42 | 0.56mi |
| 201 E Carson St Unit 2 San Antonio, TX | 2.0 | 2.0 | 927 | $2,500 | $2.70 | 45d | 1 | 0.56mi |
| 1121 Willow St San Antonio, TX | 2.0 | 1.0 | 900 | $1,000 | $1.11 | 45d | 1 | 0.59mi |
| 1800 Broadway St San Antonio, TX | 2.0 | 1.0–2.5 | 1100 | $2,734 | $2.49 | 0d | 41 | 0.59mi |
| 330 E Carson St Unit 3103 San Antonio, TX | 2.0 | 2.5 | 1398 | $2,170 | $1.55 | 45d | 1 | 0.59mi |
| 330 E Carson St Unit 3103 San Antonio, TX | 2.0 | 2.5 | 1398 | $1,890 | $1.35 | 26d | 1 | 0.59mi |
| 330 E Carson St Unit 1201 San Antonio, TX | 2.0 | 2.0 | 1215 | $1,650 | $1.36 | 26d | 1 | 0.59mi |
| 330 E Carson St San Antonio, TX | 2.0 | 2.0 | 1398 | $1,890 | $1.35 | 22d | 1 | 0.59mi |
| 330 E Carson St Unit 2103 San Antonio, TX | 3.0 | 3.0 | 1428 | $1,930 | $1.35 | 26d | 1 | 0.59mi |
| 330 E Carson St Unit 2103 San Antonio, TX | 3.0 | 3.0 | 1428 | $2,215 | $1.55 | 45d | 1 | 0.59mi |
| 330 E Carson St San Antonio, TX | 2.0 | 2.0 | 1398 | $1,890 | $1.35 | 24d | 1 | 0.59mi |
| 312 Pearl Pkwy San Antonio, TX | 1.0–2.0 | 1.5–2.0 | 1118 | $6,475 | $5.79 | 45d | 4 | 0.63mi |
| 410 E Carson St Unit 3 San Antonio, TX | 2.0 | 1.5 | 900 | $1,800 | $2.00 | 45d | 1 | 0.63mi |
| 1116 Muncey St Unit 1 San Antonio, TX | 3.0 | 2.0 | 896 | $1,600 | $1.79 | 45d | 1 | 0.68mi |
| 1116 Muncey St Unit 2 San Antonio, TX | 3.0 | 2.0 | 896 | $1,500 | $1.67 | 18d | 1 | 0.68mi |
| 1915 Broadway Unit 710 San Antonio, TX | 2.0 | 2.0 | 1134 | $2,058 | $1.81 | 0d | 1 | 0.69mi |
| 1219 Muncey San Antonio, TX | 2.0 | 2.0 | 944 | $1,350 | $1.43 | 26d | 1 | 0.71mi |
| 1102 Burleson San Antonio, TX | 3.0 | 2.0 | 1400 | $2,500 | $1.79 | 26d | 1 | 0.72mi |
| 819 E Grayson St San Antonio, TX | 1.0–2.0 | 1.0 | 825 | $999 | $1.21 | 26d | 4 | 0.72mi |
| 831 E Grayson St San Antonio, TX | 2.0 | 1.0 | 787 | $999 | $1.27 | 17d | 4 | 0.74mi |
| 511 N Monumental San Antonio, TX | 2.0 | 2.0 | 1206 | $1,595 | $1.32 | 6d | 1 | 0.74mi |
| 118 Canadian St San Antonio, TX | 3.0 | 2.0 | 1232 | $2,300 | $1.87 | 45d | 1 | 0.74mi |
| 914 E Josephine St San Antonio, TX | 2.0 | 2.5 | 1420 | $2,450 | $1.73 | 45d | 1 | 0.75mi |
| 215 Center St #307 San Antonio, TX | 2.0 | 2.0 | 1424 | $2,350 | $1.65 | 26d | 1 | 0.76mi |
| 215 Center St #307 San Antonio, TX | 2.0 | 2.0 | 1424 | $2,350 | $1.65 | 22d | 1 | 0.76mi |
Listing history 22 events
-
2026-06-21days on market $275,000 Active 104 DOM
-
2026-06-18days on market $275,000 Active 101 DOM
-
2026-06-17days on market $275,000 Active 100 DOM
-
2026-06-16days on market $275,000 Active 99 DOM
-
2026-06-15days on market $275,000 Active 98 DOM
-
2026-06-13days on market $275,000 Active 96 DOM
-
2026-06-09days on market $275,000 Active 92 DOM
-
2026-06-08days on market $275,000 Active 91 DOM
-
2026-06-07days on market $275,000 Active 90 DOM
-
2026-06-04days on market $275,000 Active 87 DOM
-
2026-06-03days on market $275,000 Active 86 DOM
-
2026-06-02days on market $275,000 Active 85 DOM
-
2026-06-01days on market $275,000 Active 84 DOM
-
2026-05-31days on market $275,000 Active 83 DOM
-
2026-03-08$275,000 New 400-char remark
Show marketing remark (400 chars)
Three bedroom, two bath house with great trees in Dignowity Hill Historic District. Minutes from the Pearl Brewery and just two blocks from the new skateboard sports park. Gas Cooking, central AC and heat and gated backyard. Many attractive new builds nearby. 1023 Cherry is adjacent and also for sale. The two homes/lots can be purchased together or separately. Seller will consider owner financing.
-
2022-04-01soldstatus
-
2021-12-20historical
-
2021-09-29$242,500 New
-
2006-07-05soldstatus
-
2006-06-29soldstatus
-
2006-06-07historical
-
2006-03-21$35,000
ⓘ Source: listings_history table (triggers on properties + properties_extension) + one-shot
backfill from property_details.listing_events for pre-trigger history.
Tax reassessment forecast TX · Resets to sale price
- Current annual tax
- $5,369 · $447/mo
- Projected year-2 tax
- $5,369 · $447/mo
- Expected delta
- $0/yr ($0/mo · 0.0%)
ⓘ Screening estimate from a state-policy table — verify with the county assessor before closing.
Climate risk First Street
- Flood 4/10 Moderate FEMA zone X (unshaded) · 22% chance over 30 yrs
- Wildfire 1/10 Low
- Heat 8/10 Severe 7 d/yr ≥108°F today · 22 d/yr by 30 yrs out
- Wind 6/10 Major 77% chance of damaging wind over 30 yrs
- Air quality 2/10 Low 1 unhealthy d/yr today · 2 by 30 yrs out
Nearby sold comps map
Loading sold comps map…
Walkable amenities ~0.75 mi
Loading nearby amenities…
Taxation est. · year 1
- Rental income
- $23,318
- − Mortgage interest
- −$15,404
- − Property taxes
- −$5,369
- − Insurance
- −$1,375
- − Repairs & maintenance
- −$1,865
- − Management
- −$1,865
- − Depreciation
- −$8,000
- Taxable loss
- −$10,561
- Est. tax savings @ 24.0%
- +$2,535
- After-tax cash flow
- $-3,093/yr
For passive investors: Depreciation is non-cash, so a rental often shows a tax loss while cash-flowing — sheltering income. Rental losses are passive: they offset passive income freely, and up to $25,000/yr can offset ordinary (W-2) income if you actively participate and your MAGI is under $100k (phasing out to $0 by $150k); unused losses carry forward. On sale, claimed depreciation is recaptured at up to 25%, and gains may owe capital-gains tax (a 1031 exchange can defer both). Figures are a year-1 estimate at your 24.0% rate — not tax advice; consult a CPA.
Schools (NCES district)
- District
- San Antonio ISD
- NCES district ID
- 4838730
- Math proficiency
- 12% ▼ -21.00%
- Reading proficiency
- 22% ▼ -7.00%
- Median HH income
- $30,952
- Composite
- 13.57/100
- National rank
- #9512
- State rank
- #805 of 826 in TX
Livability — San Antonio
- Score
- 80/100
- State rank
- #31
- US rank
- #1616
Category grades
Schools grade is shown separately in the Schools card above.
Census & demographics
- Census place
- San Antonio, TX
- County
- Bexar County · 1,990,555 people
- City population
- 1,806,925
- Metro
- San Antonio-New Braunfels, TX
- Population (ZIP)
- 10,224
- Household income
- $47,478
- Rent vs Own
- Severe rent burden
- 543.0
Population outlook (Bexar County) Hauer SSP2
- Today (2025)
- 2,336,851 people
- By 2030
- 2,560,728 · +9.6%
- By 2040
- 3,020,569 · +29.3%
- By 2050
- 3,493,522 · +49.5%
- By 2075
- 4,668,459 · +99.8%
- By 2100
- 5,533,242 · +136.8%
Race, ethnicity, and origin ACS 2023
- Neighborhood character
- Predominantly Hispanic (66%)
- Race & ethnicity
- Hispanic / Latino 66% Two or more races 28% White 17% Black 16% Native American 1%
- Hispanic origin (detail)
- Mexican 57% Puerto Rican 1% Cuban 1%
- Common ancestry
- Italian 2% Slovak 1%
- Foreign-born
- 14% · Canada
- Languages at home
- 59% English-only · Spanish 41%
Political lean MEDSL · Bexar
- 2024 margin
- Lean D (+9.8) · D 54.3% · R 44.6% · Other 1.1%
- 2008→2024 swing
- +4.2pp toward D · 2008: 5.6pp · 2024: 9.8pp
- All cycles
- 2024: D+9.8 2020: D+18.2 2016: D+13.5 2012: D+4.6 2008: D+5.6
Not yet ingested
- Civics
- —
Market trends
- HPI YoY
- ▲ 53.82%
- Current HPI
- 253.3196
- Rent YoY
- ▲ 8.20%
- Metro
- San Antonio-New Braunfels, TX
- State GDP YoY
- ▲ 3.95%
- F500 in state
- 110
Industry mix (Fortune 500 HQ in TX)
| Industry | F500 HQs | Revenue |
|---|---|---|
| Energy | 16 | $1,198B |
|
||
| Technology | 5 | $198B |
|
||
| Engineering / Construction | 4 | $72B |
|
||
| Energy Services | 3 | $60B |
|
||
| Utilities | 3 | $41B |
|
||
| Healthcare | 2 | $330B |
|
||
Price history
+685.7% since first listed8 events — show timeline
- 2026-03-08 Listed $275,000 LERA
- 2022-04-01 Sold (Public Records) — Public Records
- 2021-12-20 Listing Removed — LERA
- 2021-09-29 Listed $242,500 LERA
- 2006-07-05 Sold (Public Records) — Public Records
- 2006-06-29 Sold (MLS) — LERA
- 2006-06-07 Listing Removed — LERA
- 2006-03-21 Listed $35,000 LERA
Property tax history
+12.6%/yrLatest (2025): $5,369 · -4.3% YoY. Source: county tax records.
Cash-flow waterfall
monthlySold comps — $/sqft
last 12 mo · ≤1 miLoading sold comps…