 Duplex
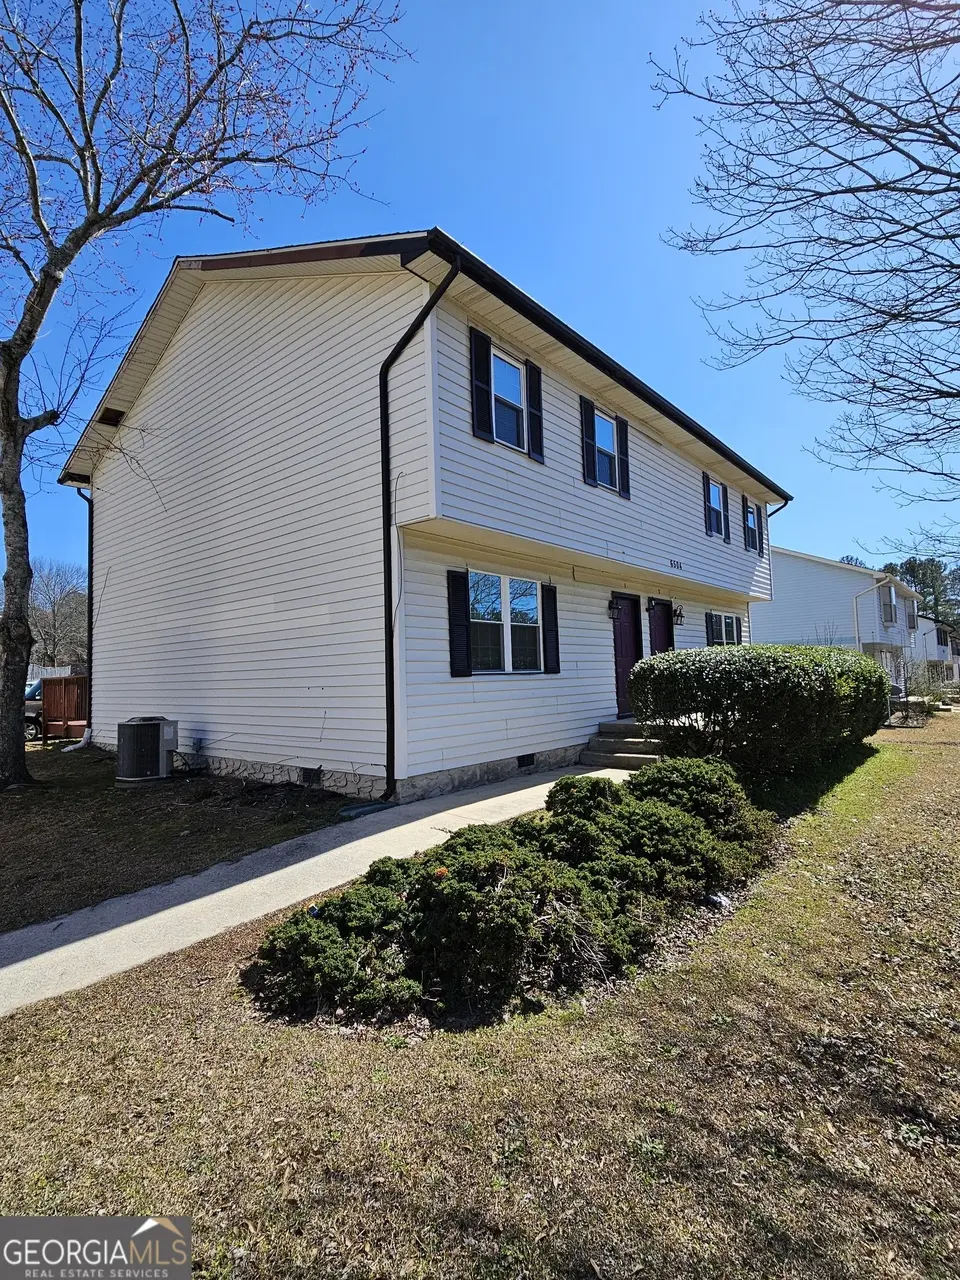
6504 Buffington Rd · Union City, GA
Flood risk 1/10 · Minimal
- FEMA flood zone
- X (unshaded)
- Chance of flooding over 30 yrs
- 0.0%
- Est. flood insurance / yr
- $507 – $1,088
Fire risk 4/10 · Minor
- Est. fire insurance / yr
- $963 – $1,789
Heat risk 6/10 · Moderate
- Hot days now (above 105°F)
- 7 days/yr
- Hot days in 30 yrs
- 19 days/yr
Wind risk 6/10 · Moderate
- Chance of severe wind over 30 yrs
- 27.0%
Air-quality risk 4/10 · Minor
- Unhealthy air days now
- 4 days/yr
- Unhealthy air days in 30 yrs
- 6 days/yr
Risk factors via First Street. Map © Google.
Why this score? — see what drove the C grade
The composite is a weighted blend of 9 inputs, each scored 0–100. Each bar is that input's sub-score; the figure is the points it added to the 100-point composite (weight × sub-score).
- Cash flow +16.7/30.0
- Appreciation +10.0/10.0
- ARV discount +7.5/15.0
- DSCR +5.2/10.0
- 1% rule +4.5/10.0
- Schools +4.5/10.0
- Condition / age +3.8/5.0
- Rent growth +3.1/5.0
- Livability +2.9/5.0
$385,000
🖨 Deal sheet 📄 Offer letter ✓ Due diligence
Multi-family units
County records classify this as Multi-Family (2-4 Unit). Listing-text estimate: 2 units. confirmed
Listing remarks
Exceptional opportunity to acquire a cash-flowing, low-maintenance duplex at 6504 Buffington Road in Union City. This turnkey investment is 100% occupied, delivering immediate and consistent income from day one. Each unit features a desirable 2 bedroom, 2.5 bathroom layout, ideal for tenant comfort and long-term stability. Annual Gross Income: $35,940 and this property produces a strong 9.33% gross cap rate. Strategically located near major highways, shopping, and Hartsfield-Jackson Atlanta International Airport, this duplex benefits from strong rental demand and long-term growth potential.
Key facts
- Strong rental demand
- Turnkey investment
- 100% occupied
Tags
Neighborhood map
What this means for you Summary
Snapshot
- This is a 2 × 2.0-bed/2.5-bath units multifamily listed at $385k. Condition is rated good.
Deal economics
- At list price, monthly cash flow is $237 ($3k/yr) — positive. Per door: $119/mo.
- The deal already cash-flows at list — no discount required.
- To meet the 1% rule (rent ≥ 1% of price), the offer needs to be $367k (4.7% below list).
- Recommended offer: $367k (4.7% below list) — sets the bar for 1% rule.
- Cap rate 7.0% vs local median 5.4% in Union City — top-decile yield for the area; either an underpriced asset or a hidden risk that comps aren't pricing in. Stress-test before assuming the spread holds.
Location & tenants
- Location reads 58/100 on livability (#443 in GA) — a working-class tenant base; expect higher turnover. Strengths: cost of living A+, housing A+; Watch: crime D+, schools F, amenities F.
- Fulton County (suburban): math 49% / reading 53% proficiency, ranked #12 of 174 in GA (top 7%) — acceptable for families but not a draw, mixed tenant base, ~2y average lease.
- Market conditions: Rents rising (+2.2%/yr); 167 active listings in the ZIP; 40 comparable units currently listed for rent nearby; rentals at typical pace (median 24d on market — plan ~3-4 weeks tenant-placement turnaround); 11,565 units permitted in Fulton County in 2024 (8,159 in 5+ unit buildings).
- At $3,668/mo this rent would consume 91% of the median local household income ($48k/yr) (locally 1778% of renters already pay >50% of income on rent) — very limited rent-growth headroom before tenants either downsize or default.
Forward outlook
- In year one you build about $41k of equity ($3k loan paydown + $38k appreciation (10.0% local appreciation)).
- Fulton County population projected at +38% by 2050 — long-run rental-demand tailwind backs the buy-and-hold thesis.
- At projected returns (10.0% appreciation + 2.2% rent growth), your $108k cash investment doubles in ~3 years — after that, you're playing with house money.
- By year 2, paydown + projected appreciation supports a ~$66k cash-out refi (75% LTV) — recoverable capital for the next deal without selling this one.
Negotiation context
- Only 8 days on market — expect competitive offers; lowballing is unlikely to land.
- 8 sale attempts; this cycle's ask has dropped $60k (13%) from the opening price — seller is motivated, your offer sets the floor, not the list.
Risks & watch-outs
- Climate carrying-cost: major wind risk, 27% chance of damaging wind over 30y; extreme-heat days projected 7→19/yr by 2055 (HVAC capex compounding) — expect insurance premiums to compound above CPI over the hold.
Questions for the listing agent
- Can we see the unit-by-unit rent roll, current vacancy, and any below-market leases? What's the average tenancy length?
- What capital expenditures (roof, boiler, parking lot, exteriors) have been made in the last 5 years, and what's planned in the next 2?
- Is there a deadline driving the sale (1031 exchange, divorce, estate, relocation)? That informs how much negotiation room exists.
- Schools are F-rated, which usually means shorter tenancies and higher turnover. Who's the typical renter profile here, and what's been the actual vacancy rate?
- Crime grade is D in this area — have there been break-ins, vandalism, or insurance claims at this property in the last 3 years? What carrier currently insures it and at what premium?
- What's the average days-on-market for RENTAL listings here right now (not sales)? A rising rental-DOM trend means longer vacancies and softer asking-rent achievability than the comps imply.
- What's the recent tenant-quality profile in this submarket — average credit score on applications, eviction rate, late-payment / NSF rate, and stable-employment percentage? A property-management company in the area should have these aggregated.
- How much new apartment / multifamily construction is in the pipeline within 1–3 miles? Heavy new supply (>2% of stock underway) typically softens rents 12–24 months out; light construction supports rent growth.
Investment metrics
- 1% rule
- 0.95% ✗
- Cap rate
- 7.03%
- Cash-on-cash
- 2.64%
- DSCR
- 1.12
- GRM
- 8.7
CMA / ARV
No comps found within radius.
Projected returns pro-forma
10.0% appreciation · 2.2% rent growth · sell at horizon
- IRR
- 25.9%
- Equity multiple
- 3.06×
- Total profit
- $221,906
- Equity at exit
- $346,839
- IRR
- 22.5%
- Equity multiple
- 6.90×
- Total profit
- $635,962
- Equity at exit
- $747,970
Cash invested: $107,800 (down + closing). Projections, not guarantees.
Landlord ↔ Tenant lean methodology
- Overall (STATE)
- 90 Strongly Landlord-Friendly
- State Georgia
- 90 Strongly Landlord-Friendly · R+3
- County
- — inherits STATE
- City
- — inherits STATE
ZIP-level market 30291
- Home prices YoY
- 11.1%
- Rents YoY
- 2.2%
- Active inventory
- 167
- Price-to-rent
- 17.5×
Monthly cashflow live
- Estimated rent
- $3,668 high interval (Pro) →
- Mortgage (P&I)
- −$2,019
- Tax est. 1.5%
- −$481 /mo · $5,775/yr
- Insurance
- −$160
- HOA
- −$0
- Vacancy / Maint / Mgmt
- −$770
- Net cashflow
- $237
Break-even live
2-unit breakdown (identical units grouped — click to expand)
| Units | Beds | Baths | Est. rent |
|---|---|---|---|
| 2× units | 2.0 | 2.5 | $3,668 |
| #1 | 2.0 | 2.5 | $1,834 |
| #2 | 2.0 | 2.5 | $1,834 |
| Total (2 units) | $3,668 | ||
UW: 25.0% down · 7.5% · 30yr · 1.5% tax · 5.0% vac · 8.0% maint · 8.0% mgmt
Financing live
Cash to close
- Down payment
- $96,250
- Closing costs
- $11,550
- Reserves months
- —
- Total cash needed
- —
Loan-product check · same deal, 3 products live
Conventional
25% down · 7.5% · 30yr
- Down + closing
- —
- Monthly P&I
- —
- Monthly cashflow
- —
- DSCR
- —
- Eligible?
- —
Personal DTI + credit; lowest rate.
DSCR
20% down · 8.5% · 30yr
- Down + closing
- —
- Monthly P&I
- —
- Monthly cashflow
- —
- DSCR
- —
- Eligible?
- —
No personal income docs; deal must DSCR.
Hard money
10% down · 12.0% · 12mo
- Down + closing
- —
- Monthly P&I
- —
- Monthly cashflow
- —
- DSCR
- —
- Eligible?
- —
Short-term bridge; refi at stabilization.
Rent comps 40 comps
| Address | Beds | Baths | Sqft | Rent | $/sqft | DOM | Units | Dist |
|---|---|---|---|---|---|---|---|---|
| 4050 Morgan Rd Union City, GA | 1.0–3.0 | 1.0–2.0 | 988 | $1,750 | $1.77 | 5d | 21 | 0.52mi |
| 6770 Buffington Rd Union City, GA | 1.0–3.0 | 1.0–2.0 | 950 | $1,699 | $1.79 | 1d | 24 | 0.54mi |
| 420 Buffington Dr Union City, GA | 3.0 | 2.0 | 2118 | $2,050 | $0.97 | 20d | 1 | 0.61mi |
| 3760 Cedar Hurst Way Atlanta, GA | 4.0 | 2.5 | 1595 | $2,150 | $1.35 | 10d | 1 | 0.64mi |
| 3859 Shenfield Dr Union City, GA | 4.0 | 2.5 | 1850 | $2,000 | $1.08 | 5d | 1 | 0.70mi |
| 3855 Shenfield Dr Union City, GA | 3.0 | 2.5 | 1626 | $1,895 | $1.17 | 43d | 1 | 0.71mi |
| 3800 Leisure Ln Atlanta, GA | 3.0 | 2.0 | 1198 | $2,350 | $1.96 | 22d | 1 | 0.72mi |
| 4014 Carisbrook Dr Union City, GA | 4.0 | 2.5 | 1795 | $2,295 | $1.28 | 22d | 1 | 0.73mi |
| 4014 Carisbrook Dr Union City, GA | 4.0 | 2.5 | 1795 | $2,195 | $1.22 | 5d | 1 | 0.73mi |
| 4014 Carisbrook Dr Union City, GA | 4.0 | 2.5 | 1795 | $2,295 | $1.28 | 24d | 1 | 0.73mi |
| 255 Buffington Dr Union City, GA | 3.0 | 2.0 | 3000 | $1,795 | $0.60 | 43d | 1 | 0.76mi |
| 835 Buffington Ct Union City, GA | 4.0 | 2.5 | 1723 | $2,165 | $1.26 | 43d | 1 | 0.77mi |
| 6225 Shenfield Ln Union City, GA | 3.0 | 2.5 | 1821 | $2,000 | $1.10 | 43d | 1 | 0.78mi |
| 325 Pointer Ct Atlanta, GA | 3.0 | 2.0 | 1474 | $1,620 | $1.10 | 5d | 1 | 0.78mi |
| 3791 Shenfield Dr Union City, GA | 3.0 | 2.5 | 1784 | $2,086 | $1.17 | 10d | 1 | 0.79mi |
| 2560 Foxlair Trl Atlanta, GA | 4.0 | 2.0 | 1485 | $1,795 | $1.21 | 24d | 1 | 0.79mi |
| 6445 Connell Rd Atlanta, GA | 3.0 | 2.0 | 1357 | $1,856 | $1.37 | 43d | 1 | 0.81mi |
| 6440 Connell Rd Atlanta, GA | 3.0 | 2.0 | 1391 | $1,695 | $1.22 | 24d | 1 | 0.82mi |
| 6596 Woodwell Dr Union City, GA | 3.0 | 2.5 | 1804 | $2,215 | $1.23 | 12d | 1 | 0.84mi |
| 4128 Flat Trl Union City, GA | 3.0 | 2.5 | 1450 | $1,700 | $1.17 | 43d | 1 | 0.85mi |
| 6500 Connell Rd Atlanta, GA | 3.0 | 2.0 | 1483 | $1,650 | $1.11 | 24d | 1 | 0.89mi |
| 6415 El Caudillo Ct Atlanta, GA | 3.0 | 3.0 | 1498 | $2,800 | $1.87 | 4d | 1 | 0.91mi |
| 6575 Smoke Ridge Dr Atlanta, GA | 4.0 | 2.0 | 1808 | $1,815 | $1.00 | 43d | 1 | 0.95mi |
| 3500 Keels Ln Atlanta, GA | 3.0 | 2.0 | 1272 | $1,755 | $1.38 | 1d | 1 | 0.98mi |
| 3457 Sumersbe Ct Atlanta, GA | 3.0 | 2.5 | 1800 | $2,300 | $1.28 | 5d | 1 | 1.00mi |
| 6350 Oakley Rd Union City, GA | 3.0 | 2.0–2.5 | 1472 | $1,796 | $1.22 | 1d | 4 | 1.07mi |
| 235 Whirlwind Ct Atlanta, GA | 3.0 | 2.0 | — | $1,800 | — | 43d | 1 | 1.07mi |
| 6150 Mallory Rd Atlanta, GA | 3.0 | 2.0 | 1681 | $1,695 | $1.01 | 11d | 1 | 1.08mi |
| 3240 Devilla Trce South Fulton, GA | 4.0 | 2.0 | 1616 | $1,980 | $1.23 | 43d | 1 | 1.10mi |
| 6425 Oakley Rd Union City, GA | 1.0–3.0 | 1.0–2.0 | 1037 | $1,502 | $1.45 | 4d | 18 | 1.12mi |
| 3285 Oakley Pl Union City, GA | 3.0 | 2.5 | 1350 | $1,500 | $1.11 | 43d | 1 | 1.13mi |
| 3275 Oakley Pl Unit 18 Union City, GA | 3.0 | 2.5 | — | $1,495 | — | 24d | 1 | 1.14mi |
| 3325 Valley Bend Rd Atlanta, GA | 4.0 | 2.0 | 2000 | $1,995 | $1.00 | 5d | 1 | 1.20mi |
| 3325 Valley Bend Rd Atlanta, GA | 4.0 | 2.0 | 2000 | $1,995 | $1.00 | 17d | 1 | 1.20mi |
| 5150 Oakley Commons Blvd Union City, GA | 3.0 | 2.5 | 1375 | $1,675 | $1.22 | 24d | 1 | 1.22mi |
| 610 Dot Dr Atlanta, GA | 4.0 | 2.5 | 3202 | $2,656 | $0.83 | 43d | 1 | 1.23mi |
| 4312 Smithgall Ct Union City, GA | 3.0 | 2.5 | 1433 | $2,000 | $1.40 | 18d | 1 | 1.25mi |
| 6237 Hickory Lane Cir Union City, GA | 4.0 | 2.5 | 1420 | $2,300 | $1.62 | 24d | 1 | 1.25mi |
| 6202 Hickory Lane Cir Union City, GA | 3.0 | 2.5 | 1744 | $1,995 | $1.14 | 43d | 1 | 1.30mi |
| 6085 Mallory Rdg #32 Union City, GA | 3.0 | 3.5 | 1540 | $2,300 | $1.49 | 43d | 1 | 1.30mi |
Listing history 37 events
-
2026-06-07statusdays on market $385,000 Pending 8 DOM
-
2026-06-04days on market $385,000 Active 7 DOM
-
2026-06-03days on market $385,000 Active 6 DOM
-
2026-06-01days on market $385,000 Active 4 DOM
-
2026-05-31days on market $385,000 Active 3 DOM
-
2026-05-11historical
-
2026-05-11historical
-
2026-03-30price $385,000
-
2026-03-30price $385,000
-
2026-02-26status Back On Market
-
2026-02-26status Active
-
2026-02-26historical Active Under Contract
-
2026-02-26historical Active Under Contract
-
2026-01-16price $389,000
-
2026-01-16price $389,000
-
2026-01-04status Back On Market
-
2026-01-04status Active
-
2025-12-30historical Active Under Contract
-
2025-12-30historical Active Under Contract
-
2025-11-13status Active
-
2025-11-13status Back On Market
-
2025-11-04status Under Contract
-
2025-11-04status Pending
-
2025-09-22price $399,999
-
2025-09-22price $399,999
-
2025-06-29price $408,000
-
2025-06-29price $408,000
-
2025-05-31price $419,000
-
2025-05-31price $419,000
-
2025-05-30price $429,000
-
2025-05-30price $429,000
-
2025-04-25price $430,000
-
2025-04-25price $430,000
-
2025-03-28price $435,000
-
2025-03-28price $435,000
-
2025-02-28$445,000 Active
-
2025-02-28$445,000 New
ⓘ Source: listings_history table (triggers on properties + properties_extension) + one-shot
backfill from property_details.listing_events for pre-trigger history.
Climate risk First Street
- Flood 1/10 Low FEMA zone X (unshaded) · 0% chance over 30 yrs
- Wildfire 4/10 Moderate
- Heat 6/10 Major 7 d/yr ≥105°F today · 19 d/yr by 30 yrs out
- Wind 6/10 Major 27% chance of damaging wind over 30 yrs
- Air quality 4/10 Moderate 4 unhealthy d/yr today · 6 by 30 yrs out
Nearby sold comps map
Loading sold comps map…
Walkable amenities ~0.75 mi
Loading nearby amenities…
Taxation est. · year 1
- Rental income
- $44,016
- − Mortgage interest
- −$21,566
- − Property taxes
- −$5,775
- − Insurance
- −$1,925
- − Repairs & maintenance
- −$3,521
- − Management
- −$3,521
- − Depreciation
- −$11,200
- Taxable loss
- −$3,493
- Est. tax savings @ 24.0%
- +$838
- After-tax cash flow
- $3,683/yr
For passive investors: Depreciation is non-cash, so a rental often shows a tax loss while cash-flowing — sheltering income. Rental losses are passive: they offset passive income freely, and up to $25,000/yr can offset ordinary (W-2) income if you actively participate and your MAGI is under $100k (phasing out to $0 by $150k); unused losses carry forward. On sale, claimed depreciation is recaptured at up to 25%, and gains may owe capital-gains tax (a 1031 exchange can defer both). Figures are a year-1 estimate at your 24.0% rate — not tax advice; consult a CPA.
Condition & rehab AI · 11 photos
This turnkey, low-maintenance duplex is in excellent condition with modern updates and a strong rental income potential.
Value-add opportunities
- Both Paint exterior — Enhances curb appeal and value
- Both Replace carpet — Improves comfort and value
- Both Update flooring in bathrooms — Modernizes and increases value
- Both Install smart home features — Attracts tech-savvy tenants and buyers
Renovation cost estimate screening
Value-add ROI direction
- Both Paint exterior — Enhances curb appeal and value ↑
- Both Replace carpet — Improves comfort and value ↑
- Both Update flooring in bathrooms — Modernizes and increases value ↑
- Both Install smart home features — Attracts tech-savvy tenants and buyers ↑
ⓘ Cost ranges are severity-bucket heuristics (US national rule-of-thumb). Get contractor quotes + a written scope before underwriting a rehab budget.
Schools (NCES district)
- District
- Fulton County
- NCES district ID
- 1302280
- Math proficiency
- 49% ▼ -2.00%
- Reading proficiency
- 53% ▬ 0.00%
- Median HH income
- $68,035
- Composite
- 45.33/100
- National rank
- #2640
- State rank
- #12 of 174 in GA
Livability — Union City
- Score
- 58/100
- State rank
- #443
- US rank
- #21281
Category grades
Schools grade is shown separately in the Schools card above.
Census & demographics
- Census place
- Union City, GA
- County
- Fulton County · 1,094,430 people
- City population
- 25,130
- Metro
- Atlanta-Sandy Springs-Alpharetta, GA
- Population (ZIP)
- 25,130
- Household income
- $48,184
- Rent vs Own
- Severe rent burden
- 1778.0
Population outlook (Fulton County) Hauer SSP2
- Today (2025)
- 1,203,707 people
- By 2030
- 1,299,706 · +8.0%
- By 2040
- 1,488,256 · +23.6%
- By 2050
- 1,664,580 · +38.3%
- By 2075
- 2,036,072 · +69.2%
- By 2100
- 2,222,402 · +84.6%
Race, ethnicity, and origin ACS 2023
- Neighborhood character
- Predominantly Black (86%)
- Race & ethnicity
- Black 86% Hispanic / Latino 7% Two or more races 6% White 3%
- Hispanic origin (detail)
- Mexican 4%
- Common ancestry
- Italian 1%
- Foreign-born
- 5% · Canada
- Languages at home
- 92% English-only · Spanish 6%
Political lean MEDSL · Fulton
- 2024 margin
- Solid D (+44.9) · D 71.9% · R 27.0% · Other 1.1%
- 2008→2024 swing
- +9.8pp toward D · 2008: 35.0pp · 2024: 44.9pp
- All cycles
- 2024: D+44.9 2020: D+46.4 2016: D+42.1 2012: D+29.6 2008: D+35.0
Not yet ingested
- Civics
- —
Market trends
- HPI YoY
- ▲ 23.98%
- Current HPI
- 239.3471
- Rent YoY
- ▲ 2.20%
- Metro
- Atlanta-Sandy Springs-Alpharetta, GA
- State GDP YoY
- ▲ 2.66%
- F500 in state
- 28
Industry mix (Fortune 500 HQ in GA)
| Industry | F500 HQs | Revenue |
|---|---|---|
| Paper / Packaging | 2 | $29B |
|
||
| Retail | 1 | $160B |
|
||
| Transportation / Logistics | 1 | $91B |
|
||
| Airlines | 1 | $62B |
|
||
| Consumer Goods | 1 | $47B |
|
||
| Utilities | 1 | $25B |
|
||
Price history
-13.5% since first listed32 events — show timeline
- 2026-05-11 Listing Removed — GAMLS
- 2026-05-11 Listing Removed — FMLS
- 2026-03-30 Price Changed $385,000 GAMLS
- 2026-03-30 Price Changed $385,000 FMLS
- 2026-02-26 Relisted — GAMLS
- 2026-02-26 Relisted — FMLS
- 2026-02-26 Contingent — FMLS
- 2026-02-26 Contingent — GAMLS
- 2026-01-16 Price Changed $389,000 FMLS
- 2026-01-16 Price Changed $389,000 GAMLS
- 2026-01-04 Relisted — GAMLS
- 2026-01-04 Relisted — FMLS
- 2025-12-30 Contingent — GAMLS
- 2025-12-30 Contingent — FMLS
- 2025-11-13 Relisted — FMLS
- 2025-11-13 Relisted — GAMLS
- 2025-11-04 Pending — GAMLS
- 2025-11-04 Pending — FMLS
- 2025-09-22 Price Changed $399,999 FMLS
- 2025-09-22 Price Changed $399,999 GAMLS
- 2025-06-29 Price Changed $408,000 GAMLS
- 2025-06-29 Price Changed $408,000 FMLS
- 2025-05-31 Price Changed $419,000 GAMLS
- 2025-05-31 Price Changed $419,000 FMLS
- 2025-05-30 Price Changed $429,000 GAMLS
- 2025-05-30 Price Changed $429,000 FMLS
- 2025-04-25 Price Changed $430,000 GAMLS
- 2025-04-25 Price Changed $430,000 FMLS
- 2025-03-28 Price Changed $435,000 GAMLS
- 2025-03-28 Price Changed $435,000 FMLS
- 2025-02-28 Listed $445,000 GAMLS
- 2025-02-28 Listed $445,000 FMLS
Cash-flow waterfall
monthlySold comps — $/sqft
last 12 mo · ≤1 miLoading sold comps…