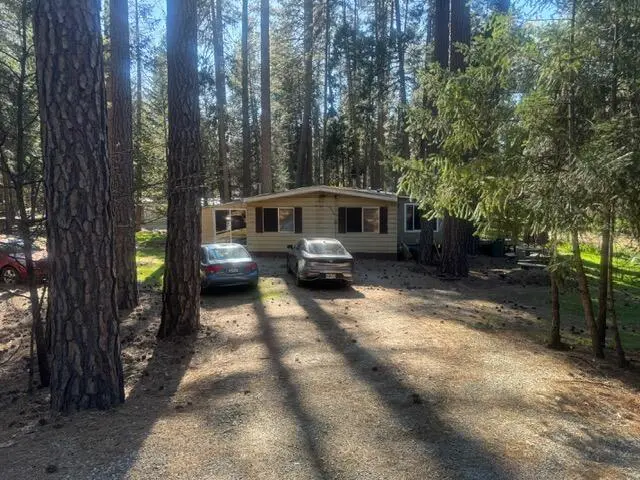
30830 Thumper Dr · Shingletown, CA
Flood risk 6/10 · Moderate
- FEMA flood zone
- X (unshaded)
- Chance of flooding over 30 yrs
- 0.7%
- Est. flood insurance / yr
- $507 – $1,088
Fire risk 8/10 · Major
- Est. fire insurance / yr
- $659 – $1,223
Heat risk 4/10 · Minor
- Hot days now (above threshold)
- —
- Hot days in 30 yrs
- —
Wind risk 1/10 · Minimal
- Chance of severe wind over 30 yrs
- —
Air-quality risk 10/10 · Severe
- Unhealthy air days now
- 26 days/yr
- Unhealthy air days in 30 yrs
- 27 days/yr
Risk factors via First Street. Map © Google.
Why this score? — see what drove the B+ grade
The composite is a weighted blend of 9 inputs, each scored 0–100. Each bar is that input's sub-score; the figure is the points it added to the 100-point composite (weight × sub-score).
- Cash flow +30.0/30.0
- ARV discount +15.0/15.0
- 1% rule +10.0/10.0
- DSCR +10.0/10.0
- Schools +4.6/10.0
- Livability +3.0/5.0
- Rent growth +2.5/5.0
- Condition / age +2.5/5.0
- Appreciation +0.0/10.0
$89,000
🖨 Deal sheet 📄 Offer letter ✓ Due diligence
Listing remarks
3 bedroom 2 Bath MFH fixer on a permanent foundation in Shasta Forest Village. Large . 70 acre lot with beautiful tall trees & a creek to beat the Redding heat. With a little work this could make a great vacation home or year round home. This property presents a unique opportunity to invest in a conveniently located home & create your vision in a setting with lots of potential
Key facts
- Large lot
- Permanent foundation
- Creek
Tags
Property features AI
Exterior
- Utilities: Generator for electric; Septic tank
- Home design: Single family residence; One level
- Construction: Aluminum siding; Composition roof
- Exterior features: Level, secluded lot; Asphalt road access
Interior
- Kitchen: Refrigerator; Cooktop; Double oven
- Flooring: Vinyl flooring
- Bathrooms: 2 full bathrooms
- Heating & cooling: Has heating; Evaporative cooling
- Interior features: Free-standing fireplace
Neighborhood map
What this means for you Summary
Snapshot
- This is a 3-bed/2.0-bath manufactured listed at $89k.
Deal economics
- At list price, monthly cash flow is $1k ($14k/yr) — positive.
- The deal already cash-flows at list — no discount required.
- Meets the 1% rule at list price ($2k rent vs $89k).
- Recommended offer: $84k (6.0% below list) — sets the bar for market timing.
- Cap rate 21.6% vs local median 4.7% in Shingletown — top-decile yield for the area; either an underpriced asset or a hidden risk that comps aren't pricing in. Stress-test before assuming the spread holds.
Location & tenants
- Location reads 59/100 on livability (#663 in CA) — a working-class tenant base; expect higher turnover. Strengths: housing A+, crime B+, health & safety B; Watch: schools F, amenities F, commute F.
- Shasta Union High (urban): math 41% / reading 67% proficiency, ranked #122 of 517 in CA (top 24%) — acceptable for families but not a draw, mixed tenant base, ~2y average lease; only 16% free/reduced lunch — higher-income household profile.
- Market conditions: 122 active listings in the ZIP; 246 units permitted in Shasta County in 2024 (0 in 5+ unit buildings).
Forward outlook
- Local home prices are declining (-3.0%/yr); year-one equity from $615 of loan paydown is wiped out by about $3k of value loss. Plan a longer hold.
- Shasta County population projected to shrink 9% by 2050 — rents likely to lag national; underwrite the cash flow, not the appreciation.
- At projected returns (-3.0% appreciation + 3.0% rent growth), your $25k cash investment doubles in ~3 years — after that, you're playing with house money.
Negotiation context
- It's been on market 82 days — a 6% lower offer ($84k) is reasonable based on typical stale-listing flexibility.
Risks & watch-outs
- Climate carrying-cost: major flood risk; severe wildfire risk — expect insurance premiums to compound above CPI over the hold.
Questions for the listing agent
- It's been on market 82 days. Have you received any prior offers? Is the seller open to a 6% concession, seller financing, or rate buy-down credit?
- Built in 1977 — when were the roof, HVAC, electrical panel, plumbing, and water heater last replaced?
- Why hasn't it sold? Are there any deal-killer items the seller is aware of (foundation, flood, title, zoning, code violations)?
- Is there a deadline driving the sale (1031 exchange, divorce, estate, relocation)? That informs how much negotiation room exists.
- Schools are F-rated, which usually means shorter tenancies and higher turnover. Who's the typical renter profile here, and what's been the actual vacancy rate?
- What's the average days-on-market for RENTAL listings here right now (not sales)? A rising rental-DOM trend means longer vacancies and softer asking-rent achievability than the comps imply.
- What's the recent tenant-quality profile in this submarket — average credit score on applications, eviction rate, late-payment / NSF rate, and stable-employment percentage? A property-management company in the area should have these aggregated.
- How much new for-sale + rental construction is in the pipeline within 1–3 miles? Heavy new supply typically softens prices + rents 12–24 months out; constrained supply supports both.
Investment metrics
- 1% rule
- 2.41% ✓
- Cap rate
- 21.62%
- Cash-on-cash
- 54.76%
- DSCR
- 3.44
- GRM
- 3.5
CMA / ARV
- ARV (on-the-fly)
- $132,480
- Comps found
- 3
Show comp detail 3 sales within ~0.75 mi
| Address | Dist | Beds/Ba | Sqft | Sold | Price | $/sf | Match |
|---|---|---|---|---|---|---|---|
| 30763 Thumper Dr | 0.14mi | 2/2.0 (-1) | 1,464 (+2%) | 11mo | $134,000 | $92 | 77 |
| 30936 Bambi Dr | 0.20mi | 2/2.0 (-1) | 1,368 (-5%) | 4mo | $75,000 | $55 | 74 |
| 30641 Thumper Dr | 0.38mi | 3/2.0 | 1,440 (0%) | 17mo | $150,000 | $104 | 68 |
Match score weights: distance 35% · size 25% · config 20% · recency 20%. Top-matched comps best support the ARV.
Projected returns pro-forma
-3.0% appreciation · 3.0% rent growth · sell at horizon
- IRR
- 53.0%
- Equity multiple
- 3.33×
- Total profit
- $57,998
- Equity at exit
- $13,270
- IRR
- 58.2%
- Equity multiple
- 6.77×
- Total profit
- $143,753
- Equity at exit
- $7,695
Cash invested: $24,920 (down + closing). Projections, not guarantees.
Landlord ↔ Tenant lean methodology
- Overall (STATE)
- 18 Strongly Tenant-Friendly
- State California
- 18 Strongly Tenant-Friendly · D+13
- County
- — inherits STATE
- City
- — inherits STATE
ZIP-level market 96088
- Active inventory
- 122
- Price-to-rent
- 3.5×
Monthly cashflow live
- Estimated rent
- $2,149 medium interval (Pro) →
- Mortgage (P&I)
- −$467
- Tax from tax record
- −$57 /mo · $678/yr
- Insurance
- −$37
- HOA
- −$0
- Vacancy / Maint / Mgmt
- −$451
- Net cashflow
- $1,137
Break-even live
UW: 25.0% down · 7.5% · 30yr · 1.5% tax · 5.0% vac · 8.0% maint · 8.0% mgmt
Financing live
Cash to close
- Down payment
- $22,250
- Closing costs
- $2,670
- Reserves months
- —
- Total cash needed
- —
Loan-product check · same deal, 3 products live
Conventional
25% down · 7.5% · 30yr
- Down + closing
- —
- Monthly P&I
- —
- Monthly cashflow
- —
- DSCR
- —
- Eligible?
- —
Personal DTI + credit; lowest rate.
DSCR
20% down · 8.5% · 30yr
- Down + closing
- —
- Monthly P&I
- —
- Monthly cashflow
- —
- DSCR
- —
- Eligible?
- —
No personal income docs; deal must DSCR.
Hard money
10% down · 12.0% · 12mo
- Down + closing
- —
- Monthly P&I
- —
- Monthly cashflow
- —
- DSCR
- —
- Eligible?
- —
Short-term bridge; refi at stabilization.
Listing history 21 events
-
2026-06-19days on market $89,000 Active 82 DOM
-
2026-06-18days on market $89,000 Active 81 DOM
-
2026-06-17days on market $89,000 Active 80 DOM
-
2026-06-16days on market $89,000 Active 79 DOM
-
2026-06-15days on market $89,000 Active 78 DOM
-
2026-06-14days on market $89,000 Active 76 DOM
-
2026-06-12days on market $89,000 Active 75 DOM
-
2026-06-10days on market $89,000 Active 73 DOM
-
2026-06-09days on market $89,000 Active 72 DOM
-
2026-06-08days on market $89,000 Active 71 DOM
-
2026-06-07days on market $89,000 Active 70 DOM
-
2026-06-04price $89,000 Active 66 DOM
-
2026-06-03days on market $99,000 Active 66 DOM
-
2026-06-02days on market $99,000 Active 65 DOM
-
2026-06-01days on market $99,000 Active 64 DOM
-
2026-05-31days on market $99,000 Active 63 DOM
-
2026-05-30days on market $99,000 Active 62 DOM
-
2026-04-23price $99,000
-
2026-03-30$110,000 Active
-
2006-11-06soldstatus $160,000
-
2001-01-12soldstatus $58,000
ⓘ Source: listings_history table (triggers on properties + properties_extension) + one-shot
backfill from property_details.listing_events for pre-trigger history.
Tax reassessment forecast CA · Resets to sale price
- Current annual tax
- $678 · $57/mo
- Projected year-2 tax
- $678 · $57/mo
- Expected delta
- $0/yr ($0/mo · 0.0%)
ⓘ Screening estimate from a state-policy table — verify with the county assessor before closing.
Climate risk First Street
- Flood 6/10 Major FEMA zone X (unshaded) · 70% chance over 30 yrs
- Wildfire 8/10 Severe
- Heat 4/10 Moderate
- Wind 1/10 Low
- Air quality 10/10 Extreme 26 unhealthy d/yr today · 27 by 30 yrs out
Nearby sold comps map
Loading sold comps map…
Walkable amenities ~0.75 mi
Loading nearby amenities…
Taxation est. · year 1
- Rental income
- $25,784
- − Mortgage interest
- −$4,985
- − Property taxes
- −$678
- − Insurance
- −$445
- − Repairs & maintenance
- −$2,063
- − Management
- −$2,063
- − Depreciation
- −$2,589
- Taxable income
- $12,960
- Est. tax owed @ 24.0%
- −$3,110
- After-tax cash flow
- $10,534/yr
For passive investors: Depreciation is non-cash, so a rental often shows a tax loss while cash-flowing — sheltering income. Rental losses are passive: they offset passive income freely, and up to $25,000/yr can offset ordinary (W-2) income if you actively participate and your MAGI is under $100k (phasing out to $0 by $150k); unused losses carry forward. On sale, claimed depreciation is recaptured at up to 25%, and gains may owe capital-gains tax (a 1031 exchange can defer both). Figures are a year-1 estimate at your 24.0% rate — not tax advice; consult a CPA.
Schools (NCES district)
- District
- Shasta Union High
- NCES district ID
- 0636600
- Math proficiency
- 41% ▲ 3.00%
- Reading proficiency
- 67% ▲ 9.00%
- Median HH income
- $50,080
- Composite
- 46.01/100
- National rank
- #2532
- State rank
- #122 of 517 in CA
Livability — Shingletown
- Score
- 59/100
- State rank
- #663
- US rank
- #20514
Category grades
Schools grade is shown separately in the Schools card above.
Census & demographics
- Census place
- Shingletown, CA
- City population
- 4,552
- Population (ZIP)
- 4,552
Population outlook (Shasta County) Hauer SSP2
- Today (2025)
- 179,231 people
- By 2030
- 176,953 · -1.3%
- By 2040
- 169,982 · -5.2%
- By 2050
- 162,547 · -9.3%
- By 2075
- 145,649 · -18.7%
- By 2100
- 123,025 · -31.4%
Race, ethnicity, and origin ACS 2023
- Neighborhood character
- Predominantly White (82%)
- Race & ethnicity
- White 82% Two or more races 11% Hispanic / Latino 8% Native American 2%
- Hispanic origin (detail)
- Mexican 6% Cuban 1%
- Common ancestry
- Lithuanian 5% Serbian 3% Portuguese 3%
- Foreign-born
- 3% · Canada, China
- Languages at home
- 94% English-only · Spanish 5%
Political lean MEDSL · Shasta
- 2024 margin
- Solid R (+36.5) · D 30.5% · R 67.0% · Other 2.5%
- 2008→2024 swing
- -10.7pp toward R · 2008: -25.8pp · 2024: -36.5pp
- All cycles
- 2024: R+36.5 2020: R+33.1 2016: R+37.4 2012: R+30.3 2008: R+25.8
Not yet ingested
- Civics
- —
Market trends
- HPI YoY
- ▼ -127.35%
- Current HPI
- 141.2725
- Rent YoY
- —
- Metro
- —
- State GDP YoY
- ▲ 3.21%
- F500 in state
- 116
Industry mix (Fortune 500 HQ in CA)
| Industry | F500 HQs | Revenue |
|---|---|---|
| Technology | 27 | $1,492B |
|
||
| Financial Services | 3 | $174B |
|
||
| Retail | 3 | $44B |
|
||
| Insurance | 3 | $26B |
|
||
| Media / Entertainment | 2 | $115B |
|
||
| Pharmaceuticals / Biotech | 2 | $62B |
|
||
Price history
+70.7% since first listed4 events — show timeline
- 2026-04-23 Price Changed $99,000 SAOR
- 2026-03-30 Listed $110,000 SAOR
- 2006-11-06 Sold (Public Records) $160,000 Public Records
- 2001-01-12 Sold (Public Records) $58,000 Public Records
Property tax history
+3.9%/yrLatest (2025): $678 · +1.5% YoY. Source: county tax records.
Cash-flow waterfall
monthlySold comps — $/sqft
last 12 mo · ≤1 miLoading sold comps…