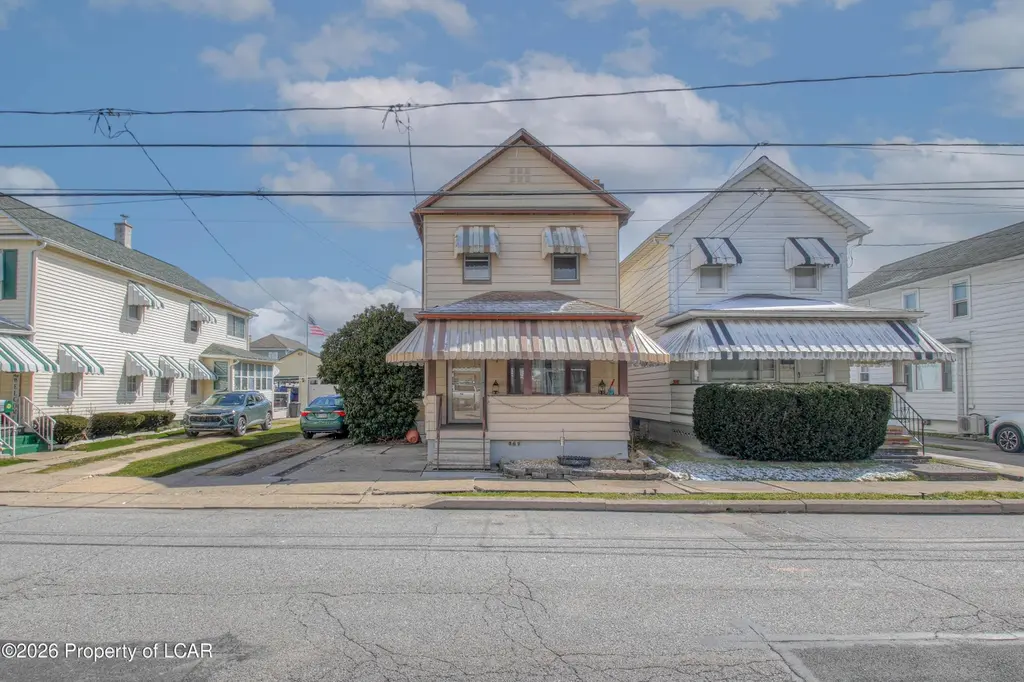
342 Phillips St · Plymouth, PA
Flood risk 6/10 · Moderate
- FEMA flood zone
- X
- Chance of flooding over 30 yrs
- 0.27%
- Est. flood insurance / yr
- $507 – $1,088
Fire risk 3/10 · Minor
- Est. fire insurance / yr
- $511 – $949
Heat risk 4/10 · Minor
- Hot days now (above 94°F)
- 7 days/yr
- Hot days in 30 yrs
- 16 days/yr
Wind risk 3/10 · Minor
- Chance of severe wind over 30 yrs
- 5.0%
Air-quality risk 2/10 · Minimal
- Unhealthy air days now
- 1 days/yr
- Unhealthy air days in 30 yrs
- 2 days/yr
Risk factors via First Street. Map © Google.
Why this score? — see what drove the C- grade
The composite is a weighted blend of 9 inputs, each scored 0–100. Each bar is that input's sub-score; the figure is the points it added to the 100-point composite (weight × sub-score).
- Cash flow +18.6/30.0
- ARV discount +15.0/15.0
- DSCR +5.8/10.0
- 1% rule +4.4/10.0
- Livability +3.3/5.0
- Rent growth +2.5/5.0
- Condition / age +2.5/5.0
- Schools +1.9/10.0
- Appreciation +0.0/10.0
$150,000
🖨 Deal sheet 📄 Offer letter ✓ Due diligence
Listing remarks MLS
Charming 3 bedroom, 1 bath home features an open floor plan, perfect for everyday living and entertaining. Enjoy a covered front porch and the convenience of off street parking. Minimal yard means low exterior maintenance. A great opportunity in a convenient location.
Key facts
- Covered front porch
- Open floor plan
- Off street parking
Tags
Neighborhood map
What this means for you Summary
Snapshot
- This is a 3-bed/1.0-bath single-family listed at $150k.
Deal economics
- At list price, monthly cash flow is $144 ($2k/yr) — positive.
- The deal already cash-flows at list — no discount required.
- To meet the 1% rule (rent ≥ 1% of price), the offer needs to be $141k (6.1% below list).
- Recommended offer: $141k (6.1% below list) — sets the bar for 1% rule.
Location & tenants
- Location reads 66/100 on livability (#1,068 in PA) — a middle-class / working-renter tenant base. Strengths: cost of living A+, health & safety A+, housing B+; Watch: employment D, crime F, amenities F.
- Hanover Area SD (suburban): math 19% / reading 25% proficiency, ranked #484 of 539 in PA (top 90%) — low school quality limits family demand, transient renter base, plan for 1-2y turnover.
- Market conditions: 81 active listings in the ZIP; 27 comparable units currently listed for rent nearby; rentals at typical pace (median 21d on market — plan ~3-4 weeks tenant-placement turnaround); 349 units permitted in Luzerne County in 2024 (16 in 5+ unit buildings).
Forward outlook
- Local home prices are declining (-3.0%/yr); year-one equity from $1k of loan paydown is wiped out by about $4k of value loss. Plan a longer hold.
- Luzerne County population projected at +4% by 2050 — modest demand growth; plan on rents tracking national, not racing it.
Negotiation context
- It's been on market 69 days — a 6% lower offer ($141k) is reasonable based on typical stale-listing flexibility.
- 2 sale attempts since 12y ago with the ask held roughly flat each time — persistent listings suggest the price (not the market) is what's stuck; bring a comps-based counter.
- Current owner paid $42k; list at $150k implies a 261% gain — meaningful room to come down on a strong offer.
Risks & watch-outs
- Watch-outs: built in 1948 — expect roof / HVAC / electrical / plumbing capex.
- Climate carrying-cost: major flood risk — expect insurance premiums to compound above CPI over the hold.
Questions for the listing agent
- It's been on market 69 days. Have you received any prior offers? Is the seller open to a 6% concession, seller financing, or rate buy-down credit?
- Built in 1948 — when were the roof, HVAC, electrical panel, plumbing, and water heater last replaced?
- Why hasn't it sold? Are there any deal-killer items the seller is aware of (foundation, flood, title, zoning, code violations)?
- Is there a deadline driving the sale (1031 exchange, divorce, estate, relocation)? That informs how much negotiation room exists.
- Crime grade is F in this area — have there been break-ins, vandalism, or insurance claims at this property in the last 3 years? What carrier currently insures it and at what premium?
- What's the average days-on-market for RENTAL listings here right now (not sales)? A rising rental-DOM trend means longer vacancies and softer asking-rent achievability than the comps imply.
- What's the recent tenant-quality profile in this submarket — average credit score on applications, eviction rate, late-payment / NSF rate, and stable-employment percentage? A property-management company in the area should have these aggregated.
- How much new for-sale + rental construction is in the pipeline within 1–3 miles? Heavy new supply typically softens prices + rents 12–24 months out; constrained supply supports both.
Investment metrics
- 1% rule
- 0.94% ✗
- Cap rate
- 7.45%
- Cash-on-cash
- 4.12%
- DSCR
- 1.18
- GRM
- 8.9
CMA / ARV
- ARV (median comp)
- $195,314
- List price
- $150,000
- Delta
- -23.20%
- Verdict
- UNDERPRICED
- Comps
- 20 within 1.0 mi
Show comp detail 12 sales within ~0.75 mi
| Address | Dist | Beds/Ba | Sqft | Sold | Price | $/sf | Match |
|---|---|---|---|---|---|---|---|
| 588 Shawnee St | 0.18mi | 3/1.0 | 1,216 (+1%) | 2mo | $170,000 | $140 | 88 |
| 333 Lyndwood Ave | 0.03mi | 3/2.0 | 1,200 (-0%) | 12mo | $199,900 | $167 | 84 |
| 192 Phillips St | 0.28mi | 3/1.0 | 1,264 (+5%) | 2mo | $150,500 | $119 | 77 |
| 300 Colley St | 0.13mi | 3/1.0 | 1,116 (-7%) | 13mo | $157,000 | $141 | 71 |
| 40 Kniffen St | 0.21mi | 3/2.0 | 1,265 (+5%) | 9mo | $225,000 | $178 | 71 |
| 42 Garrahan St | 0.09mi | 2/1.0 (-1) | 1,120 (-7%) | 11mo | $206,700 | $185 | 70 |
| 82 Lyndwood Ave | 0.51mi | 3/1.0 | 1,200 (-0%) | 10mo | $207,000 | $173 | 68 |
| 45 Ferry St | 0.66mi | 3/1.0 | 1,135 (-6%) | 8mo | $65,000 | $57 | 53 |
| 154 Red Fox Ln | 0.61mi | 2/2.5 (-1) | 1,224 (+2%) | 8mo | $172,000 | $141 | 51 |
| 400 Beade St | 0.62mi | 3/2.0 | 1,104 (-8%) | 4mo | $135,000 | $122 | 50 |
| 12 Grandview Ave | 0.56mi | 3/1.0 | 1,300 (+8%) | 13mo | $250,000 | $192 | 49 |
| 2 Pulaski St | 0.74mi | 2/1.0 (-1) | 1,100 (-9%) | 11mo | $164,900 | $150 | 37 |
Match score weights: distance 35% · size 25% · config 20% · recency 20%. Top-matched comps best support the ARV.
Projected returns pro-forma
-3.0% appreciation · 3.0% rent growth · sell at horizon
- IRR
- -9.9%
- Equity multiple
- 0.64×
- Total profit
- $-15,141
- Equity at exit
- $22,365
- IRR
- -0.5%
- Equity multiple
- 0.97×
- Total profit
- $-1,440
- Equity at exit
- $12,969
Cash invested: $42,000 (down + closing). Projections, not guarantees.
Landlord ↔ Tenant lean methodology
- Overall (STATE)
- 62 Landlord-Friendly
- State Pennsylvania
- 62 Landlord-Friendly · EVEN
- County
- — inherits STATE
- City
- — inherits STATE
ZIP-level market 18706
- Active inventory
- 81
- Price-to-rent
- 8.9×
Monthly cashflow live
- Estimated rent
- $1,409 high interval (Pro) →
- Mortgage (P&I)
- −$787
- Tax from tax record
- −$120 /mo · $1,438/yr
- Insurance
- −$62
- HOA
- −$0
- Vacancy / Maint / Mgmt
- −$296
- Net cashflow
- $144
Break-even live
UW: 25.0% down · 7.5% · 30yr · 1.5% tax · 5.0% vac · 8.0% maint · 8.0% mgmt
Financing live
Cash to close
- Down payment
- $37,500
- Closing costs
- $4,500
- Reserves months
- —
- Total cash needed
- —
Loan-product check · same deal, 3 products live
Conventional
25% down · 7.5% · 30yr
- Down + closing
- —
- Monthly P&I
- —
- Monthly cashflow
- —
- DSCR
- —
- Eligible?
- —
Personal DTI + credit; lowest rate.
DSCR
20% down · 8.5% · 30yr
- Down + closing
- —
- Monthly P&I
- —
- Monthly cashflow
- —
- DSCR
- —
- Eligible?
- —
No personal income docs; deal must DSCR.
Hard money
10% down · 12.0% · 12mo
- Down + closing
- —
- Monthly P&I
- —
- Monthly cashflow
- —
- DSCR
- —
- Eligible?
- —
Short-term bridge; refi at stabilization.
Rent comps 27 comps
| Address | Beds | Baths | Sqft | Rent | $/sqft | DOM | Units | Dist |
|---|---|---|---|---|---|---|---|---|
| 617 Fellows Ave Wilkes-Barre, PA | 4.0 | 1.0 | 1100 | $1,395 | $1.27 | 14d | 1 | 0.17mi |
| 1259 Sively St Wilkes-Barre, PA | 3.0 | 1.0 | 1232 | $1,550 | $1.26 | 44d | 1 | 0.75mi |
| 75 Oxford St Hanover Township, PA | 2.0 | 1.0 | 900 | $950 | $1.06 | 14d | 1 | 0.85mi |
| 13 Woodbury St Hanover Township, PA | 2.0 | 1.0 | 1000 | $1,100 | $1.10 | 44d | 1 | 0.91mi |
| 1321 S Main St Hanover Township, PA | 2.0 | 1.0 | 800 | $1,095 | $1.37 | 44d | 1 | 0.97mi |
| 27 Oak St Wilkes Barre, PA | 3.0 | 1.5 | 1500 | $1,700 | $1.13 | 44d | 1 | 0.97mi |
| 342 Horton St Wilkes Barre, PA | 3.0 | 1.5 | 1472 | $1,650 | $1.12 | 14d | 1 | 1.02mi |
| 241 Gould St Plymouth, PA | 2.0 | 1.0 | 985 | $1,150 | $1.17 | 21d | 1 | 1.04mi |
| 48 E Shawnee Ave Plymouth, PA | 3.0 | 1.0 | 1500 | $1,250 | $0.83 | 14d | 1 | 1.05mi |
| 129 Carlisle St Wilkes Barre, PA | 2.0 | 1.0 | 1005 | $1,200 | $1.19 | 14d | 1 | 1.11mi |
| 284 Barney St Wilkes Barre, PA | 3.0 | 1.0 | 1070 | $1,600 | $1.50 | 44d | 1 | 1.15mi |
| 216 Horton St Wilkes Barre, PA | 3.0 | 1.5 | 1475 | $1,575 | $1.07 | 44d | 1 | 1.15mi |
| 210-212 Center Ave Plymouth, PA | 3.0 | 1.0 | 1300 | $1,200 | $0.92 | 44d | 1 | 1.15mi |
| 68 Circle Dr Hanover Township, PA | 3.0 | 1.5 | 950 | $1,800 | $1.89 | 14d | 1 | 1.17mi |
| 338 W Shawnee Ave Plymouth, PA | 2.0 | 1.5 | 945 | $1,550 | $1.64 | 14d | 1 | 1.26mi |
| 202 S Nesbitt St Unit 206 B Larksville, PA | 3.0 | 1.0 | 1100 | $1,500 | $1.36 | 44d | 1 | 1.26mi |
| 546 W Main St Plymouth, PA | 2.0 | 1.0 | 750 | $1,150 | $1.53 | 21d | 1 | 1.30mi |
| 52 Diamond Ave Hanover Township, PA | 2.0 | 1.0 | 820 | $925 | $1.13 | 21d | 1 | 1.33mi |
| 29 Franklin St Plymouth, PA | 3.0 | 1.0 | 1426 | $1,800 | $1.26 | 14d | 1 | 1.39mi |
| 156 Hanover St Wilkes Barre, PA | 3.0 | 1.0 | 850 | $1,300 | $1.53 | 14d | 1 | 1.40mi |
| 75 Melrose Ave Apt 2 Wilkes-Barre, PA | 2.0 | 1.0 | 1150 | $1,250 | $1.09 | 44d | 1 | 1.43mi |
| 72 Franklin St Plymouth, PA | 2.0 | 1.0 | 750 | $1,175 | $1.57 | 14d | 1 | 1.43mi |
| 134 Blair St Plymouth, PA | 3.0 | 1.0 | 1300 | $1,300 | $1.00 | 21d | 1 | 1.44mi |
| 92 Diamond Ave Hanover Township, PA | 3.0 | 1.0 | 1150 | $1,400 | $1.22 | 44d | 1 | 1.46mi |
| 100-102 Westminster St Wilkes-Barre, PA | 2.0 | 1.0 | 1200 | $1,150 | $0.96 | 21d | 1 | 1.47mi |
| 100-102 Westminster St Wilkes-Barre, PA | 2.0 | 1.0 | 1100 | $1,150 | $1.05 | 14d | 1 | 1.47mi |
| 100 Westminster St Wilkes Barre, PA | 4.0 | 1.0 | 1150 | $1,400 | $1.22 | 14d | 1 | 1.48mi |
Listing history 4 events
-
2026-03-20$150,000 Active 268-char remark
Show marketing remark (268 chars)
Charming 3 bedroom, 1 bath home features an open floor plan, perfect for everyday living and entertaining. Enjoy a covered front porch and the convenience of off street parking. Minimal yard means low exterior maintenance. A great opportunity in a convenient location.
-
2015-05-26soldstatus $41,500
-
2015-05-22soldstatus $41,500 261-char remark
Show marketing remark (261 chars)
What are you waiting for?? This is a GREAT little house!! Modern and efficient with newly remodeled rooms, new furnace, gas dryer and stove. Live in with an easy budget or build your rental portfolio. Either way its a win situation!! Call Whitney 570-417-1216
-
2014-10-09$47,500 261-char remark
Show marketing remark (261 chars)
What are you waiting for?? This is a GREAT little house!! Modern and efficient with newly remodeled rooms, new furnace, gas dryer and stove. Live in with an easy budget or build your rental portfolio. Either way its a win situation!! Call Whitney 570-417-1216
ⓘ Source: listings_history table (triggers on properties + properties_extension) + one-shot
backfill from property_details.listing_events for pre-trigger history.
Tax reassessment forecast PA · Partial reset (capped growth)
- Current annual tax
- $1,438 · $120/mo
- Projected year-2 tax
- $1,904 · $159/mo
- Expected delta
- +$466/yr (+$39/mo · 32.4%)
ⓘ Screening estimate from a state-policy table — verify with the county assessor before closing.
Climate risk First Street
- Flood 6/10 Major FEMA zone X · 27% chance over 30 yrs
- Wildfire 3/10 Moderate
- Heat 4/10 Moderate 7 d/yr ≥94°F today · 16 d/yr by 30 yrs out
- Wind 3/10 Moderate 5% chance of damaging wind over 30 yrs
- Air quality 2/10 Low 1 unhealthy d/yr today · 2 by 30 yrs out
Nearby sold comps map
Loading sold comps map…
Walkable amenities ~0.75 mi
Loading nearby amenities…
Taxation est. · year 1
- Rental income
- $16,909
- − Mortgage interest
- −$8,402
- − Property taxes
- −$1,438
- − Insurance
- −$750
- − Repairs & maintenance
- −$1,353
- − Management
- −$1,353
- − Depreciation
- −$4,364
- Taxable loss
- −$751
- Est. tax savings @ 24.0%
- +$180
- After-tax cash flow
- $1,911/yr
For passive investors: Depreciation is non-cash, so a rental often shows a tax loss while cash-flowing — sheltering income. Rental losses are passive: they offset passive income freely, and up to $25,000/yr can offset ordinary (W-2) income if you actively participate and your MAGI is under $100k (phasing out to $0 by $150k); unused losses carry forward. On sale, claimed depreciation is recaptured at up to 25%, and gains may owe capital-gains tax (a 1031 exchange can defer both). Figures are a year-1 estimate at your 24.0% rate — not tax advice; consult a CPA.
Schools (NCES district)
- District
- Hanover Area SD
- NCES district ID
- 4211420
- Math proficiency
- 19% ▼ -3.00%
- Reading proficiency
- 25% ▼ -21.00%
- Median HH income
- $40,015
- Composite
- 18.6/100
- National rank
- #8903
- State rank
- #484 of 539 in PA
Livability — Plymouth
- Score
- 66/100
- State rank
- #1068
- US rank
- #12056
Category grades
Schools grade is shown separately in the Schools card above.
Census & demographics
- County
- Luzerne County · 118,885 people
- City population
- 56,443
- Metro
- Scranton--Wilkes-Barre, PA
- Population (ZIP)
- 16,387
- Household income
- $58,558
- Rent vs Own
- Severe rent burden
- 568.0
Population outlook (Luzerne County) Hauer SSP2
- Today (2025)
- 319,505 people
- By 2030
- 319,943 · +0.1%
- By 2040
- 322,643 · +1.0%
- By 2050
- 330,817 · +3.5%
- By 2075
- 379,145 · +18.7%
- By 2100
- 431,908 · +35.2%
Race, ethnicity, and origin ACS 2023
- Neighborhood character
- Predominantly White (76%)
- Race & ethnicity
- White 76% Hispanic / Latino 17% Two or more races 11% Black 3%
- Hispanic origin (detail)
- Puerto Rican 9% Dominican 4%
- Common ancestry
- Romanian 18% Scotch-Irish 3% Subsaharan African 1%
- Foreign-born
- 6% · Canada
- Languages at home
- 88% English-only · Spanish 10% Other Asian/Pacific 1%
Political lean MEDSL · Luzerne
- 2024 margin
- R (+19.2) · D 40.0% · R 59.2%
- 2008→2024 swing
- -27.6pp toward R · 2008: 8.4pp · 2024: -19.2pp
- All cycles
- 2024: R+19.2 2020: R+14.4 2016: R+19.6 2012: D+4.8 2008: D+8.4
Not yet ingested
- Civics
- —
Market trends
- HPI YoY
- ▼ -150.02%
- Current HPI
- 196.19
- Rent YoY
- —
- Metro
- Scranton--Wilkes-Barre, PA
- State GDP YoY
- ▲ 1.68%
- F500 in state
- 34
Industry mix (Fortune 500 HQ in PA)
| Industry | F500 HQs | Revenue |
|---|---|---|
| Healthcare | 2 | $309B |
|
||
| Insurance | 2 | $27B |
|
||
| Telecommunications / Media | 1 | $124B |
|
||
| Industrial Distribution | 1 | $22B |
|
||
| Financial Services | 1 | $20B |
|
||
| Chemicals / Materials | 1 | $18B |
|
||
Price history
+215.8% since first listed4 events — show timeline
- 2026-03-20 Listed $150,000 LCAR
- 2015-05-26 Sold (Public Records) $41,500 Public Records
- 2015-05-22 Sold (MLS) $41,500 LCAR
- 2014-10-09 Listed $47,500 LCAR
Property tax history
+0.8%/yrLatest (2026): $1,438 · +0.3% YoY. Source: county tax records.
Cash-flow waterfall
monthlySold comps — $/sqft
last 12 mo · ≤1 miLoading sold comps…