3110 B St · Springfield, FL
Flood risk 4/10 · Minor
- FEMA flood zone
- X (unshaded)
- Chance of flooding over 30 yrs
- 0.22%
- Est. flood insurance / yr
- $507 – $1,088
Fire risk 6/10 · Moderate
- Est. fire insurance / yr
- $947 – $1,759
Heat risk 10/10 · Severe
- Hot days now (above 105°F)
- 7 days/yr
- Hot days in 30 yrs
- 21 days/yr
Wind risk 9/10 · Severe
- Chance of severe wind over 30 yrs
- 99.0%
Air-quality risk 1/10 · Minimal
- Unhealthy air days now
- 0 days/yr
- Unhealthy air days in 30 yrs
- 0 days/yr
Risk factors via First Street. Map © Google.
Why this score? — see what drove the B+ grade
The composite is a weighted blend of 9 inputs, each scored 0–100. Each bar is that input's sub-score; the figure is the points it added to the 100-point composite (weight × sub-score).
- Cash flow +30.0/30.0
- ARV discount +15.0/15.0
- DSCR +10.0/10.0
- 1% rule +8.9/10.0
- Schools +4.3/10.0
- Livability +3.0/5.0
- Rent growth +2.8/5.0
- Condition / age +2.5/5.0
- Appreciation +0.0/10.0
$140,000
🖨 Deal sheet 📄 Offer letter ✓ Due diligence
Listing remarks MLS
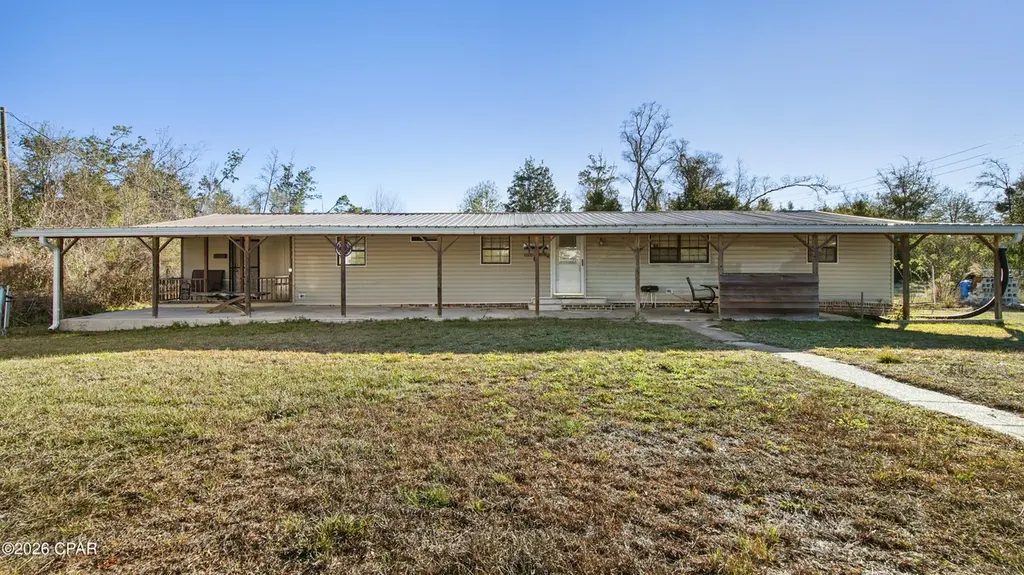
Spacious 4 bedroom, 3 bath home with an open floor plan sitting on a huge corner lot just over 3/4 of an acre. Located only about 20 minutes from Panama City Beach, you get the perfect mix of space and convenience. Enjoy a fully covered front porch, privacy trees lining the front of the property, and a partially fenced yard with plenty of room to spread out. Out back you'll find a 20x20 shed for storage, hobbies, or workspace. Major updates already handled with a new roof in 2019 and both the septic pump and well pump replaced in 2018. All appliances convey, making this one move-in ready. One of the standout features is a bedroom with its own private entrance, perfect for a mother-in-law suite, guests, or even potential rental use. If you've been looking for space, flexibility, and a great location close to the beach, this one checks all the boxes.
Key facts
- Privacy trees
- New well pump
- New septic pump
Tags
Neighborhood map
What this means for you Summary
Snapshot
- This is a 3-bed/2.0-bath manufactured listed at $140k.
Deal economics
- At list price, monthly cash flow is $639 ($8k/yr) — positive.
- The deal already cash-flows at list — no discount required.
- Meets the 1% rule at list price ($2k rent vs $140k).
- Recommended offer: $123k (12.0% below list) — sets the bar for market timing.
- Cap rate 11.8% vs local median 4.7% in Springfield — top-decile yield for the area; either an underpriced asset or a hidden risk that comps aren't pricing in. Stress-test before assuming the spread holds.
Location & tenants
- Location reads 59/100 on livability (#826 in FL) — a working-class tenant base; expect higher turnover. Strengths: cost of living A+, housing A+, health & safety A+; Watch: schools D, employment D, crime F.
- Bay (suburban): math 51% / reading 51% proficiency, ranked #29 of 73 in FL (top 40%) — acceptable for families but not a draw, mixed tenant base, ~2y average lease.
- Market conditions: Rents rising (+1.1%/yr); 969 active listings in the ZIP; 6 comparable units currently listed for rent nearby; rentals at typical pace (median 21d on market — plan ~3-4 weeks tenant-placement turnaround); 2,473 units permitted in Bay County in 2024 (559 in 5+ unit buildings).
- This rent runs 31% of the median local income ($75k/yr) — at the standard rent-burdened threshold; future hikes will face affordability resistance.
Forward outlook
- Local home prices are declining (-3.0%/yr); year-one equity from $968 of loan paydown is wiped out by about $4k of value loss. Plan a longer hold.
- Bay County population projected at +24% by 2050 — long-run rental-demand tailwind backs the buy-and-hold thesis.
- At projected returns (-3.0% appreciation + 1.1% rent growth), your $39k cash investment doubles in ~8 years — after that, you're playing with house money.
Negotiation context
- It's been on market 153 days — a 12% lower offer ($123k) is reasonable based on typical stale-listing flexibility.
- 4 sale attempts since 14y ago with the ask held roughly flat each time — persistent listings suggest the price (not the market) is what's stuck; bring a comps-based counter.
Risks & watch-outs
- Climate carrying-cost: severe wind risk, 99% chance of damaging wind over 30y; major wildfire risk; extreme-heat days projected 7→21/yr by 2055 (HVAC capex compounding) — expect insurance premiums to compound above CPI over the hold.
Questions for the listing agent
- It's been on market 153 days. Have you received any prior offers? Is the seller open to a 12% concession, seller financing, or rate buy-down credit?
- Why hasn't it sold? Are there any deal-killer items the seller is aware of (foundation, flood, title, zoning, code violations)?
- Is there a deadline driving the sale (1031 exchange, divorce, estate, relocation)? That informs how much negotiation room exists.
- Schools are D-rated, which usually means shorter tenancies and higher turnover. Who's the typical renter profile here, and what's been the actual vacancy rate?
- Crime grade is F in this area — have there been break-ins, vandalism, or insurance claims at this property in the last 3 years? What carrier currently insures it and at what premium?
- What's the average days-on-market for RENTAL listings here right now (not sales)? A rising rental-DOM trend means longer vacancies and softer asking-rent achievability than the comps imply.
- What's the recent tenant-quality profile in this submarket — average credit score on applications, eviction rate, late-payment / NSF rate, and stable-employment percentage? A property-management company in the area should have these aggregated.
- How much new for-sale + rental construction is in the pipeline within 1–3 miles? Heavy new supply typically softens prices + rents 12–24 months out; constrained supply supports both.
Investment metrics
- 1% rule
- 1.39% ✓
- Cap rate
- 11.77%
- Cash-on-cash
- 19.57%
- DSCR
- 1.87
- GRM
- 6.0
CMA / ARV
- ARV (median comp)
- $222,826
- List price
- $140,000
- Delta
- -37.17%
- Verdict
- UNDERPRICED
- Comps
- 1 within 2.0 mi
Show comp detail 2 sales within ~0.75 mi
| Address | Dist | Beds/Ba | Sqft | Sold | Price | $/sf | Match |
|---|---|---|---|---|---|---|---|
| 3510 E Orlando Rd | 0.33mi | 3/2.0 | 1,800 (+1%) | 14mo | $210,000 | $117 | 71 |
| 3716 Haley Ln | 0.27mi | 3/2.0 | 1,998 (+12%) | 11mo | $225,000 | $113 | 58 |
Match score weights: distance 35% · size 25% · config 20% · recency 20%. Top-matched comps best support the ARV.
Projected returns pro-forma
-3.0% appreciation · 1.12% rent growth · sell at horizon
- IRR
- 9.5%
- Equity multiple
- 1.37×
- Total profit
- $14,392
- Equity at exit
- $20,874
- IRR
- 17.1%
- Equity multiple
- 2.29×
- Total profit
- $50,604
- Equity at exit
- $12,105
Cash invested: $39,200 (down + closing). Projections, not guarantees.
Landlord ↔ Tenant lean methodology
- Overall (STATE)
- 87 Strongly Landlord-Friendly
- State Florida
- 87 Strongly Landlord-Friendly · R+3
- County
- — inherits STATE
- City
- — inherits STATE
ZIP-level market 32404
- Home prices YoY
- -16.1%
- Rents YoY
- 1.1%
- Active inventory
- 969
- Price-to-rent
- 6.0×
Monthly cashflow live
- Estimated rent
- $1,949 high interval (Pro) →
- Mortgage (P&I)
- −$734
- Tax from tax record
- −$108 /mo · $1,295/yr
- Insurance
- −$58
- HOA
- −$0
- Vacancy / Maint / Mgmt
- −$409
- Net cashflow
- $639
Break-even live
UW: 25.0% down · 7.5% · 30yr · 1.5% tax · 5.0% vac · 8.0% maint · 8.0% mgmt
Financing live
Cash to close
- Down payment
- $35,000
- Closing costs
- $4,200
- Reserves months
- —
- Total cash needed
- —
Loan-product check · same deal, 3 products live
Conventional
25% down · 7.5% · 30yr
- Down + closing
- —
- Monthly P&I
- —
- Monthly cashflow
- —
- DSCR
- —
- Eligible?
- —
Personal DTI + credit; lowest rate.
DSCR
20% down · 8.5% · 30yr
- Down + closing
- —
- Monthly P&I
- —
- Monthly cashflow
- —
- DSCR
- —
- Eligible?
- —
No personal income docs; deal must DSCR.
Hard money
10% down · 12.0% · 12mo
- Down + closing
- —
- Monthly P&I
- —
- Monthly cashflow
- —
- DSCR
- —
- Eligible?
- —
Short-term bridge; refi at stabilization.
Rent comps 6 comps
| Address | Beds | Baths | Sqft | Rent | $/sqft | DOM | Units | Dist |
|---|---|---|---|---|---|---|---|---|
| 3525 T St Panama City, FL | 3.0 | 2.0 | 1250 | $1,600 | $1.28 | 21d | 1 | 0.15mi |
| 3733 Avon Rd Panama City, FL | 3.0 | 2.0 | 1251 | $1,900 | $1.52 | 21d | 1 | 0.51mi |
| 3884 Red Deer Cir Panama City, FL | 4.0 | 2.0 | 1972 | $2,200 | $1.12 | 21d | 1 | 0.53mi |
| 2601 Avondale Ct Panama City, FL | 3.0 | 2.5 | 1371 | $1,700 | $1.24 | 13d | 1 | 0.57mi |
| 3545 Brentwood Pl Panama City, FL | 3.0 | 2.0 | 1617 | $2,200 | $1.36 | 21d | 1 | 0.85mi |
| 2433 Wakulla Ave Panama City, FL | 4.0 | 2.0 | 1612 | $1,600 | $0.99 | 13d | 1 | 1.33mi |
Listing history 26 events
-
2026-06-19days on market $140,000 Active 153 DOM
-
2026-06-18days on market $140,000 Active 152 DOM
-
2026-06-17days on market $140,000 Active 151 DOM
-
2026-06-16days on market $140,000 Active 150 DOM
-
2026-06-15days on market $140,000 Active 149 DOM
-
2026-06-14days on market $140,000 Active 147 DOM
-
2026-06-13days on market $140,000 Active 146 DOM
-
2026-06-10days on market $140,000 Active 144 DOM
-
2026-06-09days on market $140,000 Active 143 DOM
-
2026-06-08days on market $140,000 Active 142 DOM
-
2026-06-07days on market $140,000 Active 141 DOM
-
2026-06-05days on market $140,000 Active 138 DOM
-
2026-06-03days on market $140,000 Active 137 DOM
-
2026-06-02days on market $140,000 Active 136 DOM
-
2026-06-01days on market $140,000 Active 135 DOM
-
2026-05-31days on market $140,000 Active 134 DOM
-
2026-05-30days on market $140,000 Active 133 DOM
-
2026-01-16$140,000 Active 860-char remark
Show marketing remark (860 chars)
Spacious 4 bedroom, 3 bath home with an open floor plan sitting on a huge corner lot just over 3/4 of an acre. Located only about 20 minutes from Panama City Beach, you get the perfect mix of space and convenience. Enjoy a fully covered front porch, privacy trees lining the front of the property, and a partially fenced yard with plenty of room to spread out. Out back you'll find a 20x20 shed for storage, hobbies, or workspace. Major updates already handled with a new roof in 2019 and both the septic pump and well pump replaced in 2018. All appliances convey, making this one move-in ready. One of the standout features is a bedroom with its own private entrance, perfect for a mother-in-law suite, guests, or even potential rental use. If you've been looking for space, flexibility, and a great location close to the beach, this one checks all the boxes.
-
2021-12-09historical
-
2018-11-27soldstatus $345,000
-
2018-11-26soldstatus $45,000
-
2018-07-05$50,000
-
2016-08-12soldstatus $45,000
-
2016-08-12soldstatus $45,000
-
2016-01-22$59,900
-
2012-12-14$89,900
ⓘ Source: listings_history table (triggers on properties + properties_extension) + one-shot
backfill from property_details.listing_events for pre-trigger history.
Tax reassessment forecast FL · Resets to sale price
- Current annual tax
- $1,295 · $108/mo
- Projected year-2 tax
- $1,295 · $108/mo
- Expected delta
- $0/yr ($0/mo · 0.0%)
ⓘ Screening estimate from a state-policy table — verify with the county assessor before closing.
Climate risk First Street
- Flood 4/10 Moderate FEMA zone X (unshaded) · 22% chance over 30 yrs
- Wildfire 6/10 Major
- Heat 10/10 Extreme 7 d/yr ≥105°F today · 21 d/yr by 30 yrs out
- Wind 9/10 Extreme 99% chance of damaging wind over 30 yrs
- Air quality 1/10 Low 0 unhealthy d/yr today · 0 by 30 yrs out
Nearby sold comps map
Loading sold comps map…
Walkable amenities ~0.75 mi
Loading nearby amenities…
Taxation est. · year 1
- Rental income
- $23,387
- − Mortgage interest
- −$7,842
- − Property taxes
- −$1,295
- − Insurance
- −$700
- − Repairs & maintenance
- −$1,871
- − Management
- −$1,871
- − Depreciation
- −$4,073
- Taxable income
- $5,734
- Est. tax owed @ 24.0%
- −$1,376
- After-tax cash flow
- $6,294/yr
For passive investors: Depreciation is non-cash, so a rental often shows a tax loss while cash-flowing — sheltering income. Rental losses are passive: they offset passive income freely, and up to $25,000/yr can offset ordinary (W-2) income if you actively participate and your MAGI is under $100k (phasing out to $0 by $150k); unused losses carry forward. On sale, claimed depreciation is recaptured at up to 25%, and gains may owe capital-gains tax (a 1031 exchange can defer both). Figures are a year-1 estimate at your 24.0% rate — not tax advice; consult a CPA.
Schools (NCES district)
- District
- Bay
- NCES district ID
- 1200090
- Math proficiency
- 51% ▼ -8.00%
- Reading proficiency
- 51% ▼ -7.00%
- Median HH income
- $47,740
- Composite
- 43.41/100
- National rank
- #3014
- State rank
- #29 of 73 in FL
Livability — Springfield
- Score
- 59/100
- State rank
- #826
- US rank
- #20265
Category grades
Schools grade is shown separately in the Schools card above.
Census & demographics
- County
- Bay County · 163,593 people
- Metro
- Panama City, FL
- Population (ZIP)
- 42,514
- Household income
- $74,708
- Rent vs Own
- Severe rent burden
- 1218.0
Population outlook (Bay County) Hauer SSP2
- Today (2025)
- 206,264 people
- By 2030
- 217,740 · +5.6%
- By 2040
- 238,738 · +15.7%
- By 2050
- 255,545 · +23.9%
- By 2075
- 288,295 · +39.8%
- By 2100
- 288,638 · +39.9%
Race, ethnicity, and origin ACS 2023
- Neighborhood character
- Predominantly White (69%)
- Race & ethnicity
- White 69% Black 12% Two or more races 10% Hispanic / Latino 9% Asian 3%
- Hispanic origin (detail)
- Mexican 2% Puerto Rican 3%
- Common ancestry
- Lithuanian 3% Slovak 2% Italian 2%
- Foreign-born
- 7% · Canada, Vietnam, Mexico
- Languages at home
- 90% English-only · Spanish 6% Vietnamese 1% Other Asian/Pacific 1%
Political lean MEDSL · Bay
- 2024 margin
- Solid R (+47.4) · D 25.8% · R 73.1% · Other 1.1%
- 2008→2024 swing
- -6.6pp toward R · 2008: -40.7pp · 2024: -47.4pp
- All cycles
- 2024: R+47.4 2020: R+43.5 2016: R+46.3 2012: R+43.6 2008: R+40.7
Not yet ingested
- Civics
- —
Market trends
- HPI YoY
- ▼ -50.59%
- Current HPI
- 263.7178
- Rent YoY
- ▲ 1.12%
- Metro
- Panama City, FL
- State GDP YoY
- ▲ 3.28%
- F500 in state
- 36
Industry mix (Fortune 500 HQ in FL)
| Industry | F500 HQs | Revenue |
|---|---|---|
| Industrial Technology | 2 | $29B |
|
||
| Insurance | 2 | $17B |
|
||
| Retail | 1 | $60B |
|
||
| Technology Distribution | 1 | $58B |
|
||
| Homebuilding | 1 | $35B |
|
||
| Technology Manufacturing | 1 | $35B |
|
||
Price history
+55.7% since first listed9 events — show timeline
- 2026-01-16 Listed $140,000 CPARMLS
- 2021-12-09 Listing Removed — CPARMLS
- 2018-11-27 Sold (Public Records) $345,000 Public Records
- 2018-11-26 Sold (MLS) $45,000 CPARMLS
- 2018-07-05 Listed $50,000 CPARMLS
- 2016-08-12 Sold (Public Records) $45,000 Public Records
- 2016-08-12 Sold (MLS) $45,000 CPARMLS
- 2016-01-22 Listed $59,900 CPARMLS
- 2012-12-14 Listed $89,900 CPARMLS
Property tax history
+3.5%/yrLatest (2025): $1,295 · +14.7% YoY. Source: county tax records.
Cash-flow waterfall
monthlySold comps — $/sqft
last 12 mo · ≤1 miLoading sold comps…