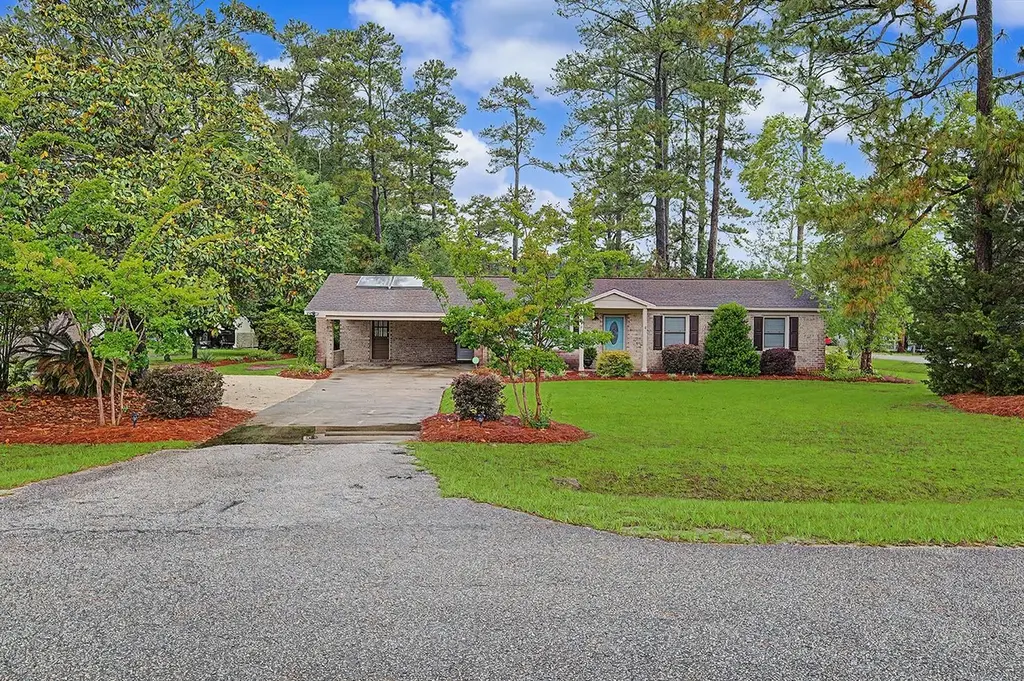
111 Tallahassee Rd · Georgetown, SC
Flood risk 1/10 · Minimal
- FEMA flood zone
- X (unshaded)
- Chance of flooding over 30 yrs
- 0.0%
- Est. flood insurance / yr
- $507 – $1,088
Fire risk 5/10 · Moderate
- Est. fire insurance / yr
- $783 – $1,453
Heat risk 9/10 · Severe
- Hot days now (above 108°F)
- 7 days/yr
- Hot days in 30 yrs
- 17 days/yr
Wind risk 8/10 · Major
- Chance of severe wind over 30 yrs
- 99.0%
Air-quality risk 2/10 · Minimal
- Unhealthy air days now
- 0 days/yr
- Unhealthy air days in 30 yrs
- 1 days/yr
Risk factors via First Street. Map © Google.
Why this score? — see what drove the D grade
The composite is a weighted blend of 9 inputs, each scored 0–100. Each bar is that input's sub-score; the figure is the points it added to the 100-point composite (weight × sub-score).
- Cash flow +16.2/30.0
- ARV discount +7.4/15.0
- DSCR +5.0/10.0
- 1% rule +3.2/10.0
- Livability +3.2/5.0
- Schools +2.7/10.0
- Rent growth +2.5/5.0
- Condition / age +2.5/5.0
- Appreciation +0.0/10.0
$289,999
🖨 Deal sheet (PDF) 📄 Offer letter ✓ Due diligence
Listing remarks MLS
BRICK HOME IN WONDERFUL NEIGHBORHOOD, LOCATED ON THE CORNER OF TALLAHASEE AND AMANDA DRIVE. TWO CAR CARPORT, SUNROOM OVERLOOKING NICE BACK YARD, NEW VINYL WINDOWS THROUGHOUT, HEAT PUMP NEW IN 2000.
Key facts
- Formal dining room
- Spacious backyard
- Large corner lot
Tags
Property features AI
Finance
- Other: Solar panels / solar energy generation; Zoned residential
- HOA & community: Monthly association fee
Exterior
- Parking: Carport; 6 parking spaces
- Utilities: Cable available; Electricity available; Phone available
- Home design: Single-story; Brick construction; Resale property
- Construction: Brick foundation (brick/mortar)
- Exterior features: Corner lot; Outside city limits; Rectangular lot
Interior
- Kitchen: Dishwasher; Microwave; Range; Refrigerator
- Flooring: Carpet; Laminate; Tile
- Bathrooms: 2 full bathrooms
- Heating & cooling: Central heating; Central air conditioning
- Interior features: Ceiling fans; Separate shower; Breakfast bar; Stainless steel appliances; Unfurnished
- Laundry & utility: Washer hookup
Neighborhood map
What this means for you Summary
Snapshot
- This is a 3-bed/1.0-bath single-family listed at $290k.
Deal economics
- At list price, monthly cash flow is $153 ($2k/yr) — positive.
- The deal already cash-flows at list — no discount required.
- To meet the 1% rule (rent ≥ 1% of price), the offer needs to be $238k (17.9% below list).
- Recommended offer: $238k (17.9% below list) — sets the bar for 1% rule.
- Cap rate 6.9% vs local median 4.7% in Georgetown — top-decile yield for the area; either an underpriced asset or a hidden risk that comps aren't pricing in. Stress-test before assuming the spread holds.
Location & tenants
- Location reads 65/100 on livability (#141 in SC) — a middle-class / working-renter tenant base. Strengths: cost of living A+, housing A+, health & safety A+; Watch: amenities D, crime F, commute F.
- Georgetown 01 (town): math 26% / reading 38% proficiency, ranked #51 of 80 in SC (top 64%) — families likely to look elsewhere, expect single-tenant / working-renter base with shorter leases.
- Zoned schools: Kensington Elementary (math 34% / reading 31%, grade F, #366 of 597 statewide, top 62%, 555 students, 100% FRL); Georgetown Middle (math 15% / reading 23%, grade F, #185 of 229 statewide, top 81%, 712 students, 100% FRL); Georgetown High (math 27% / reading 75%, grade D+, #148 of 196 statewide, top 76%, 940 students, 77% FRL) — zoned schools average 92% FRL vs 59% district-wide (33 pts higher); higher-poverty schools than district average — tighter screening recommended.
- Market conditions: 412 active listings in the ZIP; 323 units permitted in Georgetown County in 2024 (0 in 5+ unit buildings).
Forward outlook
- Local home prices are declining (-3.0%/yr); year-one equity from $2k of loan paydown is wiped out by about $9k of value loss. Plan a longer hold.
Negotiation context
- Only 11 days on market — expect competitive offers; lowballing is unlikely to land.
- 2 sale attempts since 21y ago with the ask held roughly flat each time — persistent listings suggest the price (not the market) is what's stuck; bring a comps-based counter.
- Current owner paid $138k; list at $290k implies a 110% gain — meaningful room to come down on a strong offer.
Risks & watch-outs
- Climate carrying-cost: severe wind risk, 99% chance of damaging wind over 30y; moderate wildfire risk; extreme-heat days projected 7→17/yr by 2055 (HVAC capex compounding) — expect insurance premiums to compound above CPI over the hold.
Questions for the listing agent
- Built in 1972 — when were the roof, HVAC, electrical panel, plumbing, and water heater last replaced?
- Is there a deadline driving the sale (1031 exchange, divorce, estate, relocation)? That informs how much negotiation room exists.
- Schools are F-rated, which usually means shorter tenancies and higher turnover. Who's the typical renter profile here, and what's been the actual vacancy rate?
- Crime grade is F in this area — have there been break-ins, vandalism, or insurance claims at this property in the last 3 years? What carrier currently insures it and at what premium?
- The area grade is low — what's the realistic commute time and amenity access for the typical tenant pool here? Any planned neighborhood developments (good or bad) we should know about?
- What's the average days-on-market for RENTAL listings here right now (not sales)? A rising rental-DOM trend means longer vacancies and softer asking-rent achievability than the comps imply.
- What's the recent tenant-quality profile in this submarket — average credit score on applications, eviction rate, late-payment / NSF rate, and stable-employment percentage? A property-management company in the area should have these aggregated.
- How much new for-sale + rental construction is in the pipeline within 1–3 miles? Heavy new supply typically softens prices + rents 12–24 months out; constrained supply supports both.
Investment metrics
- 1% rule
- 0.82% ✗
- Cap rate
- 6.93%
- Cash-on-cash
- 2.26%
- DSCR
- 1.10
- GRM
- 10.2
CMA / ARV
- ARV (on-the-fly)
- $289,380
- Comps found
- 1
Show comp detail 1 sale within ~0.75 mi
| Address | Dist | Beds/Ba | Sqft | Sold | Price | $/sf | Match |
|---|---|---|---|---|---|---|---|
| 102 Lot 53 Telfair Rd - Kokomo Telfair Rd | 0.17mi | 3/2.0 | 1,535 (+12%) | 12mo | $324,990 | $212 | 57 |
Match score weights: distance 35% · size 25% · config 20% · recency 20%. Top-matched comps best support the ARV.
Projected returns pro-forma
-3.0% appreciation · 3.0% rent growth · sell at horizon
- IRR
- -12.8%
- Equity multiple
- 0.54×
- Total profit
- $-37,389
- Equity at exit
- $43,240
- IRR
- -3.8%
- Equity multiple
- 0.75×
- Total profit
- $-20,564
- Equity at exit
- $25,074
Cash invested: $81,200 (down + closing). Projections, not guarantees.
Landlord ↔ Tenant lean methodology
- Overall (STATE)
- 90 Strongly Landlord-Friendly
- State South Carolina
- 90 Strongly Landlord-Friendly · R+6
- County
- — inherits STATE
- City
- — inherits STATE
ZIP-level market 29440
- Home prices YoY
- -34.9%
- Active inventory
- 412
- Price-to-rent
- 10.2×
Monthly cashflow live
- Estimated rent
- $2,381 medium interval (Pro) →
- Mortgage (P&I)
- −$1,521
- Tax from tax record
- −$86 /mo · $1,034/yr
- Insurance
- −$121
- HOA
- −$0
- Vacancy / Maint / Mgmt
- −$500
- Net cashflow
- $153
Break-even live
Sensitivity live
| Price | -10% $317 | -5% $235 | +0% $153 | +5% $71 | +10% $-11 |
|---|---|---|---|---|---|
| Rent | -10% $-35 | -5% $59 | +0% $153 | +5% $247 | +10% $341 |
| Rate | -1.0pp $299 | -0.5pp $227 | base $153 | +0.5pp $78 | +1.0pp $1 |
UW: 25.0% down · 7.5% · 30yr · 1.5% tax · 5.0% vac · 8.0% maint · 8.0% mgmt
Financing live
Cash to close
- Down payment
- $72,500
- Closing costs
- $8,700
- Reserves months
- —
- Total cash needed
- —
Loan-product check · same deal, 3 products live
Conventional
25% down · 7.5% · 30yr
- Down + closing
- —
- Monthly P&I
- —
- Monthly cashflow
- —
- DSCR
- —
- Eligible?
- —
Personal DTI + credit; lowest rate.
DSCR
20% down · 8.5% · 30yr
- Down + closing
- —
- Monthly P&I
- —
- Monthly cashflow
- —
- DSCR
- —
- Eligible?
- —
No personal income docs; deal must DSCR.
Hard money
10% down · 12.0% · 12mo
- Down + closing
- —
- Monthly P&I
- —
- Monthly cashflow
- —
- DSCR
- —
- Eligible?
- —
Short-term bridge; refi at stabilization.
Listing history 8 events
-
2026-06-14statusdays on market $289,999 Pending 11 DOM
-
2026-06-10days on market $289,999 Active 9 DOM
-
2026-06-09days on market $289,999 Active 8 DOM
-
2026-06-08days on market $289,999 Active 7 DOM
-
2026-06-07days on market $289,999 Active 6 DOM
-
2026-06-03days on market $289,999 Active 2 DOM
-
2026-06-02remarks 687-char remark
-
2026-06-02$289,999 Active 1 DOM
ⓘ Source: listings_history table (triggers on properties + properties_extension) + one-shot
backfill from property_details.listing_events for pre-trigger history.
Tax reassessment forecast SC · Resets to sale price
- Current annual tax
- $1,034 · $86/mo
- Projected year-2 tax
- $1,653 · $138/mo
- Expected delta
- +$619/yr (+$52/mo · 59.8%)
ⓘ Screening estimate from a state-policy table — verify with the county assessor before closing.
Climate risk First Street
- Flood 1/10 Low FEMA zone X (unshaded) · 0% chance over 30 yrs
- Wildfire 5/10 Major
- Heat 9/10 Extreme 7 d/yr ≥108°F today · 17 d/yr by 30 yrs out
- Wind 8/10 Severe 99% chance of damaging wind over 30 yrs
- Air quality 2/10 Low 0 unhealthy d/yr today · 1 by 30 yrs out
Nearby sold comps map
Loading sold comps map…
Walkable amenities ~0.75 mi
Loading nearby amenities…
Taxation est. · year 1
- Rental income
- $28,568
- − Mortgage interest
- −$16,244
- − Property taxes
- −$1,034
- − Insurance
- −$1,450
- − Repairs & maintenance
- −$2,285
- − Management
- −$2,285
- − Depreciation
- −$8,436
- Taxable loss
- −$3,168
- Est. tax savings @ 24.0%
- +$760
- After-tax cash flow
- $2,595/yr
For passive investors: Depreciation is non-cash, so a rental often shows a tax loss while cash-flowing — sheltering income. Rental losses are passive: they offset passive income freely, and up to $25,000/yr can offset ordinary (W-2) income if you actively participate and your MAGI is under $100k (phasing out to $0 by $150k); unused losses carry forward. On sale, claimed depreciation is recaptured at up to 25%, and gains may owe capital-gains tax (a 1031 exchange can defer both). Figures are a year-1 estimate at your 24.0% rate — not tax advice; consult a CPA.
Schools (NCES district)
- District
- Georgetown 01
- NCES district ID
- 4502280
- Math proficiency
- 26% ▼ -11.00%
- Reading proficiency
- 38% ▼ -5.00%
- Median HH income
- $43,045
- Composite
- 27.15/100
- National rank
- #7030
- State rank
- #51 of 80 in SC
Livability — Georgetown
- Score
- 65/100
- State rank
- #141
- US rank
- #13446
Category grades
Schools grade is shown separately in the Schools card above.
Census & demographics
- Population (ZIP)
- 26,419
Population outlook (Georgetown County) Hauer SSP2
- Today (2025)
- 63,275 people
- By 2030
- 63,630 · +0.6%
- By 2040
- 63,130 · -0.2%
- By 2050
- 61,904 · -2.2%
- By 2075
- 59,305 · -6.3%
- By 2100
- 53,852 · -14.9%
Race, ethnicity, and origin ACS 2023
- Neighborhood character
- Majority White (52%)
- Race & ethnicity
- White 52% Black 45% Hispanic / Latino 2%
- Common ancestry
- Italian 3% Lithuanian 2% Slovak 1%
- Foreign-born
- 3% · Canada
- Languages at home
- 97% English-only · Spanish 2%
Political lean MEDSL · Georgetown
- 2024 margin
- R (+19.5) · D 39.6% · R 59.1% · Other 1.2%
- 2008→2024 swing
- -14.2pp toward R · 2008: -5.2pp · 2024: -19.5pp
- All cycles
- 2024: R+19.5 2020: R+12.7 2016: R+13.0 2012: R+7.6 2008: R+5.2
Not yet ingested
- Civics
- —
Market trends
- HPI YoY
- ▼ -111.84%
- Current HPI
- 208.6792
- Rent YoY
- —
- Metro
- —
- State GDP YoY
- ▲ 4.51%
- F500 in state
- 2
Industry mix (Fortune 500 HQ in SC)
| Industry | F500 HQs | Revenue |
|---|---|---|
| Packaging | 1 | $7B |
|
||
Price history
+107.3% since first listed4 events — show timeline
- 2026-06-01 Listed $289,999 CCAR
- 2005-10-31 Sold (Public Records) $138,000 Public Records
- 2005-10-28 Sold (MLS) $138,000 CCAR
- 2005-09-22 Listed $139,900 CCAR
Property tax history
+4.5%/yrLatest (2025): $1,034 · +5.7% YoY. Source: county tax records.
Cash-flow waterfall
monthlySold comps — $/sqft
last 12 mo · ≤1 miLoading sold comps…